to our fellow shareholders, employees and · pdf fileas we execute our growth strategy. ......
TRANSCRIPT

2014 was another year of progress for Hill‑Rom. It was a year in which we expanded our geographic and product reach by acquiring Trumpf Medical and saw the value of our portfolio expansion demonstrated by outstanding results in our Surgical and Respiratory Care business. Operationally, we continued focusing on optimizing our earnings and cash flow, strengthened our leadership with significant senior appointments, and invested in our future. Whether it was in the hospital room, the operating room, the ICU or the home, 2014 saw those of us at Hill‑Rom — every day, around the world — enhancing outcomes for patients and their caregivers.
We were particularly excited to welcome Trumpf Medical to Hill‑Rom during 2014. Trumpf Medical has long been a market and innovation leader with a diverse line of integrated operating room solutions. Trumpf Medical’s products and services, which include tables, modular equipment management systems, lighting and video solutions for the operating room, are an outstanding complement to our Aspen Surgical and Allen Medical businesses. Like Hill‑Rom, Trumpf Medical has a legacy of innovation, quality and passionate employees.
Adding Trumpf Medical to our portfolio more than doubled the size of our surgical offering. Trumpf Medical adds approximately $250 million in revenue, over 80% of which is outside the United States. With a third of its total
revenues in high‑growth markets such as Asia/Pacific, the Middle East, Eastern Europe and Latin America, Trumpf Medical grew at a compound annual rate of 6% from 2010 to 2013. So in addition to adding a highly innovative and high‑quality product offering to our portfolio, Trumpf Medical brings a growing revenue base in important global markets. Along with expanding our international footprint and adding new global customer partnerships, we are particularly excited about the opportunity to leverage the channel strength we enjoy in our North American Patient Support Systems business to accelerate Trumpf Medical’s growth in this region. We are very pleased with the integration and performance of the Trumpf Medical business to date.
Hill‑Rom
2014 Letter to Shareholders
To Our Fellow Shareholders, Employees and Customers:
TruLight® 5000 Surgical Light TruSystem® 7500 Operating Table TruPort® System

Innovation Fuels Our Growth
Progressa® Bed SystemThe Progressa Bed, our new global Intensive Care Unit (ICU) bed, drove our 2014 ICU revenue to a three‑year high. The Progressa Bed is a therapeutic device that helps support early mobility in patients, and is intended for use in treating or preventing complications associated with immobility. The Progressa Bed is also the first frame to offer Hill‑Rom’s StayInPlace™ Technology, which helps address patient migration to the foot of the bed. We’re proud of the Progressa Bed and the reception it has received from our customers.
Allen® Advance Spine Table2014 was also the first full year of sales for the Allen Advance Spine Table. A game‑changing device in complex spinal surgeries, the Allen Advance Spine Table offers radiolucency through the working length of the table, improved user interfaces and unprecedented safety features. The Allen Advance Spine Table captured significant customer attention and orders during 2014.
VitalCough™ SystemIn our Respiratory Care business, we launched the VitalCough System, and the MetaNeb® System completed its first full year on the market. Designed for ease of use across the health care continuum, the VitalCough System is the perfect complement to our market‑leading The Vest® Airway Clearance System. The VitalCough System provides a noninvasive therapy that stimulates a cough to remove secretions in patients with compromised peak cough flow. Like the VitalCough System, the MetaNeb System maximizes efficiency for patients and clinicians by addressing multiple therapeutic needs with a single, integrated treatment.
Centuris™ BedThe Centuris bed, a new Med/Surg bed for use throughout the hospital, designed for the variable requirements in many of our international markets, debuted at Arab Health in 2014. The Centuris bed is intended for large, fast‑growing markets such as China, India, Latin America and the Middle East.
CONTINUOUSIMPROVEMENTCreates Simplicity
INNOVATIONFuels Our Growth
FINANCIALDISCIPLINE
Drives Value
QUALITYMATTERSIn All We Do
PATIENTS ANDCAREGIVERSAre Our Passion
PEOPLEINSPIRED
To Win Together
FUN
RESULT
S
RESPONSIVENESS
RESP
ECT
Our
Commitment
PROCESS
PLAN
PE
RF
OR
MA
NC
E
Our commitment to Research and Development investment has continued to grow, and 2014 was no exception. Our R&D investment has been highly productive and has resulted in an exciting array of new products.
2 | Hill-Rom 2014 Letter to Shareholders

In 2014, our company continued to invest for growth while navigating a difficult operating environment. We encountered choppy end markets in North America and most of Europe for capital spending by our customers. As a result, full‑year revenue and adjusted earnings per share were down 2% and 5%, respectively, compared to the prior year. While overall revenue declined, we saw strong growth in our Surgical and Respiratory Care business, with revenue increasing 7% compared to the prior year, excluding the benefit of the Trumpf Medical acquisition. In addition, we increased investment in Research & Development for the fifth year in a row. The benefits from our increased innovation investment are reflected in some of our new product introductions.
As 2014 progressed, we continued to build momentum. Adjusted earnings compared favorably to the prior year in each of the last three quarters of the year and we saw a 10%
year over year increase in revenue during the fourth quarter. We also achieved significant growth in customer orders in our North America capital business during the second half of
the year and we ended the year with our order backlog up approximately 50% from the prior year. Together with the benefit of the Trumpf Medical acquisition, we are entering 2015 with strong
momentum and we expect double digit revenue growth for the full year.
During the year, we took actions to improve our cost structure, consistent with our ongoing objective to aggressively drive margin improvement. We worked to restructure the organization throughout North America and Europe, efforts expected to save approximately $30 million once fully implemented.
So while we were disappointed with the decline in revenue and adjusted earnings for the full year, we are pleased to be entering 2015 with the strongest momentum and growth expectations that we have had for several years. We are proud of the actions we have taken to aggressively manage the business in challenging environments around the world, and we will continue to stay focused on doing so while we drive accelerated growth in the years ahead.
Financial Discipline Drives Value
CONTINUOUSIMPROVEMENTCreates Simplicity
INNOVATIONFuels Our Growth
FINANCIALDISCIPLINE
Drives Value
QUALITYMATTERSIn All We Do
PATIENTS ANDCAREGIVERSAre Our Passion
PEOPLEINSPIRED
To Win Together
FUN
RESULT
S
RESPONSIVENESS
RESP
ECT
Our
Commitment
PROCESS
PLAN
PE
RF
OR
MA
NC
E
11.59.0
20142009
Adjusted Operating Margin (%)
$72$56
20142009
Annual R&D Spend
Hill-Rom 2014 Letter to Shareholders | 3
Hill‑Rom has unparalleled brand equity and we are building on that to deepen our customer relationships. Our customers are facing unprecedented challenges, and we support them by offering solutions that both improve outcomes and lower costs. For this reason, we are intensifying our focus on growth, both organically and via acquisitions, to provide the scope and scale necessary to be the best possible partner to our customers.
A s d e m o n s t r a t e d b y o u r acquisition of Trumpf Medical, we are not only driving organic growth through innovation and geographic expansion, but are actively pursuing acquisitions that will heighten our relevance to our customers by expanding either our geographic reach or product portfolio.
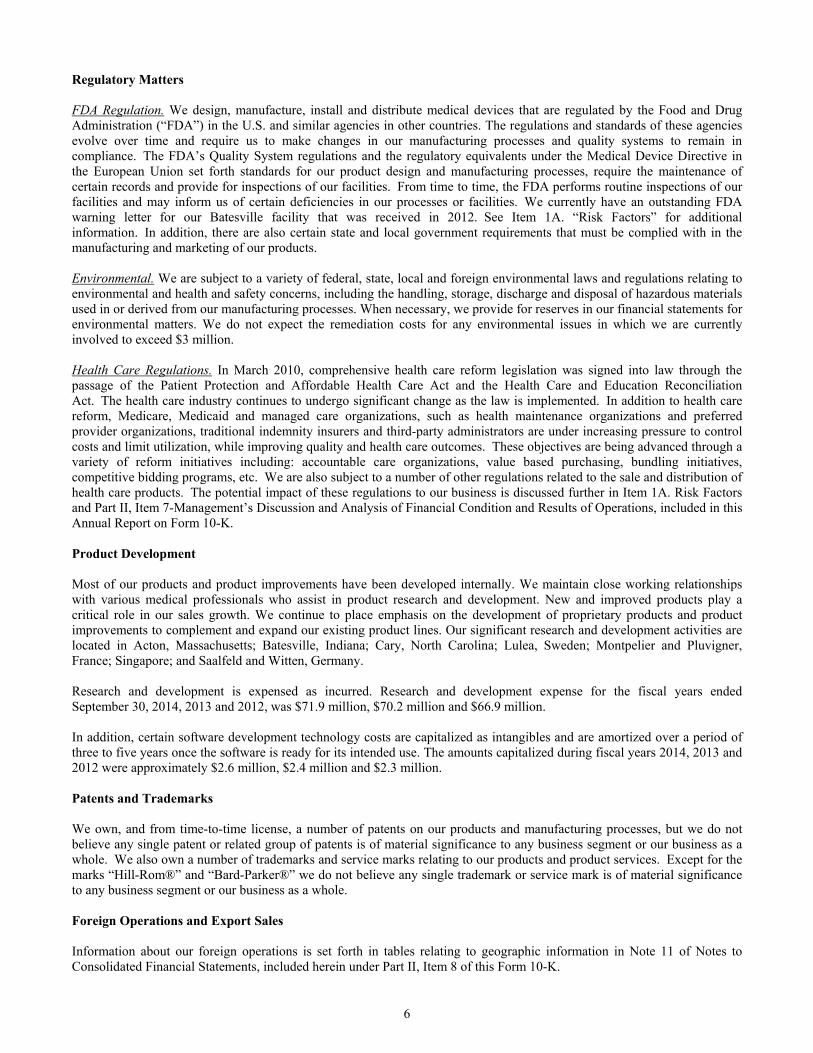
We will continue to pursue opportunities in our five Clinical Focus Areas: Advancing Mobility, Wound Care and Prevention, Clinical Workflow, Surgical Safety and Efficiency, and Respiratory Health. We will look to expand our portfolio to strengthen our ability to provide unique solutions to our customers’ problems. Our track record of capital deployment discipline reflects a healthy balance between investing in the business and returning cash to shareholders. Balance will remain a guiding principle as we manage the company to deliver consistent profitable growth and excellent investment returns.
During 2014, we added two outstanding executives to Hill‑Rom’s management team. Carlyn Solomon joined us as our Chief Operating Officer. A seasoned health care executive, Carlyn came to Hill‑Rom from Edwards Lifesciences, where he spent nine years, most recently leading its Critical Care and Vascular businesses. Nothing is more important than the quality of our team, and I am
delighted to have someone with Carlyn’s experience and proven ability join us and partner with me as we execute our growth strategy. Carlyn has responsibility for all of our global Commercial, Research and Development, Supply Chain and Quality Assurance operations. Having Carlyn here as COO will enable me to focus even more of my time and energy on our growth strategies.
We also welcomed a new Chief Financial Officer during 2014. Steve Strobel brings to Hill‑Rom a wealth of experience in large global organizations as well as smaller, entrepreneurial environments. Hill‑Rom’s Finance and Information Technology teams report to Steve. Previously, he was CFO at Blue Star Energy Solutions, and has also served as Treasurer and Corporate Controller at Motorola and Owens Corning. Steve sits on the board of Newell Rubbermaid, where he chairs the audit committee.
I am excited to have Carlyn and Steve join Hill‑Rom and, with the rest of our leadership team, look forward to driving Hill‑Rom to new heights in the years ahead.
I hope you will visit www.hill-rom.com/2014 to learn more about all we accomplished in 2014: how Our Hill‑Rom Commitment translates our values into the practices that guide our work; stories from across the globe that illustrate our partnerships with our customers; more information on the newest part of the Hill‑Rom family, Trumpf Medical; and much more.
We at Hill‑Rom are fortunate to come to work every day with a sense of genuine purpose. From the line worker in our Monterrey, Mexico plant, to the account executive in Shanghai, to the quality engineer in Batesville, Indiana, to the sales support manager in Amsterdam, to the service technician in Tulsa, Oklahoma, to the human resources professional in Chicago, Illinois, and everywhere in between, it is our privilege – every day, around the world – to enhance outcomes for patients and their caregivers. We are proud of our accomplishments in 2014, and thank you for supporting our work in the years to come.
JOHN J. GREISCHP r e s i d e n t a n d C h i e f e x e C u t i v e O f f i C e r
Committed to Growth
Looking Ahead
$732
$448$275
Capital Expenditures
Acquisitions
Cash Returnsto Shareholders
FY 2011‑2014Total Capital Deployed: $1.455 Billion

UNITED STATES
SECURITIES AND EXCHANGE COMMISSION
WASHINGTON, D.C. 20549
FORM 10-K
(Mark One) Annual Report Pursuant to Section 13 or 15(d) of the Securities Exchange Act of 1934
For the fiscal year ended September 30, 2014 OR
Transition Report Pursuant to Section 13 or 15(d) of the Securities Exchange Act of 1934 For the transition period from ____ to ____
Commission File No. 1-6651
HILL-ROM HOLDINGS, INC.
(Exact name of registrant as specified in its charter)
Indiana 35-1160484 (State or other jurisdiction of incorporation or organization) (I.R.S. Employer Identification No.)
1069 State Route 46 East
Batesville, Indiana 47006-8835 (Address of principal executive offices) (Zip Code)
Registrant’s telephone number, including area code: (812) 934-7777
Securities registered pursuant to Section 12(b) of the Act:
Title of Each Class Name of Each Exchange on Which Registered Common Stock, without par value New York Stock Exchange
Securities registered pursuant to Section 12(g) of the Act: None
Indicate by check mark if the registrant is a well-known seasoned issuer, as defined in Rule 405 of the Securities Act.
Yes No
Indicate by check mark if the registrant is not required to file reports pursuant to Section 13 or 15(d) of the Securities Exchange Act of 1934.
Yes No
Indicate by check mark whether the registrant (1) has filed all reports required to be filed by Section 13 or 15(d) of the Securities Exchange Act of 1934 during the preceding 12 months (or for such shorter period that the registrant was required to file such reports), and (2) has been subject to such filing requirements for the past 90 days.
Yes No
Indicate by check mark whether the registrant has submitted electronically and posted on its corporate Website, if any, every Interactive Data File required to be submitted and posted pursuant to Rule 405 of Regulation S-T (§232.405 of this chapter) during the preceding 12 months (or for such shorter period that the registrant was required to submit and post such files).
Yes No
Indicate by check mark if disclosure of delinquent filers pursuant to Item 405 of Regulation S-K is not contained herein, and will not be contained, to the best of registrant’s knowledge, in definitive proxy or information statements incorporated by reference in Part III of this Form 10-K or any amendment to this Form 10-K.
Indicate by check mark whether the registrant is a large accelerated filer, an accelerated filer, a non-accelerated filer, or a smaller reporting company (as defined in Rule 12b-2 of the Exchange Act).
Large accelerated filer Accelerated filer Non-accelerated filer Smaller reporting company
Indicate by check mark whether the registrant is a shell company (as defined in Rule 12b-2 of the Exchange Act).
Yes No
The aggregate market value of the registrant’s voting common equity, held by non-affiliates of the registrant, was approximately $2.2 billion, based on the closing sales price of $38.54 per share as of March 31, 2014 (the last business day of the registrant’s most recently completed second fiscal quarter). There is no non-voting common equity held by non-affiliates.
The registrant had 57,518,884 shares of its common stock, without par value, outstanding as of November 12, 2014. Documents incorporated by reference.
Certain portions of the registrant’s definitive Proxy Statement to be delivered to shareholders in connection with the Annual Meeting of Shareholders to be held on March 4, 2015 are incorporated by reference into Part III of this Annual Report on Form 10-K.

2
HILL-ROM HOLDINGS, INC.
Annual Report on Form 10-K
For the Fiscal Year Ended September 30, 2014
TABLE OF CONTENTS Page PART I Disclosure Regarding Forward Looking Statements ................................................................................... 3Item 1. Business ....................................................................................................................................................... 3Item 1A. Risk Factors ................................................................................................................................................. 9Item 1B. Unresolved Staff Comments ........................................................................................................................ 13Item 2. Properties ..................................................................................................................................................... 14Item 3. Legal Proceedings ....................................................................................................................................... 15Item 4. Mine Safety Disclosures (not applicable) .................................................................................................... 15 PART II Item 5. Market for Registrant’s Common Equity, Related Stockholder Matters and Issuer Purchases of Equity
Securities ..................................................................................................................................................... 16Item 6. Selected Financial Data ............................................................................................................................... 18Item 7. Management’s Discussion and Analysis of Financial Condition and Results of Operations ...................... 19Item 7A. Quantitative and Qualitative Disclosures About Market Risk ..................................................................... 38Item 8. Financial Statements and Supplementary Data............................................................................................ 39Item 9. Changes in and Disagreements With Accountants on Accounting and Financial Disclosure ..................... 77Item 9A. Controls and Procedures .............................................................................................................................. 77Item 9B. Other Information ........................................................................................................................................ 77
PART III Item 10. Directors, Executive Officers and Corporate Governance ........................................................................... 78Item 11. Executive Compensation ............................................................................................................................. 78Item 12. Security Ownership of Certain Beneficial Owners and Management and Related Stockholder Matters .... 78Item 13. Certain Relationships and Related Transactions and Director Independence .............................................. 78Item 14. Principal Accounting Fees and Services ...................................................................................................... 78
PART IV Item 15. Exhibits and Financial Statement Schedules ............................................................................................... 79 SIGNATURES ............................................................................................................................................ 81

3
PART I
DISCLOSURE REGARDING FORWARD LOOKING STATEMENTS Certain statements in this Annual Report on Form 10-K contain forward-looking statements within the meanings of the Private Securities Litigation Reform Act of 1995 regarding our future plans, objectives, beliefs, expectations, representations and projections. Forward-looking statements are not guarantees of future performance, and our actual results could differ materially from those set forth in any forward-looking statements. Factors that could cause actual results to differ from forward-looking statements include but are not limited to the factors discussed under the heading “Risk Factors” in this Annual Report on Form 10-K. We assume no obligation to update or revise any forward-looking statements. Item 1. BUSINESS General Hill-Rom Holdings, Inc. (the “Company,” “Hill-Rom,” “we,” “us,” or “our”) was incorporated on August 7, 1969 in the State of Indiana and is headquartered in Batesville, Indiana. We are a leading global medical technology company with more than 7,000 employees worldwide. We partner with health care providers in more than 100 countries by focusing on patient care solutions that improve clinical and economic outcomes in five core areas: Advancing Mobility, Wound Care and Prevention, Clinical Workflow, Surgical Safety and Efficiency, and Respiratory Health. Around the world, Hill-Rom's people, products, and programs work towards one mission: Enhancing outcomes for patients and their caregivers. Segment Information We operate and manage our business within three reportable segments, each of which is generally aligned by region or product type. The segments are as follows:
North America - sells and rents our patient support and near-patient technologies and services, as well as our clinical workflow solutions, in the U.S. and Canada.
Surgical and Respiratory Care - sells and rents our surgical and respiratory care products globally.
International - sells and rents similar products as our North America segment in regions outside of the U.S. and
Canada. Net revenue, segment profitability and other measures of segment reporting for each reporting segment are set forth in Note 11 of Notes to Consolidated Financial Statements included under Part II, Item 8 of this Form 10-K. No single customer accounts for more than 10 percent of our revenue. Products and Services We have extensive distribution capabilities and broad reach across all health care settings. We sell and rent primarily to acute and extended care facilities worldwide through both a direct sales force and distributors, but we also sell products to patients in the home. Through our network of approximately 160 North American and 50 international service centers, and approximately 1,100 North American and 395 international service professionals, we are able to provide technical support and services and rapidly deliver our products to customers on an as-needed basis, providing our customers flexibility to purchase or rent our products. This extensive network is critical to serving our customers and securing contracts with Group Purchasing Organizations (“GPOs”) and integrated delivery networks (“IDNs”). Our products and services are outlined below. Except where noted, all of our business segments generally sell products and services and rent products from each of our product categories. Advancing Mobility. Our innovative patient care systems include a variety of bed systems, as well as mobility solutions (such as lifts and other devices used to safely move patients). These patient care systems can be designed for use in high, mid and low acuity settings, depending on the specific design options. Our advanced patient care systems can also provide patient data reporting; patient safety alarms and caregiver alerts concerning such things as bed exit, bed height, patient positioning; point of care controls; and patient turn assist and upright positioning. Supporting solutions within the patient/resident room

4
include architectural products (such as headwalls) and health care furniture. These products are sold by our North America and International segments, primarily to acute and extended care facilities worldwide. Approximately 67, 70 and 74 percent of our revenue during fiscal 2014, 2013 and 2012, were derived from advancing mobility products and services. Wound Care and Prevention. We rent and sell non-invasive therapeutic products and surfaces designed for the prevention and treatment of a variety of acute and chronic medical conditions, including pulmonary, wound and bariatric conditions. These products are rented and sold by our North America and International segments, primarily in the U.S., Canada and Europe. Medical Equipment Management and Contract Services provide rentals and health care provider asset management services for a wide variety of moveable medical equipment, also known as MME, such as ventilators, defibrillators, intravenous pumps and patient monitoring equipment in our North America segment. In addition, we also sell equipment service contracts for our capital equipment, primarily in the U.S. Approximately 10, 11 and 12 percent of our revenue during fiscal 2014, 2013 and 2012, were derived from wound care and prevention products and services. Clinical Workflow. We also develop and market a variety of communications technologies and software solutions. These are designed to improve patient safety and efficiency at the point of care by, among other things, enabling patient-to-staff and staff-to-staff communications, aggregating and delivering patient data, tracking staff and assets, and monitoring hand hygiene compliance. These products are sold mainly to our North America customers. Surgical Safety and Efficiency. We offer surgical tables, lights, and pendants utilized within the operating room setting. We also offer a range of positioning devices for use in shoulder, hip, spinal and lithotomy surgeries as well as platform-neutral positioning accessories for nearly every model of operating room table. In addition, we offer operating room disposable products such as scalpel and blade, light handle systems, skin markers and other disposable products. These products are sold by our Surgical and Respiratory Care segment. Approximately 13, 10 and 4 percent of our revenue during fiscal 2014, 2013 and 2012, were derived from surgical safety and efficiency products. Respiratory Health. We offer therapeutic products that provide bronchial hygiene (airway clearance) for acute and home care patients. These products are sold by our Surgical and Respiratory Care segment. Raw Materials Principal materials used in our products for each business segment include carbon steel, aluminum, stainless steel, wood and laminates, petroleum based products, such as foams and plastics, and other materials, substantially all of which are available from several sources. Motors and electronic controls for electrically operated beds and certain other components are purchased from one or more manufacturers. Prices fluctuate for raw materials and sub-assemblies used in our products based on a number of factors beyond our control. Specifically, over the past several years, the fluctuating prices of certain raw materials, including metals, fuel, plastics and other petroleum based products in particular, and fuel related delivery costs, had a direct effect on our profitability. Although we generally have not engaged in hedging transactions with respect to raw material purchases, we have entered into fixed price supply contracts at times. Most of our extended contracts with hospital GPOs and other customers for the sale of products in North America permit us to institute annual list price increases, although we may not be able to raise prices sufficiently to offset all raw material cost inflation.

5
Competition In all our business segments, we compete on the basis of clinical expertise and resulting product clinical utility and ability to produce favorable outcomes, as well as value, quality, customer service, innovation and breadth and depth of product offerings. As our business segments generally sell products and services across our product categories, we evaluate our competition based on our product categories, rather than our business segments. The following table displays our significant competitors with respect to each product category: Product Categories CompetitorsAdvancing Mobility ............................................................ ArjoHuntleigh (Division of Getinge AB)
Guldmann Invacare Joerns Healthcare Linet Stiegelmeyer Stryker Corporation
Wound Care and Prevention ............................................... ArjoHuntleigh (Division of Getinge AB)
Freedom Medical, Inc. RecoverCare, LLC/Joerns Healthcare SIZEWise Rentals, LLC Universal Hospital Services, Inc.
Clinical Workflow .............................................................. Ascom Holding
GE Healthcare Rauland-Borg Corporation
Surgical Safety and Efficiency ........................................... Action Medical
DeRoyal Maquet (Divison of Getinge AB) MizuhoOSI Schuremed Skytron Steris Stryker Corporation Swann-Morton
Respiratory Health .............................................................. Electromed, Inc.
International Biophysics Corporation Respironics (Division of Philips) Respirtech
Additionally, we compete with a large number of smaller and regional manufacturers.
6
Regulatory Matters FDA Regulation. We design, manufacture, install and distribute medical devices that are regulated by the Food and Drug Administration (“FDA”) in the U.S. and similar agencies in other countries. The regulations and standards of these agencies evolve over time and require us to make changes in our manufacturing processes and quality systems to remain in compliance. The FDA’s Quality System regulations and the regulatory equivalents under the Medical Device Directive in the European Union set forth standards for our product design and manufacturing processes, require the maintenance of certain records and provide for inspections of our facilities. From time to time, the FDA performs routine inspections of our facilities and may inform us of certain deficiencies in our processes or facilities. We currently have an outstanding FDA warning letter for our Batesville facility that was received in 2012. See Item 1A. “Risk Factors” for additional information. In addition, there are also certain state and local government requirements that must be complied with in the manufacturing and marketing of our products. Environmental. We are subject to a variety of federal, state, local and foreign environmental laws and regulations relating to environmental and health and safety concerns, including the handling, storage, discharge and disposal of hazardous materials used in or derived from our manufacturing processes. When necessary, we provide for reserves in our financial statements for environmental matters. We do not expect the remediation costs for any environmental issues in which we are currently involved to exceed $3 million. Health Care Regulations. In March 2010, comprehensive health care reform legislation was signed into law through the passage of the Patient Protection and Affordable Health Care Act and the Health Care and Education Reconciliation Act. The health care industry continues to undergo significant change as the law is implemented. In addition to health care reform, Medicare, Medicaid and managed care organizations, such as health maintenance organizations and preferred provider organizations, traditional indemnity insurers and third-party administrators are under increasing pressure to control costs and limit utilization, while improving quality and health care outcomes. These objectives are being advanced through a variety of reform initiatives including: accountable care organizations, value based purchasing, bundling initiatives, competitive bidding programs, etc. We are also subject to a number of other regulations related to the sale and distribution of health care products. The potential impact of these regulations to our business is discussed further in Item 1A. Risk Factors and Part II, Item 7-Management’s Discussion and Analysis of Financial Condition and Results of Operations, included in this Annual Report on Form 10-K. Product Development Most of our products and product improvements have been developed internally. We maintain close working relationships with various medical professionals who assist in product research and development. New and improved products play a critical role in our sales growth. We continue to place emphasis on the development of proprietary products and product improvements to complement and expand our existing product lines. Our significant research and development activities are located in Acton, Massachusetts; Batesville, Indiana; Cary, North Carolina; Lulea, Sweden; Montpelier and Pluvigner, France; Singapore; and Saalfeld and Witten, Germany. Research and development is expensed as incurred. Research and development expense for the fiscal years ended September 30, 2014, 2013 and 2012, was $71.9 million, $70.2 million and $66.9 million. In addition, certain software development technology costs are capitalized as intangibles and are amortized over a period of three to five years once the software is ready for its intended use. The amounts capitalized during fiscal years 2014, 2013 and 2012 were approximately $2.6 million, $2.4 million and $2.3 million. Patents and Trademarks We own, and from time-to-time license, a number of patents on our products and manufacturing processes, but we do not believe any single patent or related group of patents is of material significance to any business segment or our business as a whole. We also own a number of trademarks and service marks relating to our products and product services. Except for the marks “Hill-Rom®” and “Bard-Parker®” we do not believe any single trademark or service mark is of material significance to any business segment or our business as a whole. Foreign Operations and Export Sales Information about our foreign operations is set forth in tables relating to geographic information in Note 11 of Notes to Consolidated Financial Statements, included herein under Part II, Item 8 of this Form 10-K.

7
Employees At September 30, 2014, we had approximately 7,325 employees worldwide. Approximately 230 of our employees work in our logistics and manufacturing operations in the U.S. under collective bargaining agreements. We are also subject to various collective bargaining arrangements or national agreements outside the U.S. The collective bargaining agreement at our primary U.S. manufacturing facility expires in January 2016. We have not experienced a work stoppage in the U.S. in over 40 years, and we believe that our employee relations are satisfactory. Executive Officers The following sets forth certain information regarding our executive officers. The term of office for each executive officer expires on the date his or her successor is chosen and qualified. No director or executive officer has a “family relationship” with any other director or executive officer of the Company, as that term is defined for purposes of this disclosure requirement. There is no understanding between any executive officer and any other person pursuant to which the executive officer was selected. John J. Greisch, 59, was elected President and Chief Executive Officer of Hill-Rom in January 2010. Mr. Greisch was most recently President, International Operations for Baxter International, Inc., a position he held since 2006. Prior to this, he held several other positions with Baxter, serving as Baxter's Chief Financial Officer and as President of Baxter's BioScience division. Carlyn D. Solomon, 52, entered into an employment agreement on October 3, 2014 to become Chief Operating Officer of Hill-Rom effective November 17, 2014. Mr. Solomon was most recently the Corporate Vice President, Critical Care & Vascular Business Units of Edwards Lifesciences since 2006, and was VP of Corporate Strategy and GM of Cardiac Surgery Systems Business of Edwards Lifesciences from 2005 to 2006. Michael S. Macek, 42, was elected as Interim Chief Financial Officer in July 2014 and elected Treasurer in March 2011. Mr. Macek previously served as Interim Chief Financial Officer for Hill-Rom from July 2013 to December 2013. He held the position of Executive Director, Treasury for Hill-Rom since 2008, and a series of financial positions with Hill-Rom since 2005. Steven J. Strobel, 56, was elected Senior Vice President in November 2014 and will assume the position of Chief Financial Officer on December 1, 2014. Before joining Hill-Rom, Mr. Strobel was Chief Financial Officer of BlueStar Energy, an independent retail energy services company from 2009 to 2012. Prior to BlueStar, he served as Treasurer and Corporate Controller at Motorola, and in the same positions at Owens Corning. Most recently, Mr. Strobel was President of McGough Road Advisors, a corporate finance consulting firm, from 2012 to present. Mr. Strobel serves on the Board of Directors of Newell Rubbermaid Inc., where he chairs the Audit Committee. Michiel de Zwaan, 43, was elected Senior Vice President and Chief Human Resources Officer of Hill-Rom in August 2014. Mr. de Zwaan held the position of Vice President Human Resources International for Hill-Rom since 2011. Prior to joining Hill-Rom, he served as Regional Head, Human Resources for the Asia-Pacific Pharmaceutical Division of Roche since 2009. Prior to this, he held other HR roles within companies such as Hilton, Levi Strauss, Mattel and Maersk. Andreas Frank, 38, was elected as Senior Vice President Corporate Development and Strategy in October 2011. Before joining Hill-Rom, Mr. Frank was Director Corporate Development at Danaher Corporation. Previously he worked in the Corporate Finance and Strategy practice at the consulting firm McKinsey & Company. Alejandro Infante Saracho, 53, prior to his resignation effective December 31, 2014, was elected Senior Vice President and President International for Hill-Rom effective May 2010. Before joining the Company, he spent more than 25 years with Hospira and Abbott serving in a number of executive positions, including President of the Americas, General Manager International Operations and Regional Director Latin America for Hospira. Richard G. Keller, 53, was elected Vice President, Controller and Chief Accounting Officer of the Company effective August 2005. He had served as Executive Director - Controller of Hill-Rom since March 2004. Susan R. Lichtenstein, 57, was elected Senior Vice President, Corporate Affairs, Chief Legal Officer and Secretary for Hill-Rom effective May 2010. Previously she was Corporate Vice President and General Counsel at Baxter International, where she was responsible for global legal matters, corporate communications and government affairs.

8
Alton Shader, 41, was elected Senior Vice President and President North America in July 2012. He had served as Senior Vice President and President, Post-Acute Care with Hill-Rom since July 2011. Before joining Hill-Rom, Mr. Shader was General Manager of Renal at Baxter International. Previously, he served as General Manager for Baxter Ireland and held senior marketing positions in Baxter's operations in Zurich and in California. Taylor Smith, 54, was elected as Senior Vice President and President, Surgical and Respiratory Care in November 2013. Before joining Hill-Rom, Mr. Smith served as Senior Vice President and General Manager for Cardinal Health’s Orthopedic Products and Services group. Previously he held numerous leadership positions of increasing responsibility at Cardinal Health over the past 13 years. Availability of Reports and Other Information Our website is www.Hill-Rom.com. We make available on this website, free of charge, access to our annual, quarterly and current reports and other documents we file with, or furnish to, the Securities and Exchange Commission (“SEC”) as soon as practicable after such reports or documents are filed or furnished. We also make available on our website position specifications for the Chairman, members of the Board of Directors and the Chief Executive Officer, our Code of Ethical Business Conduct (and any amendments or waivers), the Corporate Governance Standards of our Board of Directors and the charters of each of the standing committees of the Board of Directors. All of these documents are also available to shareholders in print upon request. All reports filed with the SEC are also available via the SEC website, www.sec.gov, or may be read and copied at the SEC Public Reference Room at 100 F Street, NE, Washington, DC 20549. Information on the operation of the Public Reference Room may be obtained by calling the SEC at 1-800-SEC-0330.

9
Item 1A. RISK FACTORS Our business involves risks. The following information about these risks should be considered carefully together with the other information contained herein. The risks described below are not the only risks we face. Additional risks not currently known or deemed immaterial also may result in adverse effects on our business. We face significant uncertainty in the industry due to government health care reform, changes in Medicare, Medicaid and other governmental medical program reimbursements, and we cannot predict how these reforms will impact our operating results. In March 2010, the U.S. Congress adopted and President Obama signed into law comprehensive health care reform legislation through the passage of the Patient Protection and Affordable Health Care Act (H.R. 3590) and the Health Care and Education Reconciliation Act (H.R. 4872). Many portions of this legislation are in the process of implementation, or being challenged in court. We cannot predict with certainty what healthcare initiatives, if any, will be implemented at the federal or state level, or what the ultimate effect of federal health care reform or any future legislation or regulation will have on us. In addition, Medicare, Medicaid, managed care organizations and foreign governments are increasing pressure to both control health care utilization and to limit reimbursement. Changes in reimbursement programs or their regulations, including retroactive and prospective rate and coverage criteria changes, competitive bidding for certain products and services, and other changes intended to reduce expenditures (domestically or internationally), could adversely affect the portions of our businesses that are dependent on third-party reimbursement or direct governmental payments. Moreover, to the extent that our customers experience reimbursement pressure resulting in lower revenue for them, their demand for our products and services may decrease. The impact of the above mentioned items could have a material adverse impact on our business, results of operations and cash flows. Failure by us or our suppliers to comply with the FDA regulations and similar foreign regulations applicable to the products we manufacture or distribute could expose us to enforcement actions or other adverse consequences. We design, manufacture, install and distribute medical devices that are regulated by the FDA in the U.S. and similar agencies in other countries. Failure to comply with applicable regulations could result in future product recalls, injunctions preventing the shipment of products or other enforcement actions that could have a material adverse effect on our revenue and profitability. On March 6, 2012, we received a warning letter from the FDA following an inspection by the FDA at our Batesville, Indiana production facilities. At the close of the inspection, the FDA issued a Form 483 identifying certain observed instances of non-compliance with FDA regulations. The warning letter reiterated the items raised in the Form 483 and also identified certain instances of non-compliance with FDA requirements regarding our advertising and promotion of certain products. Although remediation efforts are completed and we had a successful third party audit verifying our corrections, we cannot assure you if or when we will address all matters in the warning letter to the FDA’s satisfaction. Additionally, certain of our suppliers are subject to FDA regulations, and the failure of these suppliers to comply with regulations could adversely affect us; as regulatory actions taken by the FDA against those manufacturers can result in product shortages, recalls or modifications. We could be subject to substantial fines or damages and possible exclusion from participation in federal health care programs if we fail to comply with the laws and regulations applicable to our business. We are subject to stringent laws and regulations at both the federal and state levels governing the participation of durable medical equipment suppliers in federal and state health care programs. In addition, in 2011 we entered into a five-year Corporate Integrity Agreement with the U.S. Federal government, which imposes on us additional contractual obligations. From time to time, the government seeks additional information related to our claims submissions, and in some instances government contractors perform audits of payments made to us under Medicare, Medicaid, and other federal health care programs. On occasion, these reviews identify overpayments for which we submit refunds. At other times, our own internal audits identify the need to refund payments. The frequency and intensity of government audits and review processes has intensified and we expect this will continue in the future, due to increased resources allocated to these activities at both the federal and state Medicaid level, and greater sophistication in data review techniques. If we are deemed to have violated these laws and regulations, or are found to have violated our Corporate Integrity Agreement, we could be subject to substantial fines, damages, possible exclusion from participation in federal health care programs such as Medicare and Medicaid and possible recoupment of overpayments. While we believe that our practices materially comply with applicable state and federal requirements, the requirements may be interpreted in a manner inconsistent with our interpretation. Failure to comply with applicable laws and regulations, even if inadvertent, could have a material adverse impact on our business.

10
We participate in a highly competitive industry that is subject to the risk of declining demand and pricing pressures, which could adversely affect our operating results. Demand for our products and services depend in large part on overall demand in the health care market. Additionally, with the health care market’s increased focus on hospital asset and resource efficiency as well as reimbursement constraints, capital spending for many of our products is on a long-term declining trend. Further, the competitive pressures in our industry could cause us to lose market share unless we increase our expenditures or reduce our prices, which would adversely impact our operating results. The nature of this highly competitive marketplace demands that we successfully introduce new products into the market in a cost effective manner (more fully detailed below). These factors, along with others, may result in significant shifts in market share among the industry's major participants, including us. Accordingly, if we are unable to effectively differentiate ourselves from our competitors in terms of both new products and diversification of our product portfolio through business acquisitions, then our market share, sales and profitability could be adversely impacted through lower volume or decreased prices. Our future financial performance will depend in part on the successful introduction of new products into the marketplace on a cost-effective basis. Our future financial performance will depend in part on our ability to influence, anticipate, identify and respond to changing consumer preferences and needs. We can provide no assurances that our new products will achieve the same degree of success as in the past. We may not correctly anticipate or identify trends in consumer preferences or needs, or may identify them later than competitors do. In addition, difficulties in manufacturing or in obtaining regulatory approvals may delay or prohibit introduction of new products into the marketplace. Further, we may not be able to develop and produce new products at a cost that allows us to meet our goals for profitability. Warranty claims and service costs relating to our products may be greater than anticipated, and we may be required to devote significant resources to address any quality issues associated with our new products, which could reduce the resources available for further new product development and other matters. In addition, the introduction of new products may also cause customers to defer purchases of existing products. Failure to successfully introduce new products on a cost-effective basis, or delays in customer purchasing decisions related to the evaluation of new products, could cause us to lose market share and could materially adversely affect our business, financial condition, results of operations and cash flow. Further adverse developments in general domestic and worldwide economic conditions and instability and disruption of credit markets could have further adverse effects on our operating results, financial condition, or liquidity. We are subject to risks arising from adverse changes in general domestic and global economic conditions, including recession or economic slowdown and disruption of domestic and international credit markets. The credit and capital markets experienced extreme volatility and disruption over the past several years, leading to periods of recessionary conditions and depressed levels of consumer and commercial spending. These recessionary conditions caused customers to reduce, modify, delay or cancel plans to purchase our products and services. If our customers continue to reduce investments in capital expenditures or utilize their limited capital funds to invest in products that we do not offer or that do not comprise a large percentage of our product portfolio, it could negatively impact our operating results. Moreover, even if our revenue remains constant, our profitability could decline if there is a shift to sales of product mix or geographic locations with less favorable margins. If worldwide economic conditions worsen, we would expect our customers to scrutinize costs resulting from pressures on operating margin due to rising supply costs, reduced investment income and philanthropic giving, increased interest expense, reimbursement pressure, reduced elective healthcare spending and uncompensated care. We may not be able to grow if we are unable to successfully acquire and integrate, or form business relationships with, other companies. We have in the past, and expect in the future, to grow our business through mergers, acquisitions and other similar business arrangements. We may not be able to identify suitable acquisition candidates or business relationships, negotiate acceptable terms for such acquisitions or relationships or receive necessary financing on acceptable terms. Additionally, we may become responsible for liabilities associated with businesses that we acquire to the extent they are not covered by indemnification from the sellers or by insurance. Even if we are able to consummate acquisitions, such acquisitions could be dilutive to earnings, and we could overpay for such acquisitions. Additionally, we may not be fully successful in our integration efforts or fully realize expected benefits from the integration. Our integration efforts may divert management and other resources from other important matters, and we could experience delays or unusual expenses in the integration process, including intangible asset impairments which could result in significant charges in our Statements of Consolidated Income. Moreover, the margins for these companies may differ from our historical gross and operating margins resulting in a material adverse effect on our results of operations.

11
The assets in our pension plans are subject to market disruptions. In addition our pension plans are underfunded. Our primary pension plan invests in a variety of equity and debt securities subject to market risks. Our pension plans were underfunded at September 30, 2014 by approximately $67.7 million. Market volatility and disruption could cause further declines in asset values or fluctuations in assumptions used to value our liability and expenses. If this occurs, we may need to make additional pension plan contributions and our pension expense in future years may increase. Our business is significantly dependent on major contracts with GPOs, IDNs, and certain other purchasers. A majority of our North American hospital sales and rentals are made pursuant to contracts with hospital GPOs. At any given time, we are typically at various stages of responding to bids and negotiating and renewing expiring GPO agreements. Failure to be included in certain of these agreements could have a material adverse effect on our business, including capital and rental revenue. Participation by us in such programs often requires increased discounting or restrictions on our ability to raise prices, and failure to participate or to be selected for participation in such programs may result in a reduction of sales to the member hospitals. In addition, the industry is showing an increased focus on contracting directly with health systems or IDNs (which typically represents influential members and owners of GPOs). IDNs and health systems often make key purchasing decisions and have influence over the GPO’s contract decisions, and often request additional discounts or other enhancements. In addition, certain other purchasers have similar processes to the GPOs and IDNs and failure to be included in agreements with these other purchasers could have a material adverse effect on our business. Increased prices for, or unavailability of, raw materials or sub-assemblies used in our products could adversely affect profitability or revenue. In particular, our results of operations have been and could be further adversely affected by high prices for metals, fuel, plastics and other petroleum based products. We also procure several raw materials and sub-assemblies from single suppliers. Our profitability is affected by the prices of the raw materials and sub-assemblies used in the manufacture of our products. These prices may fluctuate based on a number of factors beyond our control, including changes in supply and demand, general economic conditions, labor costs, fuel related delivery costs, competition, import duties, tariffs, currency exchange rates, and government regulation. Significant increases in the prices of raw materials or sub-assemblies that cannot be recovered through increases in the prices of our products could adversely affect our results of operations. There can be no assurance that the marketplace will support higher prices or that such prices and productivity gains will fully offset any commodity price increases in the future. We generally have not engaged in hedging transactions with respect to raw material purchases, but do enter into fixed price supply contracts at times. Future decisions not to engage in hedging transactions or ineffective hedging transactions may result in increased price volatility, potentially adversely impacting our profitability. Our dependency upon regular deliveries of supplies from particular suppliers means that interruptions or stoppages in such deliveries could adversely affect our operations until arrangements with alternate suppliers could be made. Several of the raw materials and sub-assemblies used in the manufacture of our products currently are procured only from a single source. If any of these sole-source suppliers were unable or unwilling to deliver these materials for an extended period of time we may not be able to manufacture one or more products for a period of time, and our business could suffer. We may not be able to find acceptable alternatives, and any such alternatives could result in increased costs. Difficulties in the credit markets could adversely affect our suppliers’ access to capital and therefore their ability to continue to provide an adequate supply of the materials we use in our products. The majority of our products are manufactured at a single facility or location, and the loss of one or more of these facilities or locations could prevent us from manufacturing all the various products we sell. We manufacture the majority of our products in only a single facility or location. If an event occurred that resulted in material damage to one or more of these manufacturing facilities or we lacked sufficient labor to fully operate the facility, we may be unable to transfer the manufacture of the relevant products to another facility or location in a cost-effective or timely manner, if at all. This potential inability to transfer production could occur for a number of reasons, including but not limited to a lack of necessary relevant manufacturing capability at another facility, or the regulatory requirements of the FDA or other governmental regulatory bodies. Such an event would materially negatively impact our financial condition, results of operations and cash flows.

12
Our international sales and operations are subject to risks and uncertainties that vary by country which could have a material adverse effect on our business and/or results of operations. International sales accounted for approximately 36 percent of our net sales in fiscal 2014. We anticipate that international sales will continue to represent a significant portion of our total sales in the future. In addition, we have multiple manufacturing facilities and third-party suppliers that are located outside of the U.S. As a result, our international sales, as well as our sales in the U.S. of products produced or sourced internationally, are subject to risks and uncertainties that can vary by country, such as political instability, economic conditions, foreign currency exchange rate fluctuations, changes in tax laws, regulatory and reimbursement programs and policies, and the protection of intellectual property rights. In addition, our collections of international receivables are subject to economic pressures and the actions of some governmental authorities who have initiated various austerity measures to control healthcare and other governmental spending. Unfavorable outcomes related to uncertain tax positions could result in significant tax liabilities. We have recorded tax benefits related to various uncertain tax positions taken or expected to be taken in a tax return. While we believe our positions are appropriate, the Internal Revenue Service (“IRS”), state or foreign tax authorities could disagree with our positions, resulting in a significant tax payment. We are involved on an ongoing basis in claims, lawsuits and governmental proceedings relating to our operations, as well as product liability or other liability claims that could expose us to adverse judgments or could affect the sales of our products. We are involved in the design, manufacture and sale of health care products, which face an inherent risk of exposure to product liability claims if our products are alleged to have caused injury or are found to be unsuitable for their intended use. Amongst other claims, we are, from time to time, a party to claims and lawsuits alleging that our products have caused injury or death or are otherwise unsuitable. It is possible that we will receive adverse judgments in such lawsuits, and any such adverse judgments could be material. Although we do carry insurance with respect to such matters, this insurance is subject to varying deductibles and self-insured retentions and may not be adequate to cover the full amount of any particular claim. In addition, any such claims could negatively impact the sales of products that are the subject of such claims or other products. We may not be able to attract, retain and develop key personnel. Our future performance depends in significant part upon the continued service of our executive officers and other key personnel. The loss of the services of one or more of our executive officers or other key employees could have a material adverse effect on our business, prospects, financial condition and results of operations. Our success also depends on our continuing ability to attract, retain and develop highly qualified personnel, and as competition for such personnel is intense, there can be no assurance that we can do so in the future. A portion of our workforce is unionized, and we could face labor disruptions that would interfere with our operations. Approximately 3 percent of our employees as part of our logistics and manufacturing operations in the U.S. work under collective bargaining agreements. We are also subject to various collective bargaining arrangements or national agreements outside the U.S. covering approximately 18 percent of our employees. Although we have not recently experienced any significant work stoppages as a result of labor disagreements, we cannot ensure that such a stoppage will not occur in the future. Inability to negotiate satisfactory new agreements or a labor disturbance at one of our principal facilities could have a material adverse effect on our operations. We may be adversely affected by new regulations relating to conflict minerals. In August 2012, the SEC adopted new disclosures and reporting requirements for companies whose products contain certain minerals and their derivatives, namely tin, tantalum, tungsten or gold, known as conflict minerals. As of May 2014, companies are required to report annually whether or not such minerals originate from the Democratic Republic of the Congo (DRC) and/or adjoining countries and in some cases to perform extensive due diligence on their supply chains for such minerals. The implementation of these new requirements could adversely affect the sourcing, availability and pricing of materials used in the manufacturing of our products. In addition, we will incur additional costs to comply with the disclosure requirements, including cost related to determining the source of any of the relevant minerals used in our products. Since our supply chain is complex and multilayered, we may be unable to ascertain with sufficient certainty the origins for these minerals or make a determination that that these minerals are DRC conflict free despite our due diligence procedures, which

13
in turn may harm our reputation. We may also face difficulties in satisfying customers who may require that our products be certified as DRC conflict free, which could harm our relationships with these customers and/or lead to a loss of revenue. These requirements also could have the effect of limiting the pool of suppliers from which we source these minerals, and we may be unable to obtain conflict-free minerals at prices similar to the past, which could increase our costs and adversely affect our manufacturing operations and our profitability. We may not be successful in achieving expected operating efficiencies and sustaining or improving operating expense reductions, and may experience business disruptions and adverse tax consequences associated with restructuring, realignment and cost reduction activities. Over the past few years we have initiated several restructuring, realignment and cost reduction initiatives. In the second quarter of fiscal 2014 we initiated a restructuring program to improve our cost structure by reducing our European manufacturing capacity and streamlining our global operations by, among other things, executing a back office process transformation program in Europe. While we expect to realize efficiencies from these actions, these activities may not produce the full efficiency and cost reduction benefits we expect. Further, such benefits may be realized later than expected, and the ongoing costs of implementing these measures may be greater than anticipated. If these measures are not successful or sustainable, we may undertake additional realignment and cost reduction efforts, which could result in future charges. Moreover, our ability to achieve our other strategic goals and business plans may be adversely affected and we could experience business disruptions with customers and elsewhere if our restructuring and realignment efforts prove ineffective. These actions, the resulting costs, and delays or lower than anticipated benefits will also impact our foreign tax positions and may require us to record tax reserves against certain deferred tax assets in our international business, similar to the provision we recognized during the second quarter of fiscal 2014 with respect to France. We are increasingly dependent on consistent functioning of our information technology systems and if we are exposed to any intrusions or if we fail to maintain the integrity of our data, our business could be materially affected. We are increasingly dependent on consistent functioning of our information technology systems for our infrastructure and products. Our information systems require an ongoing commitment of significant resources to maintain, protect, and enhance existing systems and develop new systems to keep pace with continuing changes in information processing technology, evolving systems and regulatory standards, integration of acquisitions, and the increasing need to protect patient and customer information. In addition, third parties may attempt to hack into our products or systems and may obtain proprietary information. If we fail to maintain or protect our information systems and data integrity effectively, we could lose existing customers or suppliers, have difficulty attracting new customers or suppliers, have problems that adversely impact internal controls, have difficulty preventing, detecting, and controlling fraud, have disputes with customers and suppliers, have regulatory sanctions or penalties imposed, have increases in operating expenses, incur expenses or lose revenues as a result of a data privacy breach, or suffer other adverse consequences. Any significant breakdown, intrusion, interruption, corruption, or destruction of these systems, as well as any data breaches, could have a material adverse effect on our business. Item 1B. UNRESOLVED STAFF COMMENTS We have not received any comments from the staff of the SEC regarding our periodic or current reports that remain unresolved.

14
Item 2. PROPERTIES The principal properties used in our operations are listed below, and, except for our leased facilities in Acton, Massachusetts; Caledonia, Michigan; Cary, North Carolina; Charleston, South Carolina; Chicago, Illinois; St. Paul, Minnesota; Singapore; Redditch, UK; and Taicang, China, are owned by us subject to no material encumbrances. All facilities are suitable for their intended purpose, are being efficiently utilized and are believed to provide adequate capacity to meet demand for the next several years. Location Description and Primary Use
Acton, MA ........................... Light manufacturing, development and distribution of health care equipment Office administration
Batesville, IN ....................... Manufacturing, development and distribution of health care equipment Office administration
Caledonia, MI ...................... Manufacturing, development and distribution of surgical products Office administration
Cary, NC .............................. Development of health care equipment Office administration
Charleston, SC ..................... Light manufacturing and distribution of health care equipment Office administration
Chicago, IL .......................... Office administration
St. Paul, MN ........................ Office administration
Montpellier, France ............. Manufacturing and development of health care equipment
Pluvigner, France ................. Manufacturing, development and distribution of health care equipment Office administration
Hainichen, Germany ............ Manufacturing and distribution of health care equipment
Puchheim, Germany ............ Manufacturing and distribution of health care equipment
Saalfeld, Germany ............... Manufacturing, development and distribution of health care equipment Office administration
Witten, Germany ................. Manufacturing, development and distribution of health care equipment Office administration
Monterrey, Mexico .............. Manufacturing of health care equipment
Las Piedras, Puerto Rico ...... Manufacturing of surgical products
Singapore ............................. Manufacturing and development of health care equipment Office administration
Lulea, Sweden ..................... Manufacturing, development and distribution of health care equipment Office administration
Redditch, UK ....................... Manufacturing and distribution of surgical products Office administration
Taicang, China ..................... Light manufacturing and distribution of health care equipment In addition to the foregoing, we lease or own a number of other facilities, warehouse distribution centers, service centers and sales offices throughout the U.S., Canada, Western Europe, Mexico, Australia, Middle East, the Far East, and Latin America.

15
Item 3. LEGAL PROCEEDINGS See Note 13 of Notes to Consolidated Financial Statements included under Part II, Item 8 of this Form 10-K for information regarding legal proceedings in which we are involved. Item 4. MINE SAFETY DISCLOSURES Not applicable.

16
PART II Item 5. MARKET FOR REGISTRANT’S COMMON EQUITY, RELATED STOCKHOLDER MATTERS AND
ISSUER PURCHASES OF EQUITY SECURITIES Market Information Our common stock is traded on the New York Stock Exchange under the ticker symbol “HRC”. The closing price of our common stock on the New York Stock Exchange on November 12, 2014 was $45.24 per share. The following table reflects the range of high and low selling prices of our common stock and cash dividends declared by quarter for each of the last two fiscal years. Years Ended September 30 2014 2013
Quarter Ended: High Low
Cash Dividends Declared High Low
Cash Dividends Declared
December 31 ................................. $ 42.56 $ 35.64 $ 0.1375 $ 30.56 $ 26.40 $ 0.1250 March 31 ....................................... $ 44.64 $ 34.94 $ 0.1525 $ 35.22 $ 29.60 $ 0.1250 June 30 .......................................... $ 41.66 $ 35.45 $ 0.1525 $ 37.15 $ 32.90 $ 0.1375 September 30 ................................ $ 44.46 $ 38.85 $ 0.1525 $ 37.62 $ 33.23 $ 0.1375 Holders As of November 12, 2014, there were approximately 19,000 shareholders of record. Dividends The declaration and payment of cash dividends is at the sole discretion of our Board of Directors (“Board”) and depends upon many factors, including our financial condition, earnings potential, capital requirements, alternative uses of cash, covenants associated with debt obligations, legal requirements and other factors deemed relevant by our Board. We have paid cash dividends on our common stock every quarter since our initial public offering in 1971. We intend to continue to pay quarterly cash dividends comparable to those paid in the periods covered by these financial statements. Issuer Purchases of Equity Securities Maximum Total Number Approximate of Shares Dollar Value Total Purchased as of Shares That Number Average Part of Publicly May Yet Be of Shares Price Paid Announced Plans or Purchased Under Period Purchased (1) per Share Programs (2) the Programs (2) July 1, 2014 - July 31, 2014 ................................................ 2,763 $ 41.00 - $ 119.5 August 1, 2014 - August 31, 2014 ...................................... - $ - - $ 119.5 September 1, 2014 - September 30, 2014 ........................... 562 $ 43.17 - $ 119.5 Total .................................................................................... 3,325 $ 41.37 - $ 119.5
(1) Shares purchased during the quarter ended September 30, 2014 were in connection with employee payroll tax
withholding for restricted and deferred stock distributions. (2) In September 2013, the Board approved an expansion of its previously announced share repurchase authorization to a
total of $190.0 million. As of September 30, 2014, a cumulative total of $70.5 million has been used under this existing authorization. The plan does not have an expiration date and currently there are no plans to terminate this program in the future.

17
Stock Performance Graph The following graph compares the return on our common stock with that of Standard & Poor’s 500 Stock Index (“S&P 500 Index”), and our Peer Group* for the five years ended September 30, 2014. The graph assumes that the value of the investment in our common stock, the S&P 500 Index, and our Peer Group was $100 on October 1, 2009 and that all dividends were reinvested.
2009 2010 2011 2012 2013 2014HRC ............... $100 $175 $148 $146 $182 $213 S & P 500 ....... $100 $111 $110 $140 $163 $192 Peer Group ..... $100 $118 $118 $149 $161 $193 * For purposes of the Stock Performance Graph above, our Peer Group is comprised of: Alere Inc.; C.R. Bard, Inc.;
CareFusion Corp.; Chemed Corp.; Conmed Corporation; Dentsply International Inc.; Edwards Lifesciences Corporation; Hologic, Inc.; Hospira, Inc.; IDEXX Laboratories, Inc.; Integra Lifesciences Holdings Corporation; Intuitive Surgical, Inc.; Invacare Corporation; Mednax, Inc.; PerkinElmer, Inc.; ResMed Inc.; Sirona Dental Systems Labs, Inc.; Steris Corporation; Teleflex, Inc.; The Cooper Companies, Inc.; Varian Medical Systems, Inc.; West Pharmaceutical Services, Inc.; and Zimmer Holdings, Inc.
Certain other information required by this item will be contained under the caption “Equity Compensation Plan Information” in our definitive Proxy Statement to be delivered to shareholders in connection with the Annual Meeting of Shareholders to be held on March 4, 2015, and such information is incorporated herein by reference.

18
Item 6. SELECTED FINANCIAL DATA The following table presents our selected consolidated financial data for each of the last five fiscal years ended September 30. Refer to Note 2 of Notes to Consolidated Financial Statements included under Part II, Item 8 of this Form 10-K for disclosure of business combinations for each of the last three fiscal years. Also see Note 12 of Notes to Consolidated Financial Statements included under Part II, Item 8 of this Form 10-K for selected unaudited quarterly financial information for each of the last two fiscal years. 2014 2013 2012 2011 2010 Net revenue ............................................................ $ 1,686.1 $ 1,716.2 $ 1,634.3 $ 1,591.7 $ 1,469.6 Net income ............................................................. $ 60.6 $ 105.0 $ 120.8 $ 133.5 $ 126.0 Net income attributable to common shareholders .. $ 60.6 $ 105.0 $ 120.8 $ 133.3 $ 125.3 Net income attributable to common shareholders
per share - Basic .................................................. $ 1.05 $ 1.75 $ 1.94 $ 2.11 $ 1.99 Net income attributable to common shareholders
per share - Diluted ............................................... $ 1.04 $ 1.74 $ 1.94 $ 2.09 $ 1.97 Total assets ............................................................ $ 1,752.1 $ 1,586.8 $ 1,627.6 $ 1,299.1 $ 1,245.6 Long-term obligations ........................................... $ 364.9 $ 225.8 $ 237.5 $ 50.8 $ 98.5 Cash flows from operating activities ..................... $ 210.3 $ 263.2 $ 261.7 $ 222.5 $ 139.8 Capital expenditures .............................................. $ 62.7 $ 65.3 $ 77.8 $ 68.9 $ 64.7 Cash dividends per share ....................................... $ 0.5950 $ 0.5250 $ 0.4875 $ 0.4300 $ 0.4100

19
Item 7. MANAGEMENT'S DISCUSSION AND ANALYSIS OF FINANCIAL CONDITION AND RESULTS OF OPERATIONS
Overview We are a leading global medical technology company with more than 7,000 employees worldwide. We partner with health care providers in more than 100 countries by focusing on patient care solutions that improve clinical and economic outcomes in five core areas: Advancing Mobility, Wound Care and Prevention, Clinical Workflow, Surgical Safety and Efficiency, and Respiratory Health. Around the world, Hill-Rom's people, products, and programs work towards one mission: Enhancing outcomes for patients and their caregivers. Key Factors Impacting Our Business Industry-wide Demand and Cost Pressures. We believe that over the long term, overall patient and provider demand for health care products and services will continue to grow as a result of a number of factors, including an aging population, longer life expectancies, and an increasing number of sicker patients across all care settings, including hospitals, extended care facilities and in the home. In contrast, however, health care providers across the care continuum are under continued pressure to improve efficiency and control costs, possibly reducing demand for our products and services. These pressures may occur for a number of reasons, including declining commercial third-party payor reimbursement rates, government regulation, and hospital consolidation. In addition, an increasing number of our customers are purchasing through GPO agreements or other large contracts, where they may be able to purchase at lower prices than they would be able to individually. Moreover, general economic pressures have caused some governmental authorities to initiate various austerity measures to control healthcare spending, reducing direct spending in addition to governmental reimbursement rates. These factors may decrease demand for our products, decrease payments to us, or both; however, we may be able to offset some or all of this decreased demand through effective research and development leading to new product introductions. Although we believe that industry demand will increase over time, a lack of demand growth could impact our ability to grow revenue. Customer Consolidation. Economic considerations, competition and other factors have led to on-going consolidation of customer and the centralization of purchasing decision making. This has influenced the criteria customers use to evaluate the value proposition offered by Hill-Rom for various product and service offerings. Economic decision-makers partner with clinical decision-makers to determine product selection. This has caused Hill-Rom to adjust the way we go to market and the structure of our sales and distribution channels, particularly in North America. Among other measures, Hill-Rom established Strategic Partnership Teams as an adjunct to our traditional sales representatives to better address customer needs for products and services that deliver solutions for more cost-effective patient care. The extent to which Hill-Rom effectively addresses evolving needs brought about by customer consolidation could significantly impact the success of our revenue and profitability. Mergers and Acquisitions. We have made several recent acquisitions, most notably the acquisitions of Trumpf, Virtus, Aspen Surgical, and Völker, and we plan to make additional acquisitions in the future. Our past and future acquisitions (to the extent that we make them) may materially impact our results of operations, by increasing our revenue and revenue growth rates, increasing our ongoing operational selling and administrative expenses, adding incremental acquisition and integration related costs, and creating additional non-cash charges associated with the amortization of tangible and intangible assets resulting from purchase accounting. Moreover, to the extent that we acquire businesses that have financial drivers different than our current businesses, our future results of operations will be subject to additional or different factors impacting our financial performance. Growing Desire Among Developed and Developing Countries to Invest in Health Care. While industry growth rates in more mature geographic regions such as western and northern Europe and Japan have moderated, in many other geographic markets, where the relative spending on health care is increasing, we are experiencing increasing demand for medical technologies. New hospital construction and hospital refurbishments have continued in regions such as Latin America, the Middle East and many parts of Asia. These trends could increase overall demand for our products and services. Rising Acuities and Technological Impact. As a result of the growing population of the elderly and obese, health care systems are challenged to treat rising incidences of complex diseases and conditions such as diabetes, congestive heart failure and respiratory disease. Patients are being moved through the hospital faster and generally desire to rapidly move to lower acuity settings. We believe that this increases the demand for more sophisticated means to care for these patients, such as improved medical technologies, communication tools and information technologies. The increasing utilization of these technologies and our ability to meet changing demand with new differentiated products will impact our ability to increase revenue and improve margins in the future.

20
Increasing Operational Efficiency. We have and will continue to undertake initiatives to improve our operating efficiency, including business realignments, employee reductions in force, product rationalizations, lower sourcing costs and continuous improvement activities in our manufacturing facilities and back office functions. We believe our operating expenses and margins will be positively impacted by these actions, but it is possible these activities may not produce the full efficiency and cost reduction benefits we expect, in a timely fashion, or at all. Further, we may utilize savings produced to reinvest in (or fund) other business priorities. Patient and Caregiver Safety and Quality. An increasing emphasis is being placed within hospitals to assure quality of care through increased accountability and public disclosure. At the same time, caregiver shortages, worker related injuries, the aging workforce and other staffing requirements have led to increasing emphasis on caregiver injury prevention. Several pieces of legislation have been enacted over the past few years to address these areas including the "pay for performance" initiative by the Centers for Medicare and Medicaid Services ("CMS") which aims to better align reimbursement with improved patient outcomes and the reduction of adverse events including bedsores (or pressure ulcers), ventilator associated pneumonia, patient falls, deep vein thrombosis and patient entrapment. Hospitals may experience reduced reimbursement for hospital acquired adverse events, making a stronger connection with these adverse events and revenue levels. A number of the top adverse events and preventable medical errors in U.S. hospitals, including those listed above can be mitigated in part by our technologies, processes and services. We believe we are well positioned to benefit from the emphasis being placed on patient safety due to our products and technologies that are designed to assist providers in materially improving outcomes associated with patients confined to beds across all care settings, and we believe that an effective program of new product innovation focusing on these trends will ultimately benefit our revenue growth. Overall increasing emphasis on patient and caregiver safety and quality could increase demand for our products and services. Use of Non-GAAP Financial Measures The accompanying consolidated financial statements, including the related notes, set forth in Part II, Item 8 of this Form 10-K are presented in accordance with accounting principles generally accepted in the U.S. (“GAAP”). We provide non-GAAP measures, including adjusted income before taxes, income tax expense and diluted earnings per share results, because we use these measures internally for planning, forecasting and evaluating the performance of the business. In addition, we analyze net revenue on a constant currency basis to better measure the comparability of results between periods. We believe that evaluating growth in net revenue on a constant currency basis provides an additional and meaningful assessment to both management and investors. We believe use of these non-GAAP measures contribute to an understanding of our financial performance and provide an additional analytical tool to understand our results from core operations and to reveal underlying trends. These measures should not, however, be considered in isolation, as a substitute for, or as superior to measures of financial performance prepared in accordance with GAAP.

21
RESULTS OF OPERATIONS The following table presents comparative operating results for the years discussed within Management’s Discussion and Analysis: Years Ended September 30 % of Related % of Related % of Related (Dollars in millions except per share data) 2014 Revenue 2013 Revenue 2012 Revenue Net Revenue ..............................................
Capital sales ........................................ $ 1,301.4 77.2% $ 1,308.3 76.2% $ 1,198.2 73.3%Rental revenue .................................... 384.7 22.8% 407.9 23.8% 436.1 26.7%
Total Revenue ............................................. 1,686.1 100.0% 1,716.2 100.0% 1,634.3 100.0%Gross Profit ...............................................
Capital sales ........................................ 571.2 43.9% 560.5 42.8% 507.8 42.4%Rental revenue .................................... 208.7 54.3% 219.8 53.9% 246.9 56.6%
Total Gross Profit ....................................... 779.9 46.3% 780.3 45.5% 754.7 46.2%Research and development expenses .......... 71.9 4.3% 70.2 4.1% 66.9 4.1%Selling and administrative expenses ........... 548.3 32.5% 549.5 32.0% 496.4 30.4%Litigation credit .......................................... - - - - (3.6) -0.2%Impairment of other intangibles .................. - - - - 8.0 0.5%Special charges ........................................... 37.1 2.2% 5.7 0.3% 18.2 1.1%Operating Profit ........................................ 122.6 7.3% 154.9 9.0% 168.8 10.3%Other income (expense), net ....................... (7.4) -0.4% (10.9) -0.6% (5.3) -0.3%Income Before Income Taxes ................... 115.2 6.8% 144.0 8.4% 163.5 10.0%Income tax expense .................................... 54.6 3.2% 39.0 2.3% 42.7 2.6%Net Income ................................................ $ 60.6 3.6% $ 105.0 6.1% $ 120.8 7.4%
Net Income per Common Share - Diluted $ 1.04 $ 1.74 $ 1.94
Note: Certain percentage amounts may not add due to rounding. Fiscal Year Ended September 30, 2014 Compared to Fiscal Year Ended September 30, 2013 Consolidated Results of Operations In this section, we provide a high-level overview of our consolidated results of operations. Immediately following this section is a discussion of our results of operations by reportable segment. We disclose segment information that is consistent with the way in which management operates and views the business. Beginning in fiscal 2014, we changed our definition of divisional income within our internal reporting to management to exclude the impacts of acquisition-related intangible asset amortization. As a result, we have changed our segment reporting to reflect the way management views the business. The prior year segment information included has been updated to reflect these changes. Our performance under each reportable segment is measured on a divisional income basis before non-allocated operating and administrative costs, impairment of other intangibles, litigation, special charges, and acquisition-related intangible asset amortization. Divisional income generally represents the division’s gross profit less its direct operating costs along with an allocation of manufacturing and distribution costs, research and development and certain corporate functional expenses. Non-allocated operating and administrative costs include functional expenses that support the entire organization such as administration, finance, legal and human resources, expenses associated with strategic developments, acquisition-related intangible asset amortization, and other events that are not indicative of operating trends. We exclude such amounts from divisional income to allow management to evaluate and understand divisional operating trends without the effects of such items.

22
Net Revenue Years Ended September 30 Percentage Change Constant (Dollars in millions) 2014 2013 As Reported Currency Revenue:
Capital sales ............................................................. $ 1,301.4 $ 1,308.3 (0.5 ) (1.1)Rental revenue .......................................................... 384.7 407.9 (5.7 ) (6.0)
Total Revenue .................................................................... $ 1,686.1 $ 1,716.2 (1.8 ) (2.2)
Capital sales decreased, due primarily to lower patient support system sales in our North America and International segments, which were partially offset by sales increases within the Surgical and Respiratory Care segment. Surgical and Respiratory Care sales increased due to strong organic growth and the acquisition of Trumpf in the fourth quarter of fiscal 2014. In both our North America and International segments, capital order trends continue to be volatile as our customers continue to closely watch their expenditures, looking for clarity in the evolving healthcare marketplace. Rental revenue declined in the North America segment primarily due to lower volumes, continued pricing pressure, and our discontinuance of third-party payer therapy product rentals. Surgical and Respiratory Care rental revenue was flat for fiscal 2014, with international rental revenue also flat on a constant currency basis. Gross Profit Years Ended September 30 Percentage (Dollars in millions) 2014 2013 Change Gross Profit
Capital sales .................................................................................... $ 571.2 $ 560.5 1.9 Percent of Related Revenue ............................................................. 43.9% 42.8%
Rental revenue ................................................................................. $ 208.7 $ 219.8 (5.1)Percent of Related Revenue ............................................................. 54.3% 53.9%
Total Gross Profit ..................................................................................... $ 779.9 $ 780.3 (0.1)Percent of Related Revenue ...................................................................... 46.3% 45.5% Capital gross profit and gross margin increased by $10.7 million and 110 basis points during fiscal 2014. The gross profit increase, despite somewhat lower revenues, comes from improved gross margin rates, driven by the effects of the items outlined below. Gross margin was favorably impacted by reversals of $1.7 million associated with previously recorded field corrective actions compared to charges of $12.2 million in the prior year. The recognition of a $2.8 million benefit from a change in our employee benefit program also favorably impacted gross margin in fiscal 2014. Further, the margin increase was partially offset by $6.0 million of inventory step-up associated with fiscal 2014 acquisitions compared to $2.5 million of inventory step-up recognized in fiscal 2013 resulting from the Aspen Surgical acquisition. In addition, we experienced improved margins in our International segment and in certain Surgical and Respiratory Care product lines, but these were offset by weaker margins in our North America segment and the impact of the Trumpf acquisition. Rental gross profit decreased $11.1 million, but gross margin increased 40 basis points for fiscal 2014. The margin increase is due to the recognition of a $2.8 million benefit from an employee benefit program change, coupled with lower depreciation expense and field service costs.
23
Other
Years Ended September 30 Percentage (Dollars in millions) 2014 2013 Change Research and development expenses ...................................................... $ 71.9 $ 70.2 2.4
Percent of Total Revenue .............................................................. 4.3% 4.1% Selling and administrative expenses ....................................................... $ 548.3 $ 549.5 (0.2)
Percent of Total Revenue .............................................................. 32.5% 32.0% Special charges ....................................................................................... $ 37.1 $ 5.7 550.9 Interest expense ...................................................................................... $ (9.8) $ (9.5) 3.2 Investment income and other, net ........................................................... $ 2.4 $ (1.4) (271.4) Research and development expenses increased 2.4 percent, net of a $1.2 million benefit associated with the employee benefit program change. The increase in expenses is due to higher spending on new product development initiatives and incremental spend related to the recent Trumpf acquisition. Selling and administrative expenses decreased $1.2 million. Selling and administrative expenses were favorably impacted by various cost control initiatives previously implemented, lower variable compensation expenses, and an employee benefit adjustment of $6.6 million referenced earlier. This decrease was partially offset by $10.3 million of acquisition and integration costs compared to $6.3 million in fiscal 2013 and an incremental $8.3 million of Trumpf-related selling and administrative expenses, along with higher medical device tax of $1.6 million. Despite the lower overall spend, selling and administrative expenses were up slightly as a percentage of revenue on the lower revenue. During the second quarter of fiscal 2014, we announced a global restructuring program to improve our cost structure. As part of this program, we offered an early retirement program to certain U.S. employees. Through this program, other reduction in force actions, and the elimination of certain contractor and open positions, we eliminated over 200 net positions primarily in the U.S. This portion of the program resulted in a special charge of $11.0 million related to severance and other benefits to be provided to affected employees. We also recorded a $3.2 million charge related to special pension and postretirement healthcare plan benefits granted to employees eligible for the early retirement program. The severance and other benefits and postretirement benefit charge balances reflect a $1.3 million reclassification compared to the original charge recorded in the second quarter of 2014. Subsequently during the fiscal year, we reversed $0.7 million of the severance and other benefits accrual due to certain plan participants declining continuing healthcare coverage, as well as other changes in circumstances affecting the estimated future payments to be made. This portion of the restructuring program is substantially complete, but cash expenditures will continue into fiscal year 2015. The global restructuring program is also reducing our European manufacturing capacity and streamlining our global operations by, among other things, executing a back office process transformation program in Europe. The restructuring in Europe is in process and has resulted in year to date severance and benefit charges of $6.8 million. We have also incurred other costs associated with the global restructuring program of $4.6 million related to legal and professional fees, temporary labor, project management, and other administrative functions. We expect to incur $15 million to $20 million of additional restructuring costs related to this action over the next two years. All these actions are anticipated to yield annual cost savings of approximately $30 million after full implementation. Also during the second quarter of fiscal 2014, we initiated a plan to discontinue third-party payer rentals of therapy products occurring primarily in home care settings. We intend to continue renting these products to facilities and customers who are billed directly for the product. Due to this action, we recorded a non-cash impairment charge of $7.7 million for certain tangible assets for which the carrying values could not be fully recovered as a result of this strategic decision. We also eliminated approximately 70 positions and recognized a special charge of $2.0 million related to severance and other benefits for affected employees and $1.8 million in other related costs. Over the remainder of the fiscal year, we reversed $0.2 million of the other related costs as original estimates charged. The exit of this business will be substantially complete by the first quarter of fiscal 2015, and certain cash expenditures will extend into fiscal 2015. During the first quarter of fiscal 2014, we initiated a plan to improve our cost structure and streamline our organization by offering an early retirement program to certain manufacturing employees in our Batesville, Indiana plant, meeting specific eligibility requirements, and other minor reduction in force actions. These programs resulted in the elimination of approximately 35 positions and required recognition of a special charge of approximately $1 million for lump sum payments under the program and severance and other benefits provided to other affected employees. This action was substantially complete by the end of the second quarter of fiscal 2014.

24
During the second quarter of fiscal 2013, we announced a plan to improve our cost structure and streamline our organization by eliminating in excess of 100 positions across the Company, roughly half of which were contract and open positions. This resulted in a special charge of $1.7 million related to severance and other benefits to be provided to affected employees. We also incurred a contract termination charge of $0.6 million, a non-cash asset impairment charge of $0.2 million related to a product discontinuance action and $1.0 million in other related costs. We reversed $0.6 million of a fiscal 2012 severance and other benefits charge that was determined to be excessive during the second quarter of fiscal 2013. During the third and fourth quarters of fiscal 2013, we continued actions under the previously announced plan and incurred charges of $0.8 million and $2.0 million, respectively. These actions and the related cash expenditures are substantially complete. Interest expense was higher for fiscal 2014 due to incremental borrowings made in connection with acquisitions. GAAP and Adjusted Earnings Years Ended September 30 2014 2013 (Dollars in millions, except for per share amounts)
Income BeforeIncome Taxes
Income Tax Expense Diluted EPS (1)
Income BeforeIncome Taxes
Income Tax Expense Diluted EPS
GAAP Earnings .................................... $ 115.2 $ 54.6 $ 1.04 $ 144.0 $ 39.0 $ 1.74 Adjustments: .........................................
Acquisition and integration costs .. 16.3 5.0 0.19 8.8 2.9 0.10 Acquisition-related intangible asset amortization .................................. 28.8 8.7 0.34 27.7 10.1 0.29 Field corrective actions ................. (1.7) (0.6) (0.02) 12.2 4.0 0.14 Employee benefits change ............ (13.4) (5.1) (0.14) - - - FDA remediation expenses ........... 4.5 1.7 0.05 6.1 2.3 0.06 Litigation charge ........................... - - - 0.5 0.5 - Special charges ............................. 37.1 10.9 0.45 5.7 1.8 0.06 Foreign valuation allowance and acquisition dividend tax ................ - (20.3) 0.35 - - - International tax reorganization .... - - - - 0.8 (0.01)
Adjusted Earnings ................................. $ 186.8 $ 54.9 $ 2.25 $ 205.0 $ 61.4 $ 2.38
(1) Does not add due to rounding. The tax rate for fiscal 2014 was 47.4 percent compared to 27.1 percent in the prior year. The effective tax rate for fiscal 2014 is higher than fiscal 2013 due primarily to the tax expense recognized in the second quarter of this year to establish a full valuation allowance in France of $19.6 million related to its net deferred tax assets, primarily net operating losses. The effective rate for 2013 was favorably impacted by $5.4 million of period tax benefits consisting primarily of the one-time “catch-up” for the reinstatement of the research and development tax credit, the release of various tax reserves upon statute expiration and the favorable impact of tax law changes in select countries. The adjusted effective tax rates were 29.4 and 30.0 percent for fiscal years 2014 and 2013. Net income was $60.6 million in fiscal 2014 compared to $105.0 million in the prior year period, a decrease of 42.3 percent. On an adjusted basis, net income decreased $11.7 million, or 8.1 percent in 2014 compared to 2013. Diluted earnings per share decreased 40.2 percent on a reported basis and 5.5 percent on an adjusted basis over the same period.

25
Business Segment Results of Operations Years Ended September 30 Percentage Change Constant (Dollars in millions) 2014 2013 As Reported Currency Revenue:
North America ........................................................................... $ 888.9 $ 958.3 (7.2) (6.9)Surgical and Respiratory Care ................................................... 301.6 245.8 22.7 22.0 International ............................................................................... 495.6 512.1 (3.2) (5.1) Total revenue ........................................................................ $ 1,686.1 $ 1,716.2 (1.8) (2.2)
Divisional income: ........................................................................
North America ........................................................................... $ 165.0 $ 201.7 (18.2) Surgical and Respiratory Care ................................................... 68.6 56.8 20.8 International ............................................................................... 24.9 33.5 (25.7)
North America North America revenue decreased 7.2 percent. Capital sales were down 6.6 percent related primarily to volume declines in our patient support systems sales, which were down in a challenging and uncertain North American healthcare environment where there is continued pressure on capital spending. Rental revenue declined by 8.6 percent primarily due to lower volumes, continued pricing pressure, and our discontinuance of third-party payer therapy product rentals. North America divisional income decreased due primarily to lower revenue and the resulting decline in gross profit. The lower gross profit and somewhat higher research and development expenses were only partially offset by lower operating expenses, most notably lower selling and variable compensation costs, along with benefits from previously implemented restructuring programs. Capital margins were down primarily on lower volumes and unfavorable product mix. Rental margins were down as the impact of the lower revenue could not be fully offset by lower depreciation expense and reduced field service costs. Surgical and Respiratory Care Surgical and Respiratory Care revenue increased 22.7 percent. Capital sales increased 30.1 percent related to higher sales volumes primarily in our surgical businesses and the impact of the Trumpf acquisition. Excluding the Trumpf acquisition, capital sales increased 8.9 percent. Rental revenue increased slightly on improved volumes, offsetting continued pricing pressure. Surgical and Respiratory Care divisional income increased on the higher sales volumes and the resulting higher gross profit, despite somewhat lower gross margins due to the dilutive impact of the Trumpf acquisition. The higher gross profit was partially offset by increased research and development and other operating expense spending, generally driven by the Trumpf acquisition and higher corporate expense allocations of $2.8 million. Overall, Trumpf contributed favorably to the improvement in divisional income. International International revenue decreased 3.2 percent. International capital sales decreased 4 percent, or 5.7 percent on a constant currency basis. These declines are due primarily to weaker sales in the Middle East and Europe. Sales in the Middle East region tend to fluctuate based on the timing of large tender deals, while Europe’s healthcare environment continues to face pressure on capital spending similar to that in North America. Rental revenue increased 3.9 percent and was flat on a constant currency basis. International divisional income decreased 25.7 percent. Despite lower revenues, overall gross profit was only down slightly as higher margins on improved product mix offset most of the impacts of lower volumes. However, higher operating expenses were driven by increased research and development spending and higher operating costs associated with the employee related investments in developing markets and higher corporate allocations of $1.5 million.

26
Fiscal Year Ended September 30, 2013 Compared to Fiscal Year Ended September 30, 2012 Consolidated Results of Operations In this section, we provide a high-level overview of our consolidated results of operations. Immediately following this section is a discussion of our results of operations by reportable segment. Net Revenue Years Ended September 30 Percentage Change Constant (Dollars in millions) 2013 2012 As Reported Currency Revenue:
Capital sales ...................................................................... $ 1,308.3 $ 1,198.2 9.2 9.0 Rental revenue .................................................................. 407.9 436.1 (6.5) (6.5)
Total Revenue ............................................................................... $ 1,716.2 $ 1,634.3 5.0 4.9
Capital sales increased, primarily as a result of incremental sales due to our prior year acquisitions of Völker and Aspen Surgical. Excluding the impact from acquisitions, capital sales were flat in our surgical and respiratory businesses and decreased slightly in our International segment. North America capital sales declined on lower volumes and hospital spending pressure. Rental revenue was flat in our International segment and declined in our North America and Surgical and Respiratory segments on lower volumes and unfavorable pricing in select areas. In our North America segment, revenue was down in all lines of business, with the largest percentage decline coming in our home care business where certain restructuring actions were taken in the prior year. Rental revenue in Surgical and Respiratory Care decreased on lower volumes and pricing pressures in our respiratory care business. Gross Profit Years Ended September 30 Percentage (Dollars in millions) 2013 2012 Change Gross Profit
Capital sales ................................................................................................ $ 560.5 $ 507.8 10.4 Percent of Related Revenue ......................................................................... 42.8% 42.4%
Rental revenue ............................................................................................. $ 219.8 $ 246.9 (11.0)Percent of Related Revenue ......................................................................... 53.9% 56.6%
Total Gross Profit ................................................................................................. $ 780.3 $ 754.7 3.4 Percent of Related Revenue .................................................................................. 45.5% 46.2% Capital gross profit increased 10.4 percent on higher revenue, and gross margin (as a percentage of revenue) increased 40 basis points. The increase was due to a number of factors, most notably favorable field corrective action costs and product mix, which was partially offset by unfavorable acquisition costs associated with the step-up of acquired inventories and generally lower margins associated with Aspen Surgical and Völker products. Rental gross profit decreased 11.0 percent and gross margin declined 270 basis points, due to lower revenue and the resulting reduced leverage of our fleet and field service infrastructure as revenue declined quicker than our costs. The prior year gross margin also reflects a gain of $6.5 million related to a completed vendor product recall matter compared to no gains in fiscal 2013.
27
Other Years Ended September 30 Percentage (Dollars in millions) 2013 2012 Change Research and development expenses .................................................................... $ 70.2 $ 66.9 4.9
Percent of Total Revenue ............................................................................ 4.1% 4.1% Selling and administrative expenses ..................................................................... $ 549.5 $ 496.4 10.7
Percent of Total Revenue ............................................................................ 32.0% 30.4% Litigation credit .................................................................................................... $ - $ (3.6) (100.0)Impairment of other intangibles ............................................................................ $ - $ 8.0 (100.0)Special charges ..................................................................................................... $ 5.7 $ 18.2 (68.7) Interest expense .................................................................................................... $ (9.5) $ (6.5) 46.2 Investment income and other, net ......................................................................... $ (1.4) $ 1.2 (216.7) Research and development expenses increased 4.9 percent as we continued to increase our organic investments in new products, including the Progressa™ bed, a new intensive care bed platform launched in fiscal 2013. Selling and administrative expenses increased by 160 basis points as a percentage of revenue and included approximately $27 million of acquisition-related intangible amortization expense, compared to approximately $17 million in fiscal 2012. We also incurred new costs of $12.3 million in fiscal 2013 for FDA remediation and the medical device tax. Selling and administrative expenses also increased due to incremental costs driven by the fiscal 2012 acquisitions, along with higher variable compensation costs. These higher expenses were partially offset by savings from restructuring actions and lower litigation costs. During fiscal 2013, we did not recognize any significant litigation or impairment charges. However, during the fourth quarter of 2012, we reached a favorable litigation settlement of $3.6 million, net of legal fees, related to a patent litigation suit. During fiscal 2012, we also recorded a non-cash impairment charge of $8.0 million related to a previously acquired trade name whose assessment was triggered by strategic changes in how the asset would be utilized on a go forward basis. During the second quarter of fiscal 2013, we announced a plan to improve our cost structure and streamline our organization by eliminating in excess of 100 positions across the Company, roughly half of which were contract and open positions. This resulted in a special charge of $1.7 million related to severance and other benefits to be provided to affected employees. We also incurred a contract termination charge of $0.6 million, a non-cash asset impairment charge of $0.2 million related to a product discontinuance action and $1.0 million in other related costs. We reversed $0.6 million of a fiscal 2012 severance and other benefits charge that was determined to be excessive during the second quarter of fiscal 2013. During the third and fourth quarters of fiscal 2013, we continued actions under the previously announced plan and incurred charges of $0.8 million and $2.0 million, respectively. These actions were substantially complete by the end of fiscal year 2013, but certain cash expenditures extended into fiscal 2014. During the fourth quarter of fiscal 2012, we recorded a non-cash impairment charge of $4.7 million for certain tangible assets for which the carrying values could not be fully recovered as a result of strategic decisions made relative to the exiting of underperforming portions of our home care business. Also associated with this action was the elimination of approximately 100 positions and the related charge of $1.0 million, primarily related to severance and other benefits to be provided to the affected employees. These actions and the related cash expenditures were substantially complete by the end of fiscal year 2013. During the second quarter of fiscal 2012, we announced a plan to improve our cost structure and streamline our organization by, among other things, eliminating approximately 200 positions across the Company resulting in a special charge of $9.3 million, net of reversals, primarily related to severance and other benefits provided to the affected employees. We also recorded an impairment of certain tangible assets for which the carrying values could not be fully recovered as a result of various strategic decisions, which resulted in a non-cash charge of $3.2 million. These actions and the related cash expenditures were complete by the end of fiscal year 2013.

28
Interest expense was higher for fiscal 2013 due to incremental borrowings made in the fourth quarter of fiscal 2012 in conjunction with the Aspen Surgical acquisition. GAAP and Adjusted Earnings Years Ended September 30 2013 2012
(Dollars in millions, except for per share amounts) Income BeforeIncome Taxes
Income Tax Expense Diluted EPS
Income Before Income Taxes
Income Tax Expense Diluted EPS (1)
GAAP Earnings .................................................... $ 144.0 $ 39.0 $ 1.74 $ 163.5 $ 42.7 $ 1.94 Adjustments: .........................................................
Acquisition and integration costs .................. 8.8 2.9 0.10 11.7 2.9 0.14 Acquisition-related intangible asset
amortization .............................................. 27.7 10.1 0.29 16.5 5.5 0.18 Field corrective actions ................................. 12.2 4.0 0.14 16.0 5.9 0.16 FDA remediation expenses ........................... 6.1 2.3 0.06 - - - Litigation (credit) charge .............................. 0.5 0.5 - (3.6) (1.3) (0.04)Special charges ............................................. 5.7 1.8 0.06 18.2 6.8 0.18 Impairment of other intangibles .................... - - - 8.0 2.1 0.09 Vendor product recall ................................... - - - (6.5) (2.5) (0.06)International tax reorganization and
recognition of unrecognized tax attributes ....................... - 0.8 (0.01) - 11.0 (0.18)
Adjusted Earnings ................................................. $ 205.0 $ 61.4 $ 2.38 $ 223.8 $ 73.1 $ 2.42
(1) Does not add due to rounding. The tax rate for fiscal 2013 was 27.1 percent compared to 26.1 percent in the prior year. The effective rates for both fiscal 2013 and 2012 were favorably impacted by the recognition of discrete period tax benefits. The effective rate for 2013 was favorably impacted by $5.4 million of period tax benefits consisting primarily of the one-time “catch-up” for the reinstatement of the research and development tax credit, the release of various tax reserves upon statute expiration and the favorable impact of tax law changes in select countries. The 2013 tax rate also benefited from higher earnings in low tax rate jurisdictions. The effective tax rate for 2012 was favorably impacted by $12.0 million of discrete period tax benefits, most notably the $11.0 million of tax benefits related to the international tax reorganization which occurred in the fourth quarter. The adjusted effective tax rates were 30.0 and 32.7 percent for fiscal years 2013 and 2012. The lower rate in 2013 is due primarily to the discrete period tax benefits referenced above, along with the benefit of higher earnings in low tax rate jurisdictions and reinstatement of the research and development tax credit. For fiscal 2013, the reinstatement of the credit in the second quarter allowed for a full year’s benefit in 2013 as well as required a retroactive “catch up” of previously unrecognized credits. For fiscal 2012, the credit had expired at the end of our first quarter. Net income was $105.0 million in fiscal 2013 compared to $120.8 million in the previous year, a decrease of 13.1 percent. On an adjusted basis, net income decreased $7.1 million, or 4.7 percent. Diluted earnings per share decreased from $1.94 in fiscal 2012 to $1.74 in fiscal 2013 on a reported basis and on an adjusted basis decreased $0.04 to $2.38 per diluted share.

29
Business Segment Results of Operations Years Ended September 30 Percentage Change Constant (Dollars in millions) 2013 2012 As Reported Currency Revenue:
North America ........................................................................... $ 958.3 $ 998.2 (4.0) (3.9)Surgical and Respiratory Care ................................................... 245.8 153.2 60.4 60.6 International ............................................................................... 512.1 482.9 6.0 5.5
Total revenue ........................................................................... $ 1,716.2 $ 1,634.3 5.0 4.9
Divisional income: ........................................................................
North America ........................................................................... $ 201.7 $ 215.4 (6.4) Surgical and Respiratory Care ................................................... 56.8 43.9 29.4 International ............................................................................... 33.5 31.4 6.7
North America North America capital sales were down 2.6 percent related primarily to volume declines in our U.S. patient support systems sales, which were down 5 percent in a difficult North American healthcare environment experiencing continued pressure on capital spending. This decline was partially offset by stronger sales from our healthcare information technology and patient lifting products. Rental revenue declined 7.0 percent, with declines in all business lines. Pricing pressures and volume declines in these product groupings are attributable to continued initiatives by hospitals to control operating costs and competitive pressures. The largest percentage decline in rental revenue came from our home care business where certain restructuring actions were taken in fiscal 2012 to exit certain product lines. North America divisional income decreased due primarily to the lower revenue and the resulting lower gross profit. Capital margins were flat, while rental margins decreased due to reduced leverage of our fleet and field service infrastructure on lower revenue. Operating expenses were favorable primarily due to cost reduction initiatives resulting in lower personnel costs, despite higher incentive compensation, partially offset by approximately $5 million of the medical device tax which went into effect in fiscal 2013. Surgical and Respiratory Care Surgical and Respiratory Care capital sales increased 114.5 percent due primarily to sales included from our fourth quarter fiscal 2012 acquisition of Aspen Surgical. Excluding Aspen Surgical, capital revenue increased 9.4 percent on improved volume. Rental revenue decreased 8.8 percent as a result of lower rental volumes in our respiratory care product line as well as continued pricing pressures. Divisional income for the segment increased as higher gross profits associated with the higher revenue more than offset the incremental operating expenses. While gross profit increased, capital margins declined on the generally lower Aspen Surgical product margins, while rental margins were down on lower revenue and the fixed cost nature of certain rental costs. International International capital sales increased 6.8 percent, due to the incremental sales coming from our second quarter fiscal 2012 acquisition of Völker and strong sales in Europe and Asia. This favorability was partially offset by lower Middle East, Eastern Europe, and Australian revenue coming off strong performances in the prior year. Rental revenue was essentially flat. International divisional income increased slightly, as stronger revenue and higher gross profit were only partially offset by higher operating expenses. Gross profit increased on higher revenue and slightly higher gross margins. Operating expenses increased due to strategic investments in expanding the Latin America, Eastern Europe, and Middle East sales teams and the incremental operating expenses associated with the Völker acquisition along with a somewhat higher allocation of corporate overhead costs corresponding to the increased size of the business.

30
LIQUIDITY AND CAPITAL RESOURCES Years Ended September 30 (Dollars in millions) 2014 2013 2012 Cash Flows Provided By (Used In): Operating activities ............................................................................................... $ 210.3 $ 263.2 $ 261.7 Investing activities ................................................................................................ (294.5) (58.6) (539.5)Financing activities ............................................................................................... 63.8 (161.5) 135.6 Effect of exchange rate changes on cash .............................................................. (7.7) - 1.9 Increase (Decrease) in Cash and Cash Equivalents .............................................. $ (28.1) $ 43.1 $ (140.3)
Net cash flows from operating activities and selected borrowings have represented our primary sources of funds for growth of the business, including capital expenditures and acquisitions. Our financing agreements contain no restrictive provisions or conditions relating to dividend payments, working capital or additional unsecured indebtedness (except to the extent that a dividend payment or incurrence of additional unsecured indebtedness would result in a default under our financing agreements), but there are limitations with respect to secured indebtedness. Our debt agreements also contain no credit rating triggers. Credit rating changes can, however, impact the cost of borrowings under our credit facility described below and any potential future borrowings. Operating Activities Cash flows provided by operating activities during fiscal 2014 were driven primarily by net income, adjusted for the non-cash effects of depreciation and amortization, stock compensation, an impairment loss, and the provision for deferred taxes. The collection of receivables outstanding as of our previous year end and subsequent to the Trumpf acquisition date also contributed to operating cash flow. These sources of cash were only partially offset by other working capital activities. Cash provided by operating activities was down compared to the prior year on lower net income and lower net cash provided by working capital activities, primarily associated with lower receivable collections. These reductions were partially offset by lower tax payments in fiscal 2014. Our cash flows from operations during fiscal 2013 were driven by net income and improved working capital, including strong collections on receivables, adjusted by non-cash expenses related to depreciation and amortization, stock compensation, and deferred taxes. Fiscal 2013 operating cash flows were higher compared to fiscal 2012 primarily due to higher net add-backs of non-cash expenses, partially offset by lower net income. Additionally, continued strong working capital management contributed to our operating cash flows, but were offset by higher fiscal 2013 income tax payments. Our cash flows from operations during fiscal 2012 were driven by net income and improved working capital, including collections on high prior year-end receivables, adjusted by non-cash expenses related to depreciation and amortization, stock compensation, asset impairments and deferred taxes. These sources of cash were offset by the payout of performance-based compensation related to our 2011 fiscal year. Investing Activities Cash used for investing activities consists mainly of capital expenditures and payments for acquisitions. Capital expenditures decreased compared to the prior year, but payments for acquisitions increased primarily due to the purchases of Virtus and Trumpf. Our use of investing cash flows during fiscal 2013 was driven by capital expenditures. The decrease in 2013 net cash used in investing activities compared to fiscal 2012 was primarily due to the significant acquisition activity in the prior year. Our use of investing cash flows during fiscal 2012 was driven primarily by our acquisitions of Aspen Surgical ($399.8 million) and Völker ($77.0 million), as well as capital expenditures. Financing Activities Cash provided by financing activities during fiscal 2014 consisted mainly of borrowings on our existing credit facility which were used to fund acquisition activity during fiscal 2014. This was offset by treasury stock acquired of $71.8 million, payments on outstanding debt of $95.2 million, and dividend payments of $34.2 million. During the year ended September 30, 2014, we increased our dividends paid by $0.07 per share compared to the prior year. This higher utilization
31
of cash was more than offset by our borrowing activity, lower purchases of treasury stock, and higher proceeds on the exercise of stock options. Cash used in financing activities in fiscal 2013 primarily related to treasury stock acquired of $94.0 million, revolving and long-term debt payments of $45.1 million, and dividend payments to our shareholders of $31.2 million. These uses of cash were partially offset by cash proceeds from stock option exercises and other stock issuances under our employee stock purchase plan. Our cash used in financing activities in fiscal 2013 compared to our cash provided by financing activities in fiscal 2012 was primarily driven by borrowings and lower cash outflows for share repurchases in fiscal 2012. Cash provided by financing activities in fiscal 2012 primarily related to $260.0 million of additional borrowings, partially offset by debt payments of $50.0 million, treasury stock acquired of $44.2 million and dividend payments to our shareholders of $30.1 million. The treasury stock acquired balances referenced above refer to purchases in the open market and the repurchases of shares associated with employee payroll tax withholdings for restricted and deferred stock distributions. Our debt-to-capital ratio was 37.9, 26.3, and 30.3 percent at September 30, 2014, 2013 and 2012. The increase in fiscal 2014 was attributable to increased borrowings used to fund acquisitions and a decrease in shareholders’ equity due to treasury stock acquired and accumulated other comprehensive loss recognized in connection with cumulative translation losses and an increase in our net pension obligation. The reduction in 2013 was primarily due to debt repayments and higher equity. Other Liquidity Matters Net cash flows from operating activities and selected borrowings have represented our primary sources of funds for growth of the business, including capital expenditures and acquisitions. We have a credit facility that provides for revolving loans of up to $500.0 million, plus term loans in the aggregate amount of $200.0 million. The Company may request to increase the revolving loan commitment and the amount of the term loans by up to an additional $250.0 million. All amounts due under the credit facility mature upon expiration on August 24, 2017. The related term loans amortize so that 37.5 percent of the principal will be repaid over the five year term, with the balance due at maturity. Borrowings under the credit facility and term loan bear interest at variable rates specified therein, that are currently less than 2.0 percent, and the availability of borrowings is subject to our ability at the time of borrowing to meet certain specified conditions, including compliance with covenants contained in the credit agreement governing the facility. The credit facility contains covenants that, among other matters, require us to maintain a ratio of consolidated indebtedness to consolidated EBITDA (each as defined in the credit agreement) of not more than 3.5:1.0 and a ratio of consolidated EBITDA to interest expense of not less than 3.5:1.0. As of September 30, 2014, we had outstanding borrowings of $265.0 million and undrawn letters of credit of $5.3 million under the facility, leaving $229.7 million of available borrowing capacity. The outstanding balance on the term loan was $176.2 million at September 30, 2014, of which $16.2 million is recognized as the current portion of the balance due. We have trade finance credit lines and uncommitted letter of credit facilities. These lines are associated with the normal course of business and we have $42.4 million of outstanding standby letters of credit as of September 30, 2014. $39.8 million relates to one standby letter of credit issued in connection with the Trumpf acquisition to guarantee Trumpf’s outstanding debt, which we paid off during the fourth quarter of fiscal 2014. The expiration date for this letter of credit is January 2015. We have $49.2 million of senior notes outstanding at various fixed interest rates as of September 30, 2014, classified as long-term in the Consolidated Balance Sheet. As of September 30, 2014, we had one interest rate swap agreement with a notional amount of $126.3 million to hedge the variability of cash flows associated with a portion of the term loan variable interest rate payments for the period of January 2014 to August 2017. The interest rate swap has been designated as a cash flow hedge. The fair value as of September 30, 2014 was less than $0.2 million. Our primary pension plan invests in a variety of equity and debt securities. At September 30, 2014, our latest measurement date, our pension plans were underfunded by approximately $67.7 million. Based on our current funded status we currently do not anticipate any contributions to our primary pension plan in fiscal 2015.

32
We intend to continue to pay quarterly cash dividends comparable to those paid in the periods covered by these financial statements. However, the declaration and payment of dividends by us will be subject to the sole discretion of our Board and will depend upon many factors, including our financial condition, earnings, capital requirements, covenants associated with debt obligations, legal requirements and other factors deemed relevant by our Board. We intend to continue to pursue selective acquisition candidates in certain areas of our business, but the timing, size or success of any acquisition effort and the related potential capital commitments cannot be predicted. We expect to fund future acquisitions primarily with cash on hand, cash flow from operations and borrowings. On August 1, 2014, we completed the acquisition of Trumpf for $223.6 million (net of cash acquired). We funded the transaction with a combination of cash on hand and borrowings under the revolving credit facility. During fiscal 2014, we purchased 1.7 million shares of our common stock for $70.5 million in the open market, leaving $119.5 million available for purchase. The common stock was acquired under a $190 million share repurchase program approved by the Board of Directors in September 2013, which does not have an expiration date. There are no plans to terminate this program in the future. Repurchases may be made on the open market or via private transactions, and are used for general business purposes. We believe that cash on hand and generated from operations, along with amounts available under our credit facility, will be sufficient to fund operations, working capital needs, capital expenditure requirements and financing obligations. However, disruption and volatility in the credit markets could impede our access to capital. Our $500.0 million revolving credit facility is with a syndicate of banks. The syndication group consists of 11 financial institutions, which we believe reduces our exposure to any one institution and would still leave us with significant borrowing capacity in the event that any one of the institutions within the group is unable to comply with the terms of our agreement. As of September 30, 2014, $62.7 million of the Company’s cash and cash equivalents are held by our subsidiaries in foreign countries. Portions of this may be subject to U.S. income taxation if repatriated to the U.S. However, cash and cash equivalents held by foreign subsidiaries are largely used for operating needs outside the U.S. Therefore, we have no need to repatriate this cash for other uses. We believe that cash on hand and generated from operations, along with amounts available under our credit facility, will be sufficient to fund operations, working capital needs, capital expenditure requirements and financing obligations. Credit Ratings During fiscal 2014, Standard and Poor’s Rating Services and Moody’s Investor Service provided a credit rating of BBB and Baa3 with stable outlooks. Other Uses of Cash We expect capital spending in 2015 to be approximately $110 million. Capital spending will be monitored and controlled as the year progresses. Off-Balance Sheet Arrangements We have no material off-balance sheet arrangements.

33
Contractual Obligations, Contingent Liabilities and Commitments To give a clear picture of matters potentially impacting our liquidity position, the following table outlines our contractual obligations as of September 30, 2014: Payments Due by Period Less Than 1 - 3 4 - 5 After 5 (Dollars in millions) Total 1 Year Years Years Years Contractual Obligations Long-term debt obligations ................................... $ 381.2 $ 16.3 $ 315.3 $ 0.2 $ 49.4 Interest payments relating to long-term debt (1) ... 54.2 9.1 14.1 6.6 24.4 Operating lease obligations ................................... 62.9 22.5 29.1 8.6 2.7 Pension and postretirement health care benefit funding (2) .......................... 21.5 2.1 3.8 3.9 11.7 Purchase obligations (3)........................................ 88.0 74.6 13.4 - - Other long-term liabilities (4) ............................... 28.6 - 13.0 12.8 2.8 Total contractual cash obligations ........................ $ 636.4 $ 124.6 $ 388.7 $ 32.1 $ 91.0
(1) Interest payments on our long-term debt are projected based on the contractual rates of remaining debt securities. (2) Based on our funded status as of September 30, 2014, we currently do not anticipate any further contributions to our
master pension plan in fiscal 2015. (3) Purchase obligations represent contractual obligations under various take-or-pay arrangements executed in the normal
course of business. These commitments represent future purchases in line with expected usage to obtain favorable pricing. Also included are obligations arising from purchase orders for which we have made firm commitments. As a result, we believe that the purchase obligations portion of our contractual obligations is substantially those obligations for which we are certain to pay, regardless of future facts and circumstances. We expect to fund purchase obligations with operating cash flows and current cash balances.
(4) Other long-term liabilities include deferred compensation arrangements, self-insurance reserves, and other various
liabilities. We also had commercial commitments related to standby letters of credit at September 30, 2014 of $42.4 million. In addition to the contractual obligations and commercial commitments disclosed above, we also have a variety of other agreements related to the procurement of materials and services and other commitments. While many of these agreements are long-term supply agreements, some of which are exclusive supply or complete requirements-based contracts, we are not committed under these agreements to accept or pay for requirements which are not needed to meet production needs. Also, we have an additional $4.1 million of other liabilities as of September 30, 2014, which represent uncertain tax positions for which it is not possible to determine in which future period the tax liability might be settled. In conjunction with our acquisition and divestiture activities, we have entered into certain guarantees and indemnifications of performance, as well as, non-competition agreements for varying periods of time. Potential losses under the indemnifications are generally limited to a portion of the original transaction price, or to other lesser specific dollar amounts for certain provisions. Guarantees and indemnifications with respect to acquisition and divestiture activities, if triggered, could have a materially adverse impact on our financial condition and results of operations. We are also subject to potential losses from adverse litigation results that are not accounted for by a self-insurance or other reserves; however, such potential losses are not quantifiable at this time, and may never occur. CRITICAL ACCOUNTING POLICIES AND ESTIMATES Our accounting policies, including those described below, require management to make significant estimates and assumptions using information available at the time the estimates are made. Such estimates and assumptions significantly affect various reported amounts of assets, liabilities, revenue and expenses. If future experience differs materially from these estimates and assumptions, results of operations and financial condition could be affected. Our most critical accounting policies are described below.

34
Revenue Recognition Net revenue reflects gross revenue less sales discounts and allowances and customer returns for product sales and rental revenue reserves. Revenue is evaluated under the following criteria and recognized when each is met: Evidence of an arrangement: An agreement with the customer reflecting the terms and conditions to deliver products or
services serves as evidence of an arrangement. Delivery: For products, delivery is considered to occur upon receipt by the customer and the transfer of title and risk of
loss. For rental services, delivery is considered to occur when the services are rendered. Fixed or determinable price: The sales price is considered fixed or determinable if it is not subject to refund or
adjustment. Collection is deemed probable: At or prior to the time of a transaction, credit reviews of each customer are performed to
determine the creditworthiness of the customer. Collection is deemed probable if the customer is expected to be able to pay amounts under the arrangement as those amounts become due. If collection is not probable, revenue is recognized when collection becomes probable, generally upon cash collection.
As a general interpretation of the above guidelines, revenue for health care and surgical products are generally recognized upon delivery of the products to the customer and their assumption of risk of loss and other risks and rewards of ownership. Local business customs and non-standard sales terms can sometimes result in deviations to this normal practice in certain instances; however, in no case is revenue recognized prior to the transfer of risk of loss and rewards of ownership. For non-invasive therapy products and medical equipment management services, the majority of product offerings are rental products for which revenue is recognized consistent with the rendering of the service and use of products. For The Vest® product, revenue is generally recognized at the time of receipt of authorization for billing from the applicable paying entity as this serves as evidence of the arrangement and sets a fixed or determinable price. For health care products and services aimed at improving operational efficiency and asset utilization, various revenue recognition techniques are used, depending on the offering. Arrangements to provide services, routinely under separately sold service and maintenance contracts, result in the deferral of revenue until specified services are performed. Service contract revenue is generally recognized ratably over the contract period, if applicable, or as services are rendered. Product-related goods are generally recognized upon delivery to the customer. Revenue and Accounts Receivable Reserves Revenue is presented in the Statements of Consolidated Income net of certain discounts and sales adjustments. For product sales, we record reserves resulting in a reduction of revenue for contractual discounts, as well as price concessions and product returns. Likewise, rental revenue reserves, reflecting contractual and other routine billing adjustments, are recorded as a reduction of revenue. Reserves for revenue are estimated based upon historical rates for revenue adjustments. Provisions for doubtful accounts are recorded as a component of operating expenses and represent our best estimate of the amount of probable credit losses and collection risk in our existing accounts receivable. We determine such reserves based on historical write-off experience by industry. Receivables are generally reviewed on a pooled basis based on historical collection experience for each receivable type and are also reviewed individually for collectability. Account balances are charged against the allowance when we believe it is probable the receivable will not be recovered. We do not have any off-balance sheet credit exposure related to our customers. If circumstances change, such as higher than expected claims denials, payment defaults, changes in our business composition or processes, adverse changes in general economic conditions, instability or disruption of credit markets, or an unexpected material adverse change in a major customer’s or payor’s ability to meet its obligations, our estimates of the realizability of trade receivables could be reduced by a material amount. Liabilities for Loss Contingencies Related to Lawsuits We are involved on an ongoing basis in claims, investigations and lawsuits relating to our operations, including patent infringement, business practices, commercial transactions and other matters. The ultimate outcome of these actions cannot be predicted with certainty. An estimated loss from these contingencies is recognized when we believe it is probable that a loss

35
has been incurred and the amount of the loss can be reasonably estimated. However, it is difficult to measure the actual loss that might be incurred related to claims, investigations and lawsuits. The ultimate outcome of these actions could have a material adverse effect on our financial condition, results of operations and cash flow. We are also involved in other possible claims, including product and general liability, workers’ compensation, auto liability and employment related matters. Such claims in the United States have deductibles and self-insured retentions ranging from $25 thousand to $1.0 million per occurrence or per claim, depending upon the type of coverage and policy period. International deductibles and self-insured retentions are lower. We are also generally self-insured up to certain stop-loss limits for certain employee health benefits, including medical, drug and dental. Our policy is to estimate reserves based upon a number of factors including known claims, estimated incurred but not reported claims and outside actuarial analysis, which are based on historical information along with certain assumptions about future events. Such estimated reserves are classified as Other Current Liabilities and Other Long-Term Liabilities within the Consolidated Balance Sheets. The recorded amounts represent our best estimate of the costs we will incur in relation to such exposures, but it is possible that actual costs could differ from those estimates. Goodwill and Intangible Assets We account for acquired businesses using the acquisition method of accounting. This method requires that the identifiable assets acquired and liabilities assumed be measured at their fair value, with goodwill being the excess value of consideration paid less the fair value of the net identifiable assets acquired. Judgments and estimates are required in the determination of fair values, including the setting of discount rates, growth rates and forecasted business results for the acquired business and portions of the acquired business, along with estimated useful lives. Changes in these judgments or estimates can have a material impact on the valuation of the respective assets and liabilities acquired and our results of operations. We perform an impairment assessment on goodwill and other indefinite-lived intangibles annually during the third fiscal quarter, or whenever events or changes in circumstances indicate that the carrying value of a reporting unit may not be recoverable. These events or conditions include, but are not limited to, a significant adverse change in the business environment; regulatory environment or legal factors; a current period operating or cash flow loss combined with a history of such losses or a projection of continuing losses; a substantial decline in market capitalization of our stock; or a sale or disposition of a significant portion of a reporting unit. The goodwill impairment assessment requires evaluating qualitative factors or performing a quantitative assessment to determine if a reporting unit’s carrying value is likely to exceed its fair value. The qualitative goodwill impairment assessment requires evaluating factors to determine that a reporting unit’s carrying value would not more likely than not exceed its fair value. As part of our goodwill qualitative testing process for each reporting unit, we evaluate various factors that are specific to the reporting unit as well as industry and macroeconomic factors in order to determine whether it is reasonably likely to have a material impact on the fair value of our reporting units. Examples of the factors that were considered included the results of the most recent impairment test, current and long-range forecasted financial results, and changes in the strategic outlook or organizational structure of the reporting units. The long-range financial forecasts of the reporting units, which are based upon management’s long-term view of our markets and are used by senior management and the Board of Directors to evaluate operating performance, were compared to the forecasts used in the prior year analysis to determine if management expectations for the business have changed. Management changes in strategic outlook or organizational structure represent internally driven strategic or organizational changes that could have a material impact on our results of operations or product offerings. Industry, market changes and macroeconomic indicators represent our view on changes outside of the Company that could have a material impact on our results of operations, product offerings or future cash flow forecasts. In the event we were to determine that a reporting unit’s carrying value would more likely than not exceed its fair value, quantitative testing would be performed comparing carrying values to estimated fair values. Changes in management intentions, market conditions, operating performance and other similar circumstances could affect the assumptions used in this qualitative impairment test. Changes in the assumptions could result in impairment charges that could be material to our Consolidated Financial Statements in any given period. Quantitative testing involves a two-step process. The first step, used to identify potential impairment, is a comparison of each reporting unit’s estimated fair value to its carrying value, including goodwill. If the fair value of a reporting unit exceeds its carrying value, applicable goodwill is considered not to be impaired. If the carrying value exceeds fair value, there is an indication of impairment and the second step is performed to measure the amount of the impairment. The second step requires us to calculate an implied fair value of goodwill. The implied fair value of goodwill is determined in the same manner as the amount of goodwill recognized in a business combination, which is the excess of the fair value of the reporting unit, as determined in the first step, over the aggregate fair values of the individual assets, liabilities and identifiable

36
intangibles as if the reporting unit was being acquired in a business combination. If the goodwill assigned to a reporting unit exceeds the implied fair value of the goodwill, an impairment charge is recorded for the excess. Measurement of the fair value of reporting units in the first step of a quantitative impairment process requires significant management judgment with respect to forecasted sales, gross margin and selling, general and administrative expenses, capital expenditures, the selection and use of an appropriate discount rate, the selection of comparable public companies and the determination of an appropriate control premium. In addition, the use of third-party appraisals of significant tangible and intangible assets as part of the second step of the impairment test also requires management judgment related to certain inputs and assumptions. There are inherent uncertainties related to each of the above listed assumptions and inputs, and our judgment in applying them. The use of different assumptions, estimates or judgments in either step of the process could trigger the need for an impairment charge, or materially increase or decrease the amount of any such impairment charge. Retirement Benefit Plans We sponsor retirement and postretirement benefit plans covering select employees. Expense recognized in relation to these defined benefit retirement plans and the postretirement health care plan is based upon actuarial valuations and inherent in those valuations are key assumptions including discount and mortality rates, and where applicable, expected returns on assets, projected future salary rates and projected health care cost trends. The discount rates used in the valuation of our defined benefit pension and postretirement plans are evaluated annually based on current market conditions. In setting these rates we utilize long-term bond indices and yield curves as a preliminary indication of interest rate movements, and then make adjustments to the respective indices to reflect differences in the terms of the bonds covered under the indices in comparison to the projected outflow of our obligations. Our overall expected long-term rate of return on pension assets is based on historical and expected future returns, which are inflation adjusted and weighted for the expected return for each component of the investment portfolio. Our rate of assumed compensation increase is also based on our specific historical trends of past wage adjustments. Changes in retirement and postretirement benefit expense and the recognized obligations may occur in the future as a result of a number of factors, including changes to any of these assumptions. Our expected rate of return on pension plan assets was 7.0 percent for fiscal 2014 and 2013, and 7.5 percent for 2012. At September 30, 2014, we had pension plan assets of $276.1 million. A 25 basis point increase in the expected rate of return on pension plan assets reduces annual pension expense by approximately $0.6 million. Differences between actual and projected investment returns, especially in periods of significant market volatility, can also impact estimates of required pension contributions. The discount rate for our retirement obligation was 4.5 percent in 2014, 5.0 percent in 2013 and 4.1 percent in 2012. The discount rate for our postretirement obligation may vary up to 200 basis points from that of our retirement obligations. For each 50 basis point change in the discount rate, the impact to annual pension expense ranges from an increase of $2.4 million to a decrease of $2.2 million, while the impact to our postretirement health care plan expense would be less than $0.1 million. Impacts from assumption changes could be positive or negative depending on the direction of the change in rates. Income Taxes We compute our income taxes using an asset and liability approach to reflect the net tax effects of temporary differences between the financial reporting carrying amounts of assets and liabilities and the corresponding income tax amounts. We have a variety of deferred tax assets in numerous tax jurisdictions. These deferred tax assets are subject to periodic assessment as to recoverability and if it is determined that it is more likely than not that the benefits will not be realized, valuation allowances are recognized. We have recorded valuation allowances against certain of our deferred tax assets, primarily those related to foreign tax attributes in countries with poor operating results and certain other domestic tax attributes. In evaluating whether it is more likely than not that we would recover these deferred tax assets, future taxable income, the reversal of existing temporary differences and tax planning strategies are considered. We believe that our estimates for the valuation allowances recorded against deferred tax assets are appropriate based on current facts and circumstances. We currently have $28.3 million of valuation allowances on deferred tax assets, on a tax-effected basis, relating primarily to certain foreign deferred tax attributes. We account for uncertain income tax positions using a threshold and measurement attribute for the financial statement recognition and measurement of a tax position taken or expected to be taken in a tax return. The difference between the tax benefit recognized in the financial statements for an uncertain income tax position and the tax benefit claimed in the tax return is referred to as an unrecognized tax benefit.

37
We also have on-going audits in various stages of completion with the IRS and several state and foreign jurisdictions, one or more of which may conclude within the next 12 months. Such settlements could involve some or all of the following: the payment of additional taxes, the adjustment of certain deferred taxes and/or the recognition of previously unrecognized tax benefits. The resolution of these matters, in combination with the expiration of certain statutes of limitations in various jurisdictions, make it reasonably possible that our unrecognized tax benefits may decrease as a result of either payment or recognition by approximately $3 to $4 million in the next twelve months, excluding interest. Guarantees We routinely grant limited warranties on our products with respect to defects in material and workmanship. The terms of these warranties are generally one year, however, certain components and products have substantially longer warranty periods. We recognize a reserve with respect to these obligations at the time of product sale, with subsequent warranty claims recorded directly against the reserve. The amount of the warranty reserve is determined based on historical trend experience for the covered products. For more significant warranty-related matters which might require a broad-based correction, separate reserves are established when such events are identified and the cost of correction can be reasonably estimated. Inventory We review the net realizable value of inventory on an ongoing basis, considering factors such as excess, obsolescence, and other items. We record an allowance for estimated losses when the facts and circumstances indicate that particular inventories will not be sold at prices in excess of current carrying costs. These estimates are based on historical experience and expected future trends. If future market conditions vary from those projected, and our estimates prove to be inaccurate, we may be required to write down inventory values and record an adjustment to cost of revenue. Recently Issued Accounting Guidance For a summary of recently issued accounting guidance applicable to us, see Note 1 of Notes to Consolidated Financial Statements included under Part II, Item 8 of this Form 10-K.

38
Item 7A. QUANTITATIVE AND QUALITATIVE DISCLOSURES ABOUT MARKET RISK We are exposed to various market risks, including fluctuations in interest rates, the impact of the current economic downturn, collection risk associated with our accounts and notes receivable portfolio, including the effects of various austerity measures initiated by some governmental authorities, and variability in currency exchange rates. We have established policies, procedures and internal processes governing our management of market risks and the use of financial instruments to manage our exposure to such risks. We are subject to variability in foreign currency exchange rates in our international operations. Exposure to this variability is periodically managed primarily through the use of natural hedges, whereby funding obligations and assets are both managed in the local currency. We, from time-to-time, enter into currency exchange agreements to manage our exposure arising from fluctuating exchange rates related to specific and forecasted transactions. We operate this program pursuant to documented corporate risk management policies and do not enter into derivative transactions for speculative purposes. The sensitivity of earnings and cash flows to variability in exchange rates is assessed by applying an appropriate range of potential rate fluctuations to our assets, obligations and projected results of operations denominated in foreign currencies. Our currency risk consists primarily of foreign currency denominated firm commitments and forecasted foreign currency denominated intercompany and third-party transactions. At September 30, 2014, we had outstanding foreign exchange derivative contracts in notional amounts of $7.3 million with the fair value of these contracts approximating original contract value. The maximum length of time over which we hedge transaction exposure is 15 months. Derivative gains/(losses), initially reported as a component of accumulated other comprehensive income (loss), are reclassified to earnings in the period when the forecasted transaction affects earnings. We are exposed to market risk from fluctuations in interest rates. The Company sometimes manages its exposure to interest rate fluctuations through the use of interest rate swaps (cash flow hedges). As of September 30, 2014, we had one interest rate swap agreement with a notional amount of $126.3 million to hedge the variability of cash flows associated with a portion of the term loan variable interest rate payments for the period from January 2014 to August 2017. The interest rate swap has been designated as a cash flow hedge. The interest rate swap fair value was an asset of less than $0.2 million as of September 30, 2014 and 2013. Our pension plan assets, which were approximately $276.1 million at September 30, 2014, are also subject to volatility that can be caused by fluctuations in general economic conditions. Our pension plans were underfunded at September 30, 2014 by approximately $67.7 million, an increase over the prior year based upon a decrease in the discount rate which increased the overall pension obligation and was partially offset by a net increase in plan assets. Continued market volatility and disruption could cause declines in asset values and low interest rates could continue to keep our pension obligation high. Should such trends continue, we may need to make additional pension plan contributions and our pension expense in future years may increase. Investment strategies and policies are set by the plan’s fiduciaries. Long-term strategic investment objectives utilize a diversified mix of equity and fixed income securities to preserve the funded status of the trusts and balance risk and return. The plan fiduciaries oversee the investment allocation process, which includes selecting investment managers, setting long-term strategic targets and monitoring asset allocations. Target allocation ranges are guidelines, not limitations, and plan fiduciaries may occasionally approve allocations above or below a target range or elect to rebalance the portfolio within the targeted range. Trust assets are invested subject to the following policy restrictions: short-term securities must be rated A2/P2 or higher; all fixed-income securities shall have a credit quality rating “BBB” or higher; investments in equities in any one company may not exceed 10 percent of the equity portfolio.
39
Item 8. FINANCIAL STATEMENTS AND SUPPLEMENTARY DATA
INDEX TO CONSOLIDATED FINANCIAL STATEMENTS PageFinancial Statements:
Management’s Report on Internal Control Over Financial Reporting ........................................................................... 40Report of Independent Registered Public Accounting Firm .......................................................................................... 41Statements of Consolidated Income for the fiscal years ended September 30, 2014, 2013 and 2012 ........................... 42Statements of Consolidated Comprehensive Income for the fiscal years ended September 30, 2014, 2013 and 2012 . 43Consolidated Balance Sheets at September 30, 2014 and 2013 ..................................................................................... 44Statements of Consolidated Cash Flows for the fiscal years ended September 30, 2014, 2013 and 2012 .................... 45Statements of Consolidated Shareholders’ Equity for the fiscal years ended September 30, 2014, 2013 and 2012 ..... 46Notes to Consolidated Financial Statements.................................................................................................................. 47
Financial Statement Schedule for the fiscal years ended September 30, 2014, 2013 and 2012:
Schedule II — Valuation and Qualifying Accounts ................................................................................................... 80
All other schedules are omitted because they are not applicable or the required information is shown in the financial statements or the notes thereto.

40
MANAGEMENT’S REPORT ON INTERNAL CONTROL OVER FINANCIAL REPORTING Management is responsible for establishing and maintaining adequate internal control over financial reporting for Hill-Rom Holdings, Inc. (“we” or “our”). Our internal control over financial reporting is a process designed, under the supervision of our principal executive, principal financial and principal accounting officers, and effected by our Board of Directors, management and other personnel, to provide reasonable assurance regarding the reliability of our financial reporting and the preparation of our Consolidated Financial Statements for external purposes in accordance with accounting principles generally accepted in the United States. Our internal control over financial reporting includes policies and procedures that:
1) Pertain to the maintenance of records that, in reasonable detail, accurately and fairly reflect the transactions and dispositions of our assets;
2) Provide reasonable assurance that transactions are recorded as necessary to permit preparation of our Consolidated
Financial Statements in accordance with accounting principles generally accepted in the United States and that our receipts and expenditures are being made only in accordance with authorizations of our management and our Board of Directors; and
3) Provide reasonable assurance regarding prevention or timely detection of unauthorized acquisition, use or
disposition of our assets that could have a material effect on our Consolidated Financial Statements. Because of its inherent limitations, our internal control over financial reporting may not prevent or detect misstatements. Also, projections of any evaluation of effectiveness to future periods are subject to the risk that controls may become inadequate because of changes in conditions, or that the degree of compliance with the policies and procedures may deteriorate. Management performed an assessment of the effectiveness of our internal control over financial reporting as of September 30, 2014 using criteria established in the Internal Control - Integrated Framework (1992) issued by the Committee of Sponsoring Organizations of the Treadway Commission (COSO). Based on these criteria, management concluded that we maintained effective internal control over financial reporting as of September 30, 2014. The effectiveness of our internal control over financial reporting as of September 30, 2014 has been audited by PricewaterhouseCoopers LLP, our independent registered public accounting firm, who also audited our Consolidated Financial Statements, as stated in their report included herein. We have excluded Trumpf Medical from our assessment of internal control over financial reporting as of September 30, 2014, because Trumpf Medical was acquired by us in a purchase business combination in the fourth quarter of 2014. Trumpf Medical is a wholly-owned subsidiary whose total assets and total revenues represent 11 percent and 2 percent, respectively, of the related consolidated financial statement amounts as of and for the year ended September 30, 2014. /s/ John J. Greisch John J. Greisch President and Chief Executive Officer /s/ Michael S. Macek Michael S. Macek Vice President, Treasurer, and Interim Chief Financial Officer /s/ Richard G. Keller Richard G. Keller Vice President, Controller and Chief Accounting Officer

41
REPORT OF INDEPENDENT REGISTERED PUBLIC ACCOUNTING FIRM To the Shareholders and Board of Directors of Hill-Rom Holdings, Inc. In our opinion, the consolidated financial statements listed in the accompanying index present fairly, in all material respects, the financial position of Hill-Rom Holdings, Inc. and its subsidiaries at September 30, 2014 and 2013, and the results of their operations and their cash flows for each of the three years in the period ended September 30, 2014 in conformity with accounting principles generally accepted in the United States of America. In addition, in our opinion, the financial statement schedule listed in the accompanying index presents fairly, in all material respects, the information set forth therein when read in conjunction with the related consolidated financial statements. Also in our opinion, the Company maintained, in all material respects, effective internal control over financial reporting as of September 30, 2014, based on criteria established in Internal Control - Integrated Framework (1992) issued by the Committee of Sponsoring Organizations of the Treadway Commission (COSO). The Company's management is responsible for these financial statements, for maintaining effective internal control over financial reporting and for its assessment of the effectiveness of internal control over financial reporting, included in Management's Report on Internal Control over Financial Reporting. Our responsibility is to express opinions on these financial statements, on the financial statement schedule, and on the Company's internal control over financial reporting based on our integrated audits. We conducted our audits in accordance with the standards of the Public Company Accounting Oversight Board (United States). Those standards require that we plan and perform the audits to obtain reasonable assurance about whether the financial statements are free of material misstatement and whether effective internal control over financial reporting was maintained in all material respects. Our audits of the financial statements included examining, on a test basis, evidence supporting the amounts and disclosures in the financial statements, assessing the accounting principles used and significant estimates made by management, and evaluating the overall financial statement presentation. Our audit of internal control over financial reporting included obtaining an understanding of internal control over financial reporting, assessing the risk that a material weakness exists, and testing and evaluating the design and operating effectiveness of internal control based on the assessed risk. Our audits also included performing such other procedures as we considered necessary in the circumstances. We believe that our audits provide a reasonable basis for our opinions. A company’s internal control over financial reporting is a process designed to provide reasonable assurance regarding the reliability of financial reporting and the preparation of financial statements for external purposes in accordance with generally accepted accounting principles. A company’s internal control over financial reporting includes those policies and procedures that (i) pertain to the maintenance of records that, in reasonable detail, accurately and fairly reflect the transactions and dispositions of the assets of the company; (ii) provide reasonable assurance that transactions are recorded as necessary to permit preparation of financial statements in accordance with generally accepted accounting principles, and that receipts and expenditures of the company are being made only in accordance with authorizations of management and directors of the company; and (iii) provide reasonable assurance regarding prevention or timely detection of unauthorized acquisition, use, or disposition of the company’s assets that could have a material effect on the financial statements. Because of its inherent limitations, internal control over financial reporting may not prevent or detect misstatements. Also, projections of any evaluation of effectiveness to future periods are subject to the risk that controls may become inadequate because of changes in conditions, or that the degree of compliance with the policies or procedures may deteriorate. As described in Management's Report on Internal Control over Financial Reporting, management has excluded Trumpf Medical from its assessment of internal control over financial reporting as of September 30, 2014, because they were acquired by the Company in a purchase business combination during 2014. We have also excluded Trumpf Medical from our audit of internal control over financial reporting. Trumpf Medical is a wholly-owned subsidiary whose total assets and total revenues represent 11 percent and 2 percent, respectively, of the related consolidated financial statement amounts as of and for the year ended September 30, 2014. /s/ PricewaterhouseCoopers LLP PricewaterhouseCoopers LLP Indianapolis, Indiana November 19, 2014

See Notes to Consolidated Financial Statements
42
Hill-Rom Holdings, Inc. and Subsidiaries STATEMENTS OF CONSOLIDATED INCOME (In millions, except per share data) Years Ended September 30 2014 2013 2012 Net Revenue
Capital sales ................................................................................................... $ 1,301.4 $ 1,308.3 $ 1,198.2 Rental revenue ............................................................................................... 384.7 407.9 436.1
Total revenue ........................................................................................................ 1,686.1 1,716.2 1,634.3 Cost of Revenue
Cost of goods sold ......................................................................................... 730.2 747.8 690.4 Rental expenses ............................................................................................. 176.0 188.1 189.2
Total cost of revenue ............................................................................................ 906.2 935.9 879.6 Gross Profit ......................................................................................................... 779.9 780.3 754.7 Research and development expenses .................................................................... 71.9 70.2 66.9 Selling and administrative expenses ..................................................................... 548.3 549.5 496.4 Litigation credit (Note 13) .................................................................................... - - (3.6)Impairment of other intangibles (Note 3) ............................................................. - - 8.0 Special charges (Note 8) ....................................................................................... 37.1 5.7 18.2 Operating Profit .................................................................................................. 122.6 154.9 168.8 Interest expense .................................................................................................... (9.8) (9.5) (6.5)Investment income and other, net ......................................................................... 2.4 (1.4) 1.2 Income Before Income Taxes ............................................................................. 115.2 144.0 163.5 Income tax expense (Note 9) ................................................................................ 54.6 39.0 42.7 Net Income ........................................................................................................... $ 60.6 $ 105.0 $ 120.8
Net Income per Common Share - Basic ............................................................ $ 1.05 $ 1.75 $ 1.94
Net Income per Common Share - Diluted ........................................................ $ 1.04 $ 1.74 $ 1.94
Dividends per Common Share ........................................................................... $ 0.5950 $ 0.5250 $ 0.4875
Average Common Shares Outstanding - Basic (thousands) (Note 10) ........... 57,555 59,910 62,120
Average Common Shares Outstanding - Diluted (thousands) (Note 10) ....... 58,523 60,250 62,361
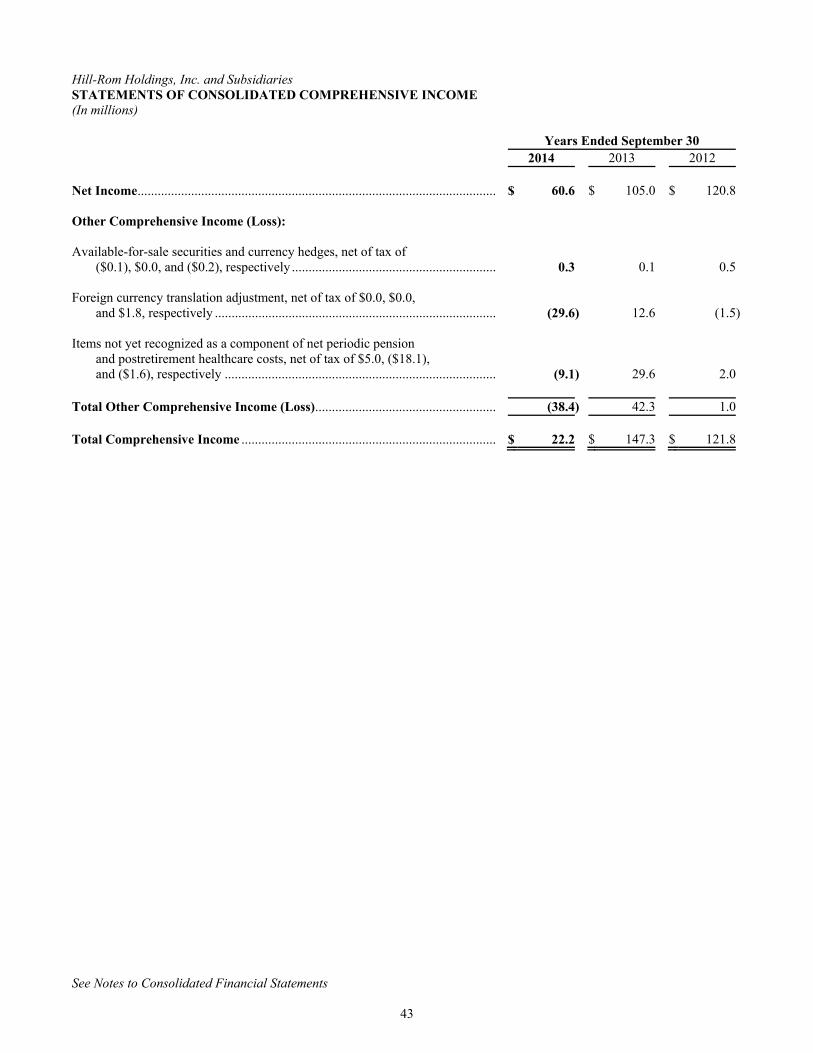
See Notes to Consolidated Financial Statements
43
Hill-Rom Holdings, Inc. and Subsidiaries STATEMENTS OF CONSOLIDATED COMPREHENSIVE INCOME (In millions) Years Ended September 30 2014 2013 2012 Net Income ........................................................................................................... $ 60.6 $ 105.0 $ 120.8 Other Comprehensive Income (Loss): Available-for-sale securities and currency hedges, net of tax of
($0.1), $0.0, and ($0.2), respectively ............................................................. 0.3 0.1 0.5 Foreign currency translation adjustment, net of tax of $0.0, $0.0,
and $1.8, respectively .................................................................................... (29.6) 12.6 (1.5) Items not yet recognized as a component of net periodic pension
and postretirement healthcare costs, net of tax of $5.0, ($18.1), and ($1.6), respectively ................................................................................. (9.1) 29.6 2.0
Total Other Comprehensive Income (Loss) ...................................................... (38.4) 42.3 1.0 Total Comprehensive Income ............................................................................ $ 22.2 $ 147.3 $ 121.8

See Notes to Consolidated Financial Statements.
44
Hill-Rom Holdings, Inc. and Subsidiaries CONSOLIDATED BALANCE SHEETS (In millions, except share amounts) September 30 2014 2013 ASSETS Current Assets Cash and cash equivalents ............................................................................................................ $ 99.3 $ 127.4 Trade accounts receivable, less allowances of $31.4 in 2014 and $30.1 in 2013 (Note 1) ........... 411.0 361.8 Inventories (Note 1) ...................................................................................................................... 176.2 118.3 Deferred income taxes (Notes 1 and 9) ......................................................................................... 40.9 48.2 Other current assets ....................................................................................................................... 51.9 32.3 Total current assets ....................................................................................................................... 779.3 688.0 Property, plant, and equipment (Note 1) ....................................................................................... 849.6 821.7
Less accumulated depreciation .............................................................................................. (588.1) (587.4)Property, plant, and equipment, net .............................................................................................. 261.5 234.3 Intangible assets:
Goodwill (Notes 1, 2 and 3) .................................................................................................. 399.8 342.8 Software and other, net (Notes 1 and 2) ................................................................................ 261.1 252.7
Deferred income taxes (Notes 1 and 9) ......................................................................................... 23.0 37.5 Other assets ................................................................................................................................... 27.4 31.5 Total Assets ................................................................................................................................. $ 1,752.1 $ 1,586.8
LIABILITIES Current Liabilities Trade accounts payable ................................................................................................................. $ 112.7 $ 80.8 Short-term borrowings (Note 4) ................................................................................................... 126.9 81.2 Accrued compensation .................................................................................................................. 89.2 92.4 Accrued product warranties (Note 1) ............................................................................................ 28.4 38.1 Other current liabilities ................................................................................................................. 85.1 52.9 Total current liabilities .................................................................................................................. 442.3 345.4 Long-term debt (Note 4) ............................................................................................................... 364.9 225.8 Accrued pension and postretirement benefits (Note 6) ................................................................. 76.9 52.6 Deferred income taxes (Notes 1 and 9) ......................................................................................... 31.0 67.0 Other long-term liabilities ............................................................................................................. 30.5 37.3 Total Liabilities ........................................................................................................................... 945.6 728.1 Commitments and Contingencies (Note 13) SHAREHOLDERS' EQUITY (Note 7) Capital Stock: Preferred stock - without par value:
Authorized - 1,000,000 shares; none issued or outstanding .................................................. - - Common stock - without par value:
Authorized - 199,000,000 Issued - 80,323,912 shares in 2014 and 2013 ........................................................................ 4.4 4.4
Additional paid-in-capital ............................................................................................................. 134.1 122.7 Retained earnings .......................................................................................................................... 1,499.8 1,473.8 Accumulated other comprehensive loss (Note 1) ........................................................................ (74.1) (35.7)Treasury stock, common shares at cost: 2014 - 22,884,001 and 2013 - 21,800,520 .................... (757.7) (706.5)Total Shareholders' Equity ........................................................................................................ 806.5 858.7 Total Liabilities and Shareholders' Equity ............................................................................... $ 1,752.1 $ 1,586.8
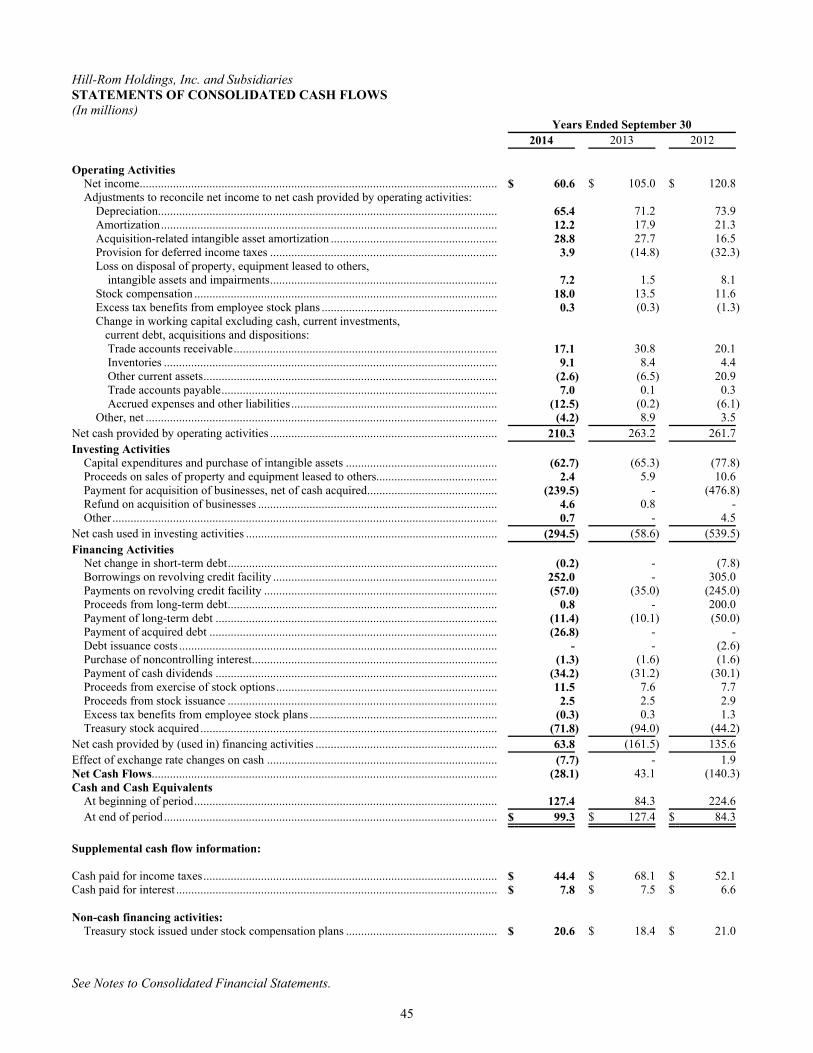
See Notes to Consolidated Financial Statements.
45
Hill-Rom Holdings, Inc. and Subsidiaries STATEMENTS OF CONSOLIDATED CASH FLOWS (In millions) Years Ended September 30 2014 2013 2012 Operating Activities
Net income ...................................................................................................................... $ 60.6 $ 105.0 $ 120.8 Adjustments to reconcile net income to net cash provided by operating activities:
Depreciation ................................................................................................................ 65.4 71.2 73.9 Amortization ............................................................................................................... 12.2 17.9 21.3 Acquisition-related intangible asset amortization ....................................................... 28.8 27.7 16.5 Provision for deferred income taxes ........................................................................... 3.9 (14.8) (32.3)Loss on disposal of property, equipment leased to others,
intangible assets and impairments ........................................................................... 7.2 1.5 8.1 Stock compensation .................................................................................................... 18.0 13.5 11.6 Excess tax benefits from employee stock plans .......................................................... 0.3 (0.3) (1.3)Change in working capital excluding cash, current investments,
current debt, acquisitions and dispositions: Trade accounts receivable ....................................................................................... 17.1 30.8 20.1 Inventories .............................................................................................................. 9.1 8.4 4.4 Other current assets ................................................................................................. (2.6) (6.5) 20.9 Trade accounts payable ........................................................................................... 7.0 0.1 0.3 Accrued expenses and other liabilities .................................................................... (12.5) (0.2) (6.1)
Other, net .................................................................................................................... (4.2) 8.9 3.5 Net cash provided by operating activities ........................................................................... 210.3 263.2 261.7 Investing Activities
Capital expenditures and purchase of intangible assets .................................................. (62.7) (65.3) (77.8)Proceeds on sales of property and equipment leased to others........................................ 2.4 5.9 10.6 Payment for acquisition of businesses, net of cash acquired ........................................... (239.5) - (476.8)Refund on acquisition of businesses ............................................................................... 4.6 0.8 - Other ............................................................................................................................... 0.7 - 4.5
Net cash used in investing activities ................................................................................... (294.5) (58.6) (539.5)Financing Activities
Net change in short-term debt ......................................................................................... (0.2) - (7.8)Borrowings on revolving credit facility .......................................................................... 252.0 - 305.0 Payments on revolving credit facility ............................................................................. (57.0) (35.0) (245.0)Proceeds from long-term debt ......................................................................................... 0.8 - 200.0 Payment of long-term debt ............................................................................................. (11.4) (10.1) (50.0)Payment of acquired debt ............................................................................................... (26.8) - - Debt issuance costs ......................................................................................................... - - (2.6)Purchase of noncontrolling interest................................................................................. (1.3) (1.6) (1.6)Payment of cash dividends ............................................................................................. (34.2) (31.2) (30.1)Proceeds from exercise of stock options ......................................................................... 11.5 7.6 7.7 Proceeds from stock issuance ......................................................................................... 2.5 2.5 2.9 Excess tax benefits from employee stock plans .............................................................. (0.3) 0.3 1.3 Treasury stock acquired .................................................................................................. (71.8) (94.0) (44.2)
Net cash provided by (used in) financing activities ............................................................ 63.8 (161.5) 135.6 Effect of exchange rate changes on cash ............................................................................ (7.7) - 1.9 Net Cash Flows.................................................................................................................. (28.1) 43.1 (140.3)Cash and Cash Equivalents
At beginning of period .................................................................................................... 127.4 84.3 224.6 At end of period .............................................................................................................. $ 99.3 $ 127.4 $ 84.3
Supplemental cash flow information: Cash paid for income taxes ................................................................................................. $ 44.4 $ 68.1 $ 52.1 Cash paid for interest .......................................................................................................... $ 7.8 $ 7.5 $ 6.6 Non-cash financing activities:
Treasury stock issued under stock compensation plans .................................................. $ 20.6 $ 18.4 $ 21.0

See Notes to Consolidated Financial Statements.
46
Hill-Rom Holdings, Inc. and Subsidiaries STATEMENTS OF CONSOLIDATED SHAREHOLDERS’ EQUITY (In millions, except share amounts) Accumulated Common Stock Other Common Stock Shares Additional Retained Comprehensive in Treasury Outstanding Amount Paid-in-Capital Earnings Income (Loss) Shares Amount Total Balance at September 30, 2011 ............................ 61,686,372 $ 4.4 $ 114.1 $ 1,309.8 $ (79.0) 18,637,540 $ (607.6) $ 741.7 Net income............................................................... - - - 120.8 - - - 120.8 Other comprehensive income net of tax of $0.0 ..... - - - - 1.0 - - 1.0 Dividends ................................................................. - - 0.2 (30.3) - - - (30.1)Treasury shares acquired ......................................... (1,532,232) - - - - 1,532,232 (44.2) (44.2)Stock awards and option exercises .......................... 642,783 - 2.5 - - (642,783) 20.9 23.4 Balance at September 30, 2012 ............................ 60,796,923 4.4 116.8 1,400.3 (78.0) 19,526,989 (630.9) 812.6 Net income............................................................... - - - 105.0 - - - 105.0 Other comprehensive income net of tax of ($18.1) - - - - 42.3 - - 42.3 Dividends ................................................................. - - 0.3 (31.5) - - - (31.2)Treasury shares acquired ......................................... (2,844,765) - - - - 2,844,765 (94.0) (94.0)Stock awards and option exercises .......................... 571,234 - 5.6 - - (571,234) 18.4 24.0 Balance at September 30, 2013 ............................ 58,523,392 4.4 122.7 1,473.8 (35.7) 21,800,520 (706.5) 858.7 Net income............................................................... - - - 60.6 - - - 60.6 Other comprehensive loss net of tax of $4.9 ........... - - - - (38.4) - - (38.4)Dividends ................................................................. - - 0.4 (34.6) - - - (34.2)Treasury shares acquired ......................................... (1,709,523) - - - - 1,709,523 (71.8) (71.8)Stock awards and option exercises .......................... 626,042 - 11.0 - - (626,042) 20.6 31.6 Balance at September 30, 2014 ............................ 57,439,911 $ 4.4 $ 134.1 $ 1,499.8 $ (74.1) 22,884,001 $ (757.7) $ 806.5

47
Hill-Rom Holdings, Inc. and Subsidiaries NOTES TO CONSOLIDATED FINANCIAL STATEMENTS (Dollars in millions except per share data) Note 1. SUMMARY OF SIGNIFICANT ACCOUNTING POLICIES Nature of Operations Hill-Rom Holdings, Inc. (the “Company,” “Hill-Rom,” “we,” “us,” or “our”) was incorporated on August 7, 1969 in the State of Indiana and is headquartered in Batesville, Indiana. We are a leading global medical technology company with more than 7,000 employees worldwide. We partner with health care providers in more than 100 countries by focusing on patient care solutions that improve clinical and economic outcomes in five core areas: Advancing Mobility, Wound Care and Prevention, Clinical Workflow, Surgical Safety and Efficiency, and Respiratory Health. Around the world, Hill-Rom's people, products, and programs work towards one mission: Enhancing outcomes for patients and their caregivers. Basis of Presentation and Principles of Consolidation The Consolidated Financial Statements include the accounts of Hill-Rom and its subsidiaries. All subsidiaries are wholly-owned as of September 30, 2014. Intercompany accounts and transactions have been eliminated in consolidation and certain prior year amounts have been reclassified to conform to current year presentation. Use of Estimates The preparation of financial statements in conformity with accounting principles generally accepted in the United States of America requires our management to make estimates and assumptions that affect the reported amounts of certain assets and liabilities and disclosure of contingent assets and liabilities at the date of the financial statements and the reported amounts of revenue and expense during the reporting period. Actual results could differ from those estimates. Examples of such estimates include our accounts receivable reserves (Note 1), accrued warranties (Note 1), the impairment of intangibles and goodwill (Note 3), income taxes (Notes 1 and 9) and commitments and contingencies (Note 13), among others. Cash and Cash Equivalents We consider investments in marketable securities and other highly liquid instruments with a maturity of three months or less at date of purchase to be cash equivalents. Investments which have no stated maturity are also considered cash equivalents. All of our marketable securities may be freely traded. Trade Accounts Receivable Trade accounts receivable are recorded at the invoiced amount and do not bear interest, unless the transaction is an installment sale with payment terms exceeding one year. Reserves for uncollectible accounts represent our best estimate of the amount of probable credit losses and collection risk in our existing accounts receivable. We determine such reserves based on historical write-off experience by industry and reimbursement platform. Receivables are generally reviewed on a pooled basis based on historical collection experience for each reimbursement and receivable type. Receivables for capital sales transactions are also reviewed individually for collectability. Account balances are charged against the allowance when we believe it is probable the receivable will not be recovered. We do not have any off-balance sheet credit exposure related to our customers. If circumstances change, such as higher than expected claims denials, payment defaults, changes in our business composition or processes, adverse changes in general economic conditions, unfavorable impacts of austerity measures initiated by some governmental authorities, instability or disruption of credit markets, or an unexpected material adverse change in a major customer’s or payor’s ability to meet its obligations, our estimates of the realizability of trade receivables could be reduced by a material amount. Within rental revenue, the domestic third-party payors’ reimbursement process requires extensive documentation, which has had the effect of slowing both the billing and cash collection cycles relative to the rest of the business, and therefore, increasing total accounts receivable. Because of the extensive documentation required and the requirement to settle a claim with the primary payor prior to billing the secondary and/or patient portion of the claim, the collection period for a claim in a portion of our business may, in some cases, be extended. We generally hold our trade accounts receivable until they are paid. Certain long-term receivables are occasionally sold to third parties; however, any recognized gain or loss on such sales has historically not been material.
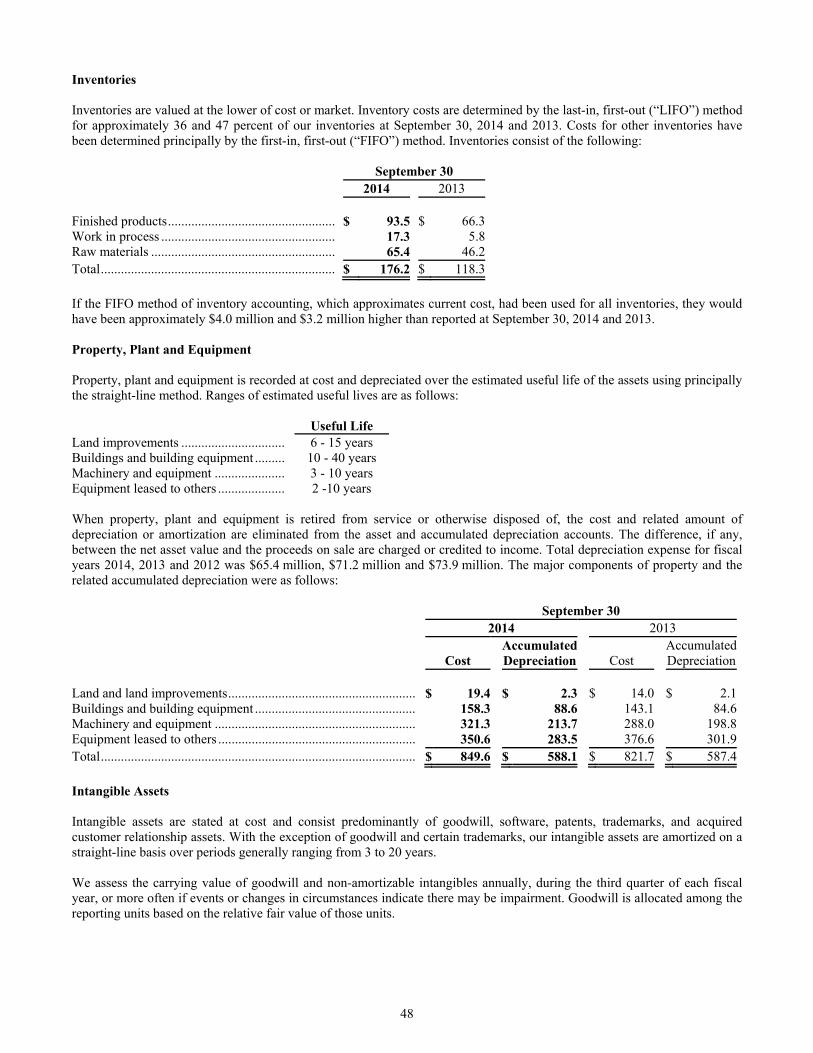
48
Inventories Inventories are valued at the lower of cost or market. Inventory costs are determined by the last-in, first-out (“LIFO”) method for approximately 36 and 47 percent of our inventories at September 30, 2014 and 2013. Costs for other inventories have been determined principally by the first-in, first-out (“FIFO”) method. Inventories consist of the following: September 30 2014 2013 Finished products .................................................. $ 93.5 $ 66.3 Work in process .................................................... 17.3 5.8 Raw materials ....................................................... 65.4 46.2 Total ...................................................................... $ 176.2 $ 118.3
If the FIFO method of inventory accounting, which approximates current cost, had been used for all inventories, they would have been approximately $4.0 million and $3.2 million higher than reported at September 30, 2014 and 2013. Property, Plant and Equipment Property, plant and equipment is recorded at cost and depreciated over the estimated useful life of the assets using principally the straight-line method. Ranges of estimated useful lives are as follows: Useful LifeLand improvements ............................... 6 - 15 years Buildings and building equipment ......... 10 - 40 years Machinery and equipment ..................... 3 - 10 years Equipment leased to others .................... 2 -10 years When property, plant and equipment is retired from service or otherwise disposed of, the cost and related amount of depreciation or amortization are eliminated from the asset and accumulated depreciation accounts. The difference, if any, between the net asset value and the proceeds on sale are charged or credited to income. Total depreciation expense for fiscal years 2014, 2013 and 2012 was $65.4 million, $71.2 million and $73.9 million. The major components of property and the related accumulated depreciation were as follows: September 30 2014 2013 Accumulated Accumulated Cost Depreciation Cost Depreciation Land and land improvements ........................................................ $ 19.4 $ 2.3 $ 14.0 $ 2.1 Buildings and building equipment ................................................ 158.3 88.6 143.1 84.6 Machinery and equipment ............................................................ 321.3 213.7 288.0 198.8 Equipment leased to others ........................................................... 350.6 283.5 376.6 301.9 Total .............................................................................................. $ 849.6 $ 588.1 $ 821.7 $ 587.4
Intangible Assets Intangible assets are stated at cost and consist predominantly of goodwill, software, patents, trademarks, and acquired customer relationship assets. With the exception of goodwill and certain trademarks, our intangible assets are amortized on a straight-line basis over periods generally ranging from 3 to 20 years. We assess the carrying value of goodwill and non-amortizable intangibles annually, during the third quarter of each fiscal year, or more often if events or changes in circumstances indicate there may be impairment. Goodwill is allocated among the reporting units based on the relative fair value of those units.

49
The majority of our goodwill and many of our intangible assets are not deductible for income tax purposes. A summary of intangible assets and the related accumulated amortization and impairment losses follows: September 30 2014 2013 Amortization Amortization Cost and Impairment Cost and Impairment Goodwill ...................................................................................... $ 872.6 $ 472.8 $ 815.6 $ 472.8 Software ....................................................................................... 170.5 146.6 164.6 135.9 Other ............................................................................................ 373.9 136.7 336.4 112.4 Total ............................................................................................. $ 1,417.0 $ 756.1 $ 1,316.6 $ 721.1
Amortization expense for fiscal years 2014, 2013 and 2012 was $41.0 million, $45.6 million and $37.8 million. Amortization expense for all intangibles is expected to approximate the following for each of the next five fiscal years and thereafter: Amount2015 ...................................................... $ 40.92016 ...................................................... $ 38.32017 ...................................................... $ 28.52018 ...................................................... $ 23.82019 ...................................................... $ 18.82020 and beyond ................................... $ 77.9 Software consists mainly of capitalized costs associated with internal use software, including applicable costs associated with the implementation/upgrade of our Enterprise Resource Planning system. In addition, software includes capitalized development costs for software products to be sold. The net book value of computer software costs, included within intangible assets, was $23.9 million and $28.7 million at September 30, 2014 and 2013. Capitalized software costs are amortized on a straight-line basis over periods ranging from three to ten years. Software amortization expense approximated $11.5 million, $17.8 million and $20.7 million for fiscal years 2014, 2013 and 2012, and is included in the total intangibles amortization presented earlier. Fair Value Measurements Fair value measurements are classified and disclosed in one of the following three categories:
Level 1: Financial instruments with unadjusted quoted prices in active markets that are accessible at the measurement date for identical, unrestricted assets and liabilities.
Level 2: Financial instruments with observable inputs other than those included in Level 1 such as quoted prices for similar assets or liabilities; quoted prices in markets that are not active; or other inputs that are observable or can be corroborated by observable market data for substantially the full term of the assets or liabilities.
Level 3: Financial instruments with unobservable inputs that are supported by little or no market activity and that are significant to the fair value of the assets or liabilities. Unobservable inputs reflect our own assumptions that market participants would use in pricing the asset or liability (including assumptions about risk). Unobservable inputs shall be developed based on the best information available in the circumstances, which might include our own data.
We record cash and cash equivalents, as disclosed on our Consolidated Balance Sheets, as Level 1 instruments and certain other insignificant derivatives and investments as either Level 2 or 3 instruments. Refer to Note 4 for disclosure of our debt instrument fair values.

50
Guarantees We routinely grant limited warranties on our products with respect to defects in material and workmanship. The terms of these warranties are generally one year, however, certain components and products have substantially longer warranty periods. We recognize a reserve with respect to these obligations at the time of product sale, with subsequent warranty claims recorded directly against the reserve. The amount of the warranty reserve is determined based on historical trend experience for the covered products. For more significant warranty-related matters which might require a broad-based correction, separate reserves are established when such events are identified and the cost of correction can be reasonably estimated. The warranty reserve for fiscal 2014 includes net field corrective action reversals of $1.7 million as further testing of previously reported issues and actual claims activity supported changes to our prior estimates. During fiscal 2013, we recognized charges of $12.2 million to cover the estimated costs associated with field corrective actions on five different product lines. We also recognized a charge of $16.0 million for a fiscal 2012 field corrective action on one of our med-surg product lines. These field corrective actions do not limit the manufacture, sale or ongoing use of these products. A reconciliation of changes in our warranty reserve is as follows: 2014 2013 2012 Balance at October 1 ............................................................................................. $ 38.1 $ 42.2 $ 17.8 Provision for warranties during the period ........................................................... 9.8 29.2 31.8 Warranty reserves acquired .................................................................................. 3.0 (2.6) 9.7 Warranty claims incurred during the period ......................................................... (22.5) (30.7) (17.1)Balance at September 30 ....................................................................................... $ 28.4 $ 38.1 $ 42.2
In the normal course of business we enter into various other guarantees and indemnities in our relationships with suppliers, service providers, customers, business partners and others. Examples of these arrangements would include guarantees of product performance, indemnifications to service providers and indemnifications of our actions to business partners. These guarantees and indemnifications have not historically nor do we expect them to have a material impact on our financial condition or results of operations, although indemnifications associated with our actions generally have no dollar limitations. In conjunction with our acquisition and divestiture activities, we have entered into select guarantees and indemnifications of performance with respect to the fulfillment of our commitments under applicable purchase and sale agreements. The arrangements generally indemnify the buyer or seller for damages associated with breach of contract, inaccuracies in representations and warranties surviving the closing date and satisfaction of liabilities and commitments retained under the applicable contract. With respect to sale transactions, we also routinely enter into non-competition agreements for varying periods of time. Guarantees and indemnifications with respect to acquisition and divestiture activities, if triggered, could have a materially adverse impact on our financial condition and results of operations. Employee Benefits Change During the second quarter of fiscal 2014, we implemented a new paid time off policy as part of our employee benefits programs, replacing certain previously existing vacation and sick time policies. In conjunction with these changes in policies, the vesting provisions with respect to the accumulation of paid time off were delayed resulting in the recognition and utilization of paid time off in the same benefits year. As a result of this change, significant portions of our existing accrued vacation balance were no longer necessary and we reversed $12.2 million in the second quarter of fiscal 2014 and an additional $1.2 million in the third quarter of fiscal 2014 to reflect the change in vesting provisions. All accounting with respect to this change in policy is now complete. Retirement Plans We sponsor retirement and postretirement plans covering select employees. Expense recognized in relation to these defined benefit retirement plans and the postretirement health care plan in the U.S. is based upon actuarial valuations and inherent in those valuations are key assumptions including discount rates, and where applicable, expected returns on assets, projected future salary rates and projected health care cost trends. The discount rates used in the valuation of our defined benefit pension and postretirement plans are evaluated annually based on current market conditions. In setting these rates we utilize long-term bond indices and yield curves as a preliminary indication of interest rate movements, and then make adjustments to the respective indices to reflect differences in the terms of the bonds covered under the indices in comparison to the projected outflow of our obligations. Our overall expected long-term rate of return on pension assets is based on historical and expected
51
future returns, which are inflation adjusted and weighted for the expected return for each component of the investment portfolio. Our rate of assumed compensation increase is also based on our specific historical trends of wage adjustments. We account for our defined benefit pension and other postretirement plans by recognizing the funded status of a benefit plan in the statement of financial position. We also recognize in accumulated other comprehensive income (loss) certain gains and losses that arose during the period. See Note 6 for key assumptions and further discussion related to our pension and postretirement plans. Environmental Liabilities Expenditures that relate to an existing condition caused by past operations, and which do not contribute to future revenue generation, are expensed. A reserve is established when it is probable that a liability has been incurred and the amount of the loss can be reasonably estimated. These reserves are determined without consideration of possible loss recoveries from third parties. Specific costs included in environmental expense and reserves include site assessment, development of a remediation plan, clean-up costs, post-remediation expenditures, monitoring, fines, penalties and legal fees. Reserve amounts represent the expected undiscounted future cash outflows associated with such plans and actions. Self Insurance We are also involved in other possible claims, including product and general liability, workers’ compensation, auto liability and employment related matters. Such claims in the United States have deductibles and self-insured retentions ranging from $25 thousand to $1.0 million per occurrence or per claim, depending upon the type of coverage and policy period. International deductibles and self-insured retentions are lower. We are also generally self-insured up to certain stop-loss limits for certain employee health benefits, including medical, drug and dental. Our policy is to estimate reserves based upon a number of factors including known claims, estimated incurred but not reported claims and outside actuarial analysis, which are based on historical information along with certain assumptions about future events. Such estimated reserves are classified as Other Current Liabilities and Other Long-Term Liabilities within the Consolidated Balance Sheets. Revenue Recognition — Sales and Rentals Net revenue reflects gross revenue less sales discounts and allowances and customer returns for product sales and rental revenue reserves. Revenue is evaluated under the following criteria and recognized when each is met:
• Evidence of an arrangement: An agreement with the customer reflecting the terms and conditions to deliver products or services serves as evidence of an arrangement.
• Delivery: For products, delivery is considered to occur upon receipt by the customer and the transfer of title and risk
of loss. For rental services, delivery is considered to occur when the services are rendered.
• Fixed or determinable price: The sales price is considered fixed or determinable if it is not subject to refund or adjustment.
• Collection is deemed probable: At or prior to the time of a transaction, credit reviews of each customer are performed
to determine the creditworthiness of the customer. Collection is deemed probable if the customer is expected to be able to pay amounts under the arrangement as those amounts become due. If collection is not probable, revenue is recognized when collection becomes probable, generally upon cash collection.
As a general interpretation of the above guidelines, revenue for health care and surgical products is generally recognized upon delivery of the products to the customer and their assumption of risk of loss and other risks and rewards of ownership. Local business customs and non-standard sales terms can sometimes result in deviations to this normal practice in certain instances; however, in no case is revenue recognized prior to the transfer of risk of loss and rewards of ownership. For non-invasive therapy products and medical equipment management services, the majority of product offerings are rental products for which revenue is recognized consistent with the rendering of the service and use of products. For The Vest® product, revenue is generally recognized at the time of receipt of authorization for billing from the applicable paying entity as this serves as evidence of the arrangement and sets a fixed or determinable price.

52
For health care products and services aimed at improving operational efficiency and asset utilization, various revenue recognition techniques are used, depending on the offering. Arrangements to provide services, routinely under separately sold service and maintenance contracts, result in the deferral of revenue until specified services are performed. Service contract revenue is generally recognized ratably over the contract period, if applicable, or as services are rendered. Product-related goods are generally recognized upon delivery to the customer. Revenue is presented in the Statements of Consolidated Income net of certain discounts and sales adjustments. For product sales, we record reserves resulting in a reduction of revenue for contractual discounts, as well as price concessions and product returns. Likewise, rental revenue reserves, reflecting contractual and other routine billing adjustments, are recorded as a reduction of revenue. Reserves for revenue are estimated based upon historical rates for revenue adjustments. Taxes Collected from Customers and Remitted to Governmental Units Taxes assessed by a governmental authority that are directly imposed on a revenue producing transaction between us and our customers, including but not limited to sales taxes, use taxes, and value added taxes, are accounted for on a net (excluded from revenue and cost) basis. Cost of Revenue Cost of goods sold for capital sales consists primarily of purchased material costs, fixed manufacturing expense, variable direct labor, overhead costs and costs associated with the distribution and delivery of products to our customers. Rental expenses consist of costs associated directly with rental revenue, including depreciation, maintenance, logistics and service center facility and personnel costs. Research and Development Costs Research and development costs are expensed as incurred. Costs were $71.9 million, $70.2 million and $66.9 million for fiscal years 2014, 2013 and 2012. In addition, certain software development technology costs are capitalized as intangibles and are amortized over a period of three to five years once the software is ready for its intended use. The amount capitalized during fiscal years 2014, 2013 and 2012 was approximately $2.6 million, $2.4 million and $2.3 million. Advertising Costs Advertising costs are expensed as incurred. Costs were $7.3 million, $7.4 million and $4.4 million for fiscal years 2014, 2013 and 2012. Comprehensive Income We include the net-of-tax effect of unrealized gains or losses on our available-for-sale securities, foreign currency translation adjustments and pension or other defined benefit postretirement plans’ actuarial gains or losses and prior service costs or credits in comprehensive income. Please see Note 5. Foreign Currency Translation The functional currency of foreign operations is generally the local currency in the country of domicile. Assets and liabilities of foreign operations are primarily translated into U.S. dollars at year-end rates of exchange and the income statements are translated at the average rates of exchange prevailing during the year. Adjustments resulting from translation of the financial statements of foreign operations into U.S. dollars are excluded from the determination of net income, but included as a component of accumulated other comprehensive income (loss). Foreign currency gains and losses resulting from foreign currency transactions are included in our results of operations and are not material. Stock-Based Compensation We account for stock-based compensation under fair value provisions. Stock-based compensation cost is measured at the grant date based on the value of the award and is recognized as expense over the vesting period. In order to determine the fair value of stock options and other performance-based stock awards on the date of grant, we utilize a Binomial model. Inherent in this model are assumptions related to a volatility factor, expected life, risk-free interest rate, dividend yield and expected

53
forfeitures. The risk-free interest rate is based on factual data derived from public sources. The volatility factor, expected life, dividend yield and expected forfeiture assumptions require judgment utilizing historical information, peer data and future expectations. Deferred stock (also known as restricted stock units (“RSUs”)) is measured based on the fair market price of our common stock on the date of grant, as reported by the New York Stock Exchange, multiplied by the number of units granted. See Note 7 for further details. Income Taxes The Company and our eligible domestic subsidiaries file a consolidated U.S. income tax return. Foreign operations file income tax returns in a number of jurisdictions. Deferred income taxes are computed using an asset and liability approach to reflect the net tax effects of temporary differences between the financial reporting carrying amounts of assets and liabilities and the corresponding income tax amounts. We have a variety of deferred tax assets in numerous tax jurisdictions. These deferred tax assets are subject to periodic assessment as to recoverability. If it is determined that it is more likely than not that the benefits will not be realized, valuation allowances are recognized. In evaluating whether it is more likely than not that we would recover these deferred tax assets, future taxable income, the reversal of existing temporary differences and tax planning strategies are considered. We account for uncertain income tax positions using a threshold and measurement attribute for the financial statement recognition and measurement of a tax position taken or expected to be taken in a tax return. The difference between the tax benefit recognized in the financial statements for an uncertain income tax position and the tax benefit claimed in the tax return is referred to as an unrecognized tax benefit. See Note 9 for further details. Derivative Instruments and Hedging Activity We use derivative financial instruments to manage the economic impact of fluctuations in currency exchange and interest rates. Derivative financial instruments related to currency exchange rates include forward purchase and sale agreements which generally have terms no greater than 15 months. Additionally, interest rate swaps are used to convert some or all of our long-term debt to either a fixed or variable rate. Derivative financial instruments are recognized on the Consolidated Balance Sheets as either assets or liabilities and are measured at fair value. Changes in the fair value of derivatives are recorded each period in the Statement of Consolidated Income or the Statement of Consolidated Comprehensive Income, depending on whether a derivative is designated and considered effective as part of a hedge transaction, and if it is, the type of hedge transaction. Gains and losses on derivative instruments reported in accumulated other comprehensive income (loss) are subsequently included in the Statement of Consolidated Income in the periods in which earnings are affected by the hedged item. These activities have not had a material effect on our financial position or results of operations for the periods presented herein. Recently Issued Accounting Guidance In February 2013, an accounting standards update was issued that amends the reporting of amounts reclassified out of accumulated other comprehensive income (loss). This standard does not change the current requirements for reporting net income or other comprehensive income (loss) in the financial statements. However, the guidance requires an entity to provide information about the amounts reclassified out of accumulated other comprehensive income (loss) by component, either on the face of the financial statement where net income is presented or in the notes to the financial statements. The standard is effective for fiscal 2014. See Note 5 for disclosure of our reclassifications out of accumulated other comprehensive loss. In May 2014, the FASB issued Accounting Standards Update (“ASU”) 2014-09, “Revenue from Contracts with Customers”, which provides guidance for revenue recognition. The standard’s core principle is that a company will recognize revenue when it transfers promised goods or services to customers in an amount that reflects the consideration to which the company expects to be entitled in exchange for those goods or services. This guidance will be effective for us in the first quarter of fiscal 2018, ending December 31, 2017. We are currently in the process of evaluating the impact of adoption of this ASU on our Consolidated Financial Statements. Other accounting standards that have been issued or proposed by the FASB or other standards-setting bodies that do not require adoption until a future date are not expected to have a material impact on the Company’s consolidated financial statements upon adoption.

54
NOTE 2. ACQUISITIONS Trumpf Medical On August 1, 2014, we completed the acquisition of Trumpf Medical (“Trumpf”) and funded the transaction with a combination of cash on hand and borrowings under the revolving credit facility. Trumpf Medical provides a portfolio of well-established operating room (OR) infrastructure products such as surgical tables, surgical lighting, and supply units and expands our product offerings in the surgical suite. The purchase price was $229.9 million ($223.6 million net of cash acquired). The results of Trumpf are included in the Consolidated Financial Statements since the date of acquisition. Our reported revenue included $39.0 million for the year ended September 30, 2014 related to Trumpf products and the impact to net income was not significant. The following summarizes the fair value of assets acquired and liabilities assumed at the date of the acquisition. These results are preliminary and subject to normal true-up provisions in the purchase agreement and other fair value adjustments. Amount Trade receivables ...................................................................... $ 66.3 Inventory ................................................................................... 64.4 Other current assets ................................................................... 24.0 Property, plant, and equipment ................................................. 42.1 Goodwill ................................................................................... 57.3 Trade name (5-year useful life)................................................. 6.7 Customer relationships (10-year weighted average useful life) 15.8 Developed technology (8-year weighted average useful life) ... 17.8 Other intangibles ....................................................................... 4.8 Other noncurrent assets ............................................................. 0.7 Deferred tax asset ..................................................................... 14.2 Current liabilities ...................................................................... (70.1)Long term debt .......................................................................... (6.0)Noncurrent liabilities ................................................................ (8.1) Total purchase price ................................................................ $ 229.9
Goodwill was allocated entirely to our Surgical and Respiratory Care segment. The goodwill related to the acquired German operations will be tax deductible while the remaining goodwill will not be deductible for tax purposes. Our total revenue on an unaudited proforma basis, as if the Trumpf acquisition had been consummated at the beginning of our 2013 fiscal year, would have been higher by approximately $218 million and $235 million for the years ended September 30, 2014 and 2013. The impact to net income on an unaudited proforma basis would not have been significant to our financial results for those years. The unaudited pro forma results are based on the Company’s historical financial statements and those of the Trumpf business and do not necessarily indicate the results of operations that would have resulted had the acquisition been completed at the beginning of the comparable period presented and are not indicative of the results of operations in future periods. Virtus, Inc. On March 31, 2014 we completed a stock purchase agreement with the stockholders of Virtus, Inc. (“Virtus”) to acquire the entire equity interest in Virtus: a supplier of finished surfaces and components for our bed and stretcher products. The acquisition of Virtus insources a component of our supply chain. The purchase price was $17.6 million ($13.0 million net of cash acquired). We funded the transaction primarily with borrowings under the revolving credit facility. The results of Virtus are included in the Consolidated Financial Statements since the date of acquisition.

55
The following summarizes the fair value of assets acquired and liabilities assumed at the date of the acquisition. During the third quarter of fiscal 2014, the remaining provisions of the stock purchase agreement were settled and the purchase price is now final. Amount Inventory ...................................................................................... $ 2.6 Other current assets ...................................................................... 5.4 Property, plant, and equipment .................................................... 1.9 Goodwill ...................................................................................... 9.4 Current liabilities ......................................................................... (1.6)Deferred tax liability .................................................................... (0.1) Total purchase price .................................................................. $ 17.6
Goodwill is not deductible for tax purposes and was allocated to both our North America and International segments. The impact to our total revenue and net income on an unaudited proforma basis, as if the Virtus acquisition had been consummated at the beginning of our 2013 fiscal year, would not have been significant for the fiscal years ended September 30, 2014 and 2013. Aspen Surgical On July 23, 2012, we completed a stock purchase agreement with the stockholders and optionholders of Aspen Surgical Products Holding, Inc. (“Aspen Surgical”) to acquire the entire equity interest in Aspen Surgical. The acquisition of Aspen Surgical further develops our surgical business, adding a portfolio of consumable products and expanding our position in the North American and European surgical markets. The purchase price for Aspen Surgical was $402.2 million ($399.8 million net of cash acquired), which was reduced to $401.2 million, resulting from a $1.0 million purchase price adjustment in fiscal 2013. We funded the transaction with a combination of cash on hand and borrowings under the revolving credit facility. The results of Aspen Surgical are included in the Consolidated Financial Statements since the date of acquisition. Throughout fiscal 2013, we made certain adjustments to the opening balance sheet as of the acquisition date as we finalized the purchase price with the seller. The following summarizes the revised fair value of assets acquired and liabilities assumed at the date of the acquisition. Amount Inventory ...................................................................................... $ 25.6 Other current assets ...................................................................... 19.7 Property, plant, and equipment .................................................... 24.6 Goodwill ...................................................................................... 220.1 Trade name (Indefinite Lived) ..................................................... 29.0 Trade name (15-year weighted-average useful life) .................... 4.6 Customer relationships (13-year weighted-average useful life) .. 121.9 Technology (10-year weighted-average useful life) .................... 9.1 Other noncurrent assets ................................................................ 1.6 Current liabilities ......................................................................... (14.0)Deferred tax liability .................................................................... (41.0) Total purchase price .................................................................. $ 401.2
Goodwill was allocated entirely to our Surgical and Respiratory Care segment and is not deductible for tax purposes.

56
Völker On February 13, 2012, we acquired the Germany-based Völker group (“Völker”). Völker is a leading manufacturer of long-term care and acute care bed frames, surfaces and furniture in Europe and around the world. This transaction is expected to strengthen the Company’s channels and product offerings in Europe, and furthers our objective of completing strategically relevant and value-enhancing acquisitions. The original purchase price for Völker was $80.7 million ($77.0 million net of cash acquired), which was reduced by $4.0 million related to a purchase price adjustment in the fourth quarter of fiscal 2012. The results of Völker are included in the Consolidated Financial Statements since the date of acquisition. During the second and fourth quarters of 2013, we made additional adjustments to the opening balance sheet related to the finalization of certain liabilities existing at the date of acquisition. During the first quarter of fiscal 2014, we entered a settlement agreement relating to certain contractual provisions of the Völker purchase agreement. This settlement reduced the purchase price by an additional $3.5 million, bringing the final purchase price to $73.2 million, which was recorded as a reduction of goodwill. The purchase price with respect to Völker is now final. The following summarizes the revised fair value of assets acquired and liabilities assumed at the date of the acquisition. Amount Goodwill ........................................................................................ $ 28.3 Trade name (7-year useful life)...................................................... 12.3 Customer relationships (8-year weighted average useful life) ....... 17.5 Net assets acquired ........................................................................ 24.6 Deferred tax liability ...................................................................... (9.5) Total purchase price ..................................................................... $ 73.2
Goodwill is not deductible for tax purposes and was allocated entirely to our International segment. NOTE 3. GOODWILL AND INDEFINITE-LIVED INTANGIBLE ASSETS The following summarizes goodwill activity by reportable segment:
North
America Surgical and
Respiratory Care International Total Balances at September 30, 2012:
Goodwill ...................................................... $ 383.0 $ 271.5 $ 153.5 $ 808.0 Accumulated impairment losses .................. (358.1) - (114.7) (472.8)
Goodwill, net at September 30, 2012 .................. 24.9 271.5 38.8 335.2 Changes in Goodwill during the period:
Goodwill related to acquisitions .................. - 4.8 (1.9) 2.9 Currency translation effect .......................... - 2.7 2.0 4.7
Balances at September 30, 2013:
Goodwill ...................................................... 383.0 279.0 153.6 815.6 Accumulated impairment losses .................. (358.1) - (114.7) (472.8)
Goodwill, net at September 30, 2013 .................. 24.9 279.0 38.9 342.8 Changes in Goodwill during the period:
Goodwill related to acquisitions .................. 7.6 57.3 (2.8) 62.1 Currency translation effect .......................... - (2.8) (2.3) (5.1)
Balances at September 30, 2014:
Goodwill ...................................................... 390.6 333.5 148.5 872.6 Accumulated impairment losses .................. (358.1) - (114.7) (472.8)
Goodwill, net at September 30, 2014 ............... $ 32.5 $ 333.5 $ 33.8 $ 399.8

57
We acquired Trumpf on August 1, 2014 and assigned all related goodwill to the Surgical and Respiratory Care segment based on the expected benefits resulting from the acquisition. As described in Note 2, we acquired Virtus on March 31, 2014 and recorded goodwill of $9.6 million, which was subsequently adjusted to $9.4 million as of June 30, 2014. The goodwill was allocated between our North America and International segments based on the expected benefits resulting from the acquisition. As discussed in Note 2, we entered a settlement agreement relating to certain contractual provisions of the Völker purchase agreement, which reduced the purchase price by $3.5 million. As discussed in Note 11, we operate in three reportable business segments. Goodwill impairment testing is performed at the reporting unit level, which is one level below a reportable business segment. We have determined that we have ten reporting units. Goodwill is assigned to reporting units at the date the goodwill is initially recorded and has been reallocated as necessary based on the restructuring of reporting units over time. Once goodwill has been assigned to reporting units, it no longer retains its association with a particular acquisition, and all of the activities within a reporting unit, whether acquired or organically grown, are available to support the value of the goodwill. Testing for impairment must be performed annually, or on an interim basis upon the occurrence of a triggering event or change in circumstances that would more likely than not reduce the fair value of a reporting unit below its carrying amount. The annual evaluation of goodwill performed during the third quarter of fiscal 2014 and 2013 did not result in any impairments. A 10 percent reduction in the fair value of any of our reporting units would not result in an impairment charge. Indefinite-lived intangible assets We have various indefinite-lived intangible assets representing trade names with a carrying value of $32.9 million at both September 30, 2014 and September 30, 2013. Testing for impairment must be performed annually, or on an interim basis upon the occurrence of a triggering event or change in circumstances that would more likely than not reduce the fair value of an indefinite-lived intangible asset below its carrying amount. The annual evaluation of indefinite-lived intangible assets performed during the third quarter of fiscal 2014 and 2013 did not result in impairment. NOTE 4. FINANCING AGREEMENTS Total debt consists of the following: September 30 2014 2013 Revolving credit facility ............................................................................................................... $ 265.0 $ 70.0 Term loan current portion ............................................................................................................. 16.2 11.2 Term loan long-term portion ......................................................................................................... 160.0 176.2 Unsecured 7.00% debentures due on February 15, 2024 .............................................................. 19.4 19.6 Unsecured 6.75% debentures due on December 15, 2027 ............................................................ 29.8 29.8 Other ............................................................................................................................................. 1.4 0.2 Total debt ...................................................................................................................................... 491.8 307.0 Less current portion of debt .......................................................................................................... 126.9 81.2 Total long-term debt ..................................................................................................................... $ 364.9 $ 225.8
The following table summarizes the scheduled maturities of long-term debt for fiscal years 2015 through 2019: Term Loan2015 ................................................. $ 16.22016 ................................................. $ 20.02017 ................................................. $ 140.02018 ................................................. $ -2019 ................................................. $ -
58
We have trade finance credit lines and uncommitted letter of credit facilities. These lines are associated with the normal course of business and we have $42.4 million of outstanding standby letters of credit as of September 30, 2014. $39.8 million relates to one standby letter of credit issued in connection with the Trumpf acquisition to guarantee Trumpf’s outstanding debt, which we paid off during the fourth quarter of fiscal 2014. The expiration date for this letter of credit is January 2015. Unsecured debentures outstanding at September 30, 2014 have fixed rates of interest. We have deferred gains included in the amounts above from the termination of previous interest rate swap agreements, and those deferred gains amounted to less than $1 million at both September 30, 2014 and September 30, 2013. The deferred gains on the termination of the swaps are being amortized and recognized as a reduction of interest expense over the remaining term of the related debt, and as a result, the effective interest rates on that debt have been and will continue to be lower than the stated interest rates on the debt. We have a credit facility that provides for revolving loans of up to $500.0 million, plus term loans in the aggregate amount of $200.0 million. The Company may request to increase the revolving loan commitment and the amount of the term loans by up to an additional $250.0 million. All amounts due under the credit facility mature upon expiration on August 24, 2017. The related term loans amortize so that 37.5 percent of the principal will be repaid over the five year term, with the balance due at maturity. Borrowings under the credit facility and term loan bear interest at variable rates specified therein, that are currently less than 2.0 percent, and the availability of borrowings is subject to our ability at the time of borrowing to meet certain specified conditions, including compliance with covenants contained in the credit agreement governing the facility. The credit facility contains covenants that, among other matters, require us to maintain a ratio of consolidated indebtedness to consolidated EBITDA (each as defined in the credit agreement) of not more than 3.5:1.0 and a ratio of consolidated EBITDA to interest expense of not less than 3.5:1.0. As of September 30, 2014, we had outstanding borrowings of $265.0 million and undrawn letters of credit of $5.3 million under the facility, leaving $229.7 million of available borrowing capacity. The outstanding balance on the term loan was $176.2 million at September 30, 2014, of which $16.2 million is recognized as the current portion of the balance due. We are exposed to market risk from fluctuations in interest rates. The Company sometimes manages its exposure to interest rate fluctuations through the use of interest rate swaps (cash flow hedges). As of September 30, 2014, we had one interest rate swap agreement with a notional amount of $126.3 million to hedge the variability of cash flows associated with a portion of the term loan variable interest rate payments for the period from January 2014 to August 2017. The interest rate swap has been designated as a cash flow hedge. The interest rate swap fair value was an asset of less than $0.2 million as of September 30, 2014 and 2013. The fair value measurement for our interest rate swap is classified as Level 2, as described in Note 1. The fair value of our debt is estimated based on the quoted market prices for the same or similar issues or on the current rates offered to us for debt of the same remaining maturities. The book values of our short-term debt instruments approximate fair value. The estimated fair values of our long-term unsecured debentures were $55.5 million and $52.5 million at September 30, 2014 and 2013, and were based on observable inputs such as quoted prices in markets that are not active. The estimated fair value of our term loan was $175.2 million and $185.5 million based on quoted prices for similar liabilities at September 30, 2014 and 2013. The fair value measurements for both our long-term unsecured debentures and our term loan were classified as Level 2, as described in Note 1.

59
NOTE 5. OTHER COMPREHENSIVE INCOME The following table represents the changes in accumulated other comprehensive loss by component for the year to date period ended September 30, 2014:
Available-For-SaleSecurities and Cash
Flow Hedges (1)
Foreign Currency Translation
Adjustment (1)
Changes in Pensionand Postretirement
Defined Benefit Plans (1)
Balance as of September 30, 2013 ........................... $ (0.3) $ (4.6) $ (30.8)OCI before reclassifications (2) ........................ 0.2 (29.6) (10.8)Amounts reclassified out of AOCL .................. 0.1 - 1.7
Net current period OCI ............................................ 0.3 (29.6) (9.1)Balance as of September 30, 2014 ......................... $ - $ (34.2) $ (39.9)
(1) All amounts are net of tax. (2) Net of tax of ($0.1), $0.0, and $6.0 for available-for-sale securities and cash flow hedges, foreign currency translation
adjustment, and changes in pension and postretirement defined benefit plans, respectively. The following table represents the items reclassified out of accumulated other comprehensive loss and the related tax effects during fiscal 2014: Year End September 30, 2014 Pension and postretirement defined benefit plan items
Amortization of amounts included in net periodic pension expense and postretirement healthcare costs (1).............................................................................................................. $ 2.7 Tax expense ........................................................................................................................ (1.0)Net of tax............................................................................................................................. $ 1.7
Available-for-sale securities and cash flow hedges items:
Recognition of other-than-temporary impairment on investment securities (2) ................. $ 0.1 Tax expense ........................................................................................................................ - Net of tax............................................................................................................................. $ 0.1
(1) Reclassified from AOCL into cost of goods sold and selling and administrative expenses. These components are
included in the computation of net periodic pension expense and postretirement healthcare costs. (2) Reclassified from AOCL into other income (expense), net.

60
NOTE 6. RETIREMENT AND POSTRETIREMENT BENEFIT PLANS Our retirement plans consist of defined benefit plans, a postretirement healthcare plan, and defined contribution savings plans. Plans cover certain employees both in and outside of the U.S. Retirement Plans We sponsor five defined benefit plans. Those plans include a master defined benefit retirement plan, a nonqualified supplemental executive defined benefit retirement plan, and three defined benefit retirement plans covering employees in Germany and France. Benefits for such plans are based primarily on years of service and the employee’s level of compensation during specific periods of employment. We contribute funds to trusts as necessary to provide for current service and for any unfunded projected future benefit obligation over a reasonable period of time. All of our plans have a September 30 measurement date. Effect on Operations The components of net periodic benefit cost for our defined benefit retirement plans were as follows: Years Ended September 30 2014 2013 2012 Service cost ............................................................................................ $ 5.0 $ 6.1 $ 5.5 Interest cost ............................................................................................ 14.4 13.2 13.3 Expected return on plan assets ............................................................... (16.7) (15.9) (16.7)Amortization of unrecognized prior service cost, net ............................ 0.6 0.6 0.6 Amortization of net loss ......................................................................... 3.2 7.8 6.1 Net periodic benefit cost ........................................................................ 6.5 11.8 8.8 Special termination benefits ................................................................... 2.4 - - Net pension expense .............................................................................. $ 8.9 $ 11.8 $ 8.8
During the second quarter of fiscal 2014, we initiated a domestic early retirement program, which offered certain special termination benefits relating to our pension and postretirement health care plans. This program and the related special termination benefits resulted in a non-cash charge of $3.2 million, of which $2.4 million related to our master defined benefit retirement plan and $0.8 million for our postretirement health care plan. The $0.8 million postretirement healthcare charge also reflects a $1.3 million reversal recorded as certain participants elected alternative coverage separate from the postretirement health care plan. The employee elections were not known until the third and fourth quarters of fiscal 2014. The reversal was recorded to the special charges caption and is offset by charges recorded to reflect our incremental cost associated with the alternative coverage. Refer to Note 8 for more details.

61
Obligations and Funded Status The change in benefit obligations, plan assets and funded status, along with amounts recognized in the Consolidated Balance Sheets for our defined benefit retirement plans were as follows: Years Ended September 30 2014 2013 Change in benefit obligation:
Benefit obligation at beginning of year .............................................................. $ 297.9 $ 327.4 Service cost ........................................................................................................ 5.0 6.1 Interest cost ........................................................................................................ 14.4 13.2 Actuarial loss (gain) ........................................................................................... 31.4 (41.1)Benefits paid ...................................................................................................... (10.2) (9.1)Acquisitions ....................................................................................................... 4.3 - Amendments ...................................................................................................... - 0.6 Special termination benefits ............................................................................... 2.4 - Exchange rate (gain) loss ................................................................................... (1.4) 0.8 Benefit obligation at end of year ........................................................................ 343.8 297.9
Change in plan assets:
Fair value of plan assets at beginning of year .................................................... 254.4 246.8 Actual return on plan assets ............................................................................... 30.9 15.7 Employer contributions ...................................................................................... 1.0 1.0 Benefits paid ...................................................................................................... (10.2) (9.1)Fair value of plan assets at end of year .............................................................. 276.1 254.4
Funded status and net amounts recognized ........................................................... $ (67.7) $ (43.5)
Amounts recorded in the Consolidated Balance Sheets:
Accrued pension benefits, current portion ......................................................... $ (1.0) $ (0.2)Accrued pension benefits, long-term ................................................................. (66.7) (43.3)Net amount recognized ...................................................................................... $ (67.7) $ (43.5)
In addition to the amounts above, net actuarial losses of $65.0 million and prior service costs of $1.7 million, less an applicable aggregate tax effect of $24.8 million are included as components of accumulated other comprehensive loss at September 30, 2014. At September 30, 2013, net actuarial losses of $51.3 million and prior service costs of $2.4 million, less an applicable aggregate tax effect of $20.0 million, were included as components of accumulated other comprehensive loss. The estimated net actuarial loss and prior service cost for our defined benefit retirement plans that will be amortized from accumulated other comprehensive loss into net periodic benefit cost over the next fiscal year are $5.4 million and $0.6 million.

62
Accumulated Benefit Obligation The accumulated benefit obligation for all defined benefit pension plans was $325.9 million and $278.8 million at September 30, 2014 and 2013. Selected information for our plans, including plans with accumulated benefit obligations exceeding plan assets, was as follows: September 30 2014 2013 PBO ABO Plan Assets PBO ABO Plan Assets Master plan ................................... $ 319.1 $ 303.2 $ 275.8 $ 279.2 $ 261.7 $ 254.0 International plans ........................ 20.3 18.5 0.3 14.8 13.4 0.4 Supplemental executive plan ........ 4.4 4.2 - 3.9 3.7 - $ 343.8 $ 325.9 $ 276.1 $ 297.9 $ 278.8 $ 254.4
Actuarial Assumptions The weighted average assumptions used in accounting for our domestic pension plans were as follows: 2014 2013 2012 Weighted average assumptions to determine benefit
obligations at the measurement date: Discount rate for obligation ..................................................................................... 4.5% 5.0% 4.1% Rate of compensation increase ................................................................................ 3.0% 3.3% 3.3% Weighted average assumptions to determine benefit
cost for the year: Discount rate for expense ........................................................................................ 5.0% 4.1% 4.6% Expected rate of return on plan assets ...................................................................... 7.0% 7.0% 7.5% Rate of compensation increase ................................................................................ 3.3% 3.3% 3.5% The discount rates used in the valuation of our defined benefit pension plans are evaluated annually based on current market conditions. In setting these rates we utilize long-term bond indices and yield curves as a preliminary indication of interest rate movements, and then make adjustments to the respective indices to reflect differences in the terms of the bonds covered under the indices in comparison to the projected outflow of our pension obligation. The overall expected long-term rate of return is based on historical and expected future returns, which are inflation adjusted and weighted for the expected return for each component of the investment portfolio, as well as taking into consideration economic and capital market conditions. The rate of assumed compensation increase is also based on our specific historical trends of past wage adjustments. The weighted average assumptions used for our international plans are lower than our domestic plan assumptions and do not significantly affect the consolidated net benefit obligation or net periodic benefit cost balances. Plan Assets The weighted average asset allocations of our master defined benefit retirement plan at September 30, 2014 and 2013, by asset category, along with target allocations, are as follows: 2014 2013 2014 2013 Target Target Actual Actual Allocation Allocation Allocation Allocation Equity securities.......................................................................................... 40 - 60% 40 - 60% 52% 57% Fixed income securities .............................................................................. 40 - 60% 40 - 60% 48% 43% Total ............................................................................................................ 100% 100%

63
We have a Plan Committee that sets investment guidelines with the assistance of an external consultant. These guidelines are established based on market conditions, risk tolerance, funding requirements and expected benefit payments. The Plan Committee also oversees the investment allocation process, selects the investment managers and monitors asset performance. As pension liabilities are long-term in nature, we employ a long-term total return approach to maximize the long-term rate of return on plan assets for a prudent level of risk. Target allocations are guidelines, not limitations, and plan fiduciaries may occasionally approve allocations above or below a target range or elect to rebalance the portfolio within the targeted range. The investment portfolio contains a diversified portfolio of primarily equities and fixed income securities. Securities are also diversified in terms of domestic and international securities, short- and long-term securities, growth and value styles, large cap and small cap stocks. The Plan Committee believes with prudent risk tolerance and asset diversification, the account should be able to meet its pension obligation in the future. Trust assets are invested subject to the following policy restrictions: short-term securities must be rated A2/P2 or higher; all fixed-income securities shall have a credit quality rating “BBB” or higher; investments in equities in any one company may not exceed 10 percent of the equity portfolio. Fair Value Measurements of Plan Assets The following table summarizes the valuation of our pension plan assets by pricing categories: Quoted Prices in Significant Active Markets Other Significant for Identical Observable Unobservable Balance at Assets Inputs Inputs September 30, 2014 (Level 1) (Level 2) (Level 3) Cash .............................................................................. $ 2.1 $ 2.1 $ - $ - Equities
US companies ........................................................ 101.7 101.7 - - International companies ......................................... 38.7 38.7 - -
Fixed income securities ................................................ 133.2 66.8 66.4 - Other ............................................................................. 0.4 0.4 - - Total plan assets at fair value .................................... $ 276.1 $ 209.7 $ 66.4 $ -
Quoted Prices in Significant Active Markets Other Significant for Identical Observable Unobservable Balance at Assets Inputs Inputs September 30, 2013 (Level 1) (Level 2) (Level 3) Cash .............................................................................. $ 3.0 $ 3.0 $ - $ - Equities
U.S. companies ...................................................... 101.0 101.0 - - International companies ......................................... 41.2 41.2 - -
Fixed income securities ................................................ 108.8 59.1 49.7 - Other ............................................................................. 0.4 0.4 - - Total plan assets at fair value ........................................ $ 254.4 $ 204.7 $ 49.7 $ -
The Level 2 fixed income securities are commingled funds valued using the net asset value (“NAV”) unit price provided by the fund administrator. The NAV is based on the value of the underlying assets owned by the fund, all of which are publicly traded securities. For further descriptions of the asset Levels used in the above chart, refer to Note 1. Cash Flows Our U.S. qualified defined benefit plan is funded in excess of 80 percent, and therefore we expect that the plan will not be subject to the “at risk” funding requirements of the Pension Protection Act. During 2014 and 2013, we contributed cash of $1.0 million and $1.0 million to our defined benefit retirement plans. We do not expect to contribute to our master defined benefit retirement plan in fiscal year 2015 due to the current funding level; however, minimal contributions will be required for our unfunded plans.

64
Estimated Future Benefit Payments The benefit payments, which are expected to be funded through plan assets and company contributions and reflect expected future service, are expected to be paid as follows: Pension Benefits 2015 ...................................................... $ 12.6 2016 ...................................................... $ 13.3 2017 ...................................................... $ 13.8 2018 ...................................................... $ 14.5 2019 ...................................................... $ 15.4 2020-2024 ............................................. $ 92.2 Defined Contribution Savings Plans We have defined contribution savings plans that cover substantially all U.S. employees and certain non-U.S. employees. The general purpose of these plans is to provide additional financial security during retirement by providing employees with an incentive to make regular savings. Company contributions to the plans are based on eligibility and employee contributions. Expense under these plans was $15.0 million, $15.8 million and $13.3 million in fiscal years 2014, 2013 and 2012. Postretirement Health Care Plan In addition to defined benefit retirement plans, we also offer a domestic postretirement health care plan that provides health care benefits to qualified retirees and their dependents. The plan includes retiree cost sharing provisions and generally extends retiree coverage for medical, prescription and dental benefits beyond the COBRA continuation period to the date of Medicare eligibility. We use a measurement date of September 30 for this plan. The postretirement health care plan reflected a credit during fiscal 2014, 2013 and 2012 of ($0.2) million, ($0.1) million and ($0.3) million. The change in the accumulated postretirement benefit obligation was as follows: Years Ended September 30 2014 2013 Change in benefit obligation:
Benefit obligation at beginning of year .................................................................... $ 9.8 $ 9.6 Service cost .............................................................................................................. 0.4 0.4 Interest cost .............................................................................................................. 0.4 0.3 Actuarial (gain) loss ................................................................................................. (0.2) (0.2)Benefits paid ............................................................................................................ (0.2) (0.5)Retiree contributions ................................................................................................ 0.2 0.2 Special termination benefits ..................................................................................... 0.8 -
Benefit obligation at end of year ................................................................................. $ 11.2 $ 9.8
Amounts recorded in the Consolidated Balance Sheets:
Accrued benefits obligation, current portion ........................................................... $ 1.1 $ 0.5 Accrued benefits obligation, long-term.................................................................... 10.1 9.3
Net amount recognized ............................................................................................... $ 11.2 $ 9.8
We contributed less than $0.1 million to the plan in fiscal 2014, compared with $0.3 million contributed in fiscal 2013. In addition to the amounts above, net actuarial gains of $1.7 million and prior service credits of $2.3 million, less an applicable aggregate tax effect of ($1.6) million are included as components of accumulated other comprehensive loss at September 30, 2014. At September 30, 2013, net actuarial gains of $1.8 million and prior service credits of $3.0 million, less an applicable aggregate tax effect of ($1.9) million are included as components of accumulated other comprehensive loss. The estimated net actuarial gain and prior service benefit for our postretirement health care plan that will be amortized from accumulated other comprehensive loss into net periodic benefit cost over the next fiscal year are ($0.1) million and ($0.9) million.

65
The discount rate used to determine the net periodic benefit cost for the postretirement health care plan during the fiscal year ended September 30, 2014, 2013 and 2012 was 4.1, 3.3 and 4.0 percent. The discount rate used to determine the benefit obligation as of September 30, 2014, 2013 and 2012 was 3.7, 4.1 and 3.3 percent. As of September 30, the health care-cost trend rates were assumed to decrease as follows: 2014 2013 2012 Year 1 ...................................................... 5.75% 6.25% 6.75% Year 2 ...................................................... 5.25% 5.75% 6.25% Year 3 ...................................................... 5.00% 5.25% 5.75% Year 4 ...................................................... 5.00% 5.00% 5.25% Year 5 ...................................................... 5.00% 5.00% 5.00% Year 6 ...................................................... 5.00% 5.00% 5.00% Year 7 ...................................................... 5.00% 5.00% 5.00% Year 8 and beyond ................................... 5.00% 5.00% 5.00% A one-percentage-point increase/decrease in the assumed health care cost trend rates as of September 30, 2014 would cause an increase/decrease in service and interest costs of less than $0.1 million, along with an increase/decrease in the benefit obligation of $0.8 million and $0.8 million. We fund the postretirement health care plan as benefits are paid, and current plan benefits are expected to require net company contributions of approximately $1.0 million in fiscal 2015 and less than $1.0 million per year thereafter. NOTE 7. COMMON STOCK Share Repurchases We repurchased 1.7 million, 2.8 million and 1.5 million shares of our common stock during fiscal years 2014, 2013 and 2012 for $70.5 million, $92.7 million and $42.4 million, respectively, in the open market. The common stock was acquired under a $190 million share repurchase program approved by the Board of Directors in September 2013, which does not have an expiration date. There are no plans to terminate this program in the future. Repurchases may be made on the open market or via private transactions, and are used for general business purposes. Stock-Based Compensation We have stock-based compensation plans under which employees and non-employee directors may be granted options to purchase shares of Company common stock at the fair market value at the time of grant. In addition to stock options, we grant performance share units (“PSUs”) and RSUs to certain management level employees and vested deferred stock to non-employee directors. We also offer eligible employees the opportunity to buy shares of our common stock at a discount via an Employee Stock Purchase Plan (“ESPP”). Our primary stock-based compensation program is the Stock Incentive Plan, which has been approved by our shareholders. Under the Stock Incentive Plan, we have a total of 15.3 million authorized shares. At September 30, 2014, 5.0 million shares were available for future grants under our stock-based compensation plans. We generally settle our stock-based awards with treasury shares. As of September 30, 2014, we had 22.9 million treasury shares available for use to settle stock-based awards.

66
The following table sets forth a summary of the annual stock-based compensation cost that was charged against income for all types of awards: Years Ended September 30 2014 2013 2012 Total stock-based compensation cost (pre-tax) ..................................................... $ 18.0 $ 13.5 $ 11.6 Total income tax benefit ....................................................................................... (6.5) (4.9) (4.2)Total stock-based compensation cost, net of tax ................................................... $ 11.5 $ 8.6 $ 7.4
Stock Options Stock options granted by our Compensation Committee under the Stock Incentive Plan are non-qualified stock options. These awards are generally granted with exercise prices equal to the average of the high and low prices of our common stock on the date of grant. They vest in equal annual installments over a three or four year period and the maximum contractual term is ten years. We use a Binomial option-pricing model to estimate the fair value of stock options, and compensation cost is recognized on a straight-line basis over the requisite service period. The following table sets forth the weighted average fair value per share of stock options and the related valuation assumptions used in the determination of those fair values: Years Ended September 30 2014 2013 2012 Weighted average fair value per share ....................................... $11.91 $7.91 $9.79 Valuation assumptions:
Risk-free interest rate .......................................................... 1.3% 0.6% 1.0% Expected dividend yield ..................................................... 1.4% 1.9% 1.4% Expected volatility .............................................................. 36.1% 40.2% 41.2% Weighted average expected life .......................................... 4.9 years 4.9 years 4.8 years
The risk-free interest rate is based upon observed U.S. Treasury interest rates appropriate for the term of our employee stock options. Expected dividend yield is based on the history and our expectation of dividend payouts. For fiscal 2014 and 2013, expected volatility was based on our historical stock price volatility. In fiscal 2012, expected volatility was based on the median of our Peer Group. The change in assumption did not have a material impact on our financial statements. Expected life represents the weighted average period the stock options are expected to remain outstanding and is a derived output of the Binomial model. The expected life of employee stock options is impacted by the above assumptions as well as the post-vesting forfeiture rate and the exercise factor used in the Binomial model. These two variables are based on the history of exercises and forfeitures for previous stock options granted by us.

67
The following table summarizes transactions under our stock option plans for fiscal year 2014: Weighted Weighted Average Weighted Average Aggregate Number of Average Remaining Intrinsic Shares Exercise Contractual Value (1) (in thousands) Price Term (in millions) Balance Outstanding at October 1, 2013 ........................................... 2,163 $ 29.89
Granted ........................................................................................... 367 41.47 Exercised ........................................................................................ (376) 27.85 Cancelled/Forfeited ........................................................................ (162) 35.18
Balance Outstanding at September 30, 2014 ................................. 1,992 $ 31.99 6.9 years $ 18.9
Exercisable at September 30, 2014 ................................................. 1,013 $ 30.12 5.7 years $ 11.5 Options Expected to Vest ................................................................ 897 $ 33.80 8.0 years $ 6.9 (1) The aggregate intrinsic value represents the total pre-tax intrinsic value, based on our closing stock price of $41.43, as
reported by the New York Stock Exchange on September 30, 2014. This amount, which changes continuously based on the fair value of our common stock, would have been received by the option holders had all option holders exercised their options as of the balance sheet date.
The total intrinsic value of options exercised during fiscal years 2014, 2013 and 2012 was $4.6 million, $1.6 million and $1.3 million. As of September 30, 2014, there was $4.7 million of unrecognized compensation expense related to stock options granted under the Plan. This unrecognized compensation expense does not reflect a reduction for our estimate of potential forfeitures, and is expected to be recognized over a weighted average period of 1.9 years. Restricted Stock Units RSUs are granted to certain employees with fair values equal to the average of the high and low prices of our common stock on the date of grant, multiplied by the number of units granted. RSU grants are contingent upon continued employment and vest over periods ranging from one to four years. Dividends, payable in common stock equivalents, accrue on the grants and are subject to the same specified terms as the original grants, including the risk of forfeiture. The following table summarizes transactions for our nonvested RSUs for fiscal year 2014: Weighted Number of Average Share Units Grant Date (in thousands) Fair Value Nonvested RSUs at October 1, 2013 .................................................................. 341 $ 29.34
Granted ............................................................................................................ 263 41.01 Vested ............................................................................................................. (98) 30.39 Forfeited .......................................................................................................... (75) 36.24
Nonvested RSUs at September 30, 2014.......................................................... 431 $ 34.92
As of September 30, 2014, there was $7.5 million of total unrecognized compensation expense related to nonvested RSUs granted under the Stock Incentive Plan. This unrecognized compensation expense does not reflect a reduction for our estimate of potential forfeitures, and is expected to be recognized over a weighted average period of 2 years. The total vest date fair value of shares that vested during fiscal years 2014, 2013 and 2012 was $6.7 million, $5.8 million and $6.8 million.

68
Performance Share Units Our Compensation Committee grants PSUs to certain employees and these awards are subject to any stock dividends, stock splits, and other similar rights inuring to common stock, but unlike our RSUs are not entitled to dividend reinvestment. Vesting of the grants is contingent upon achievement of performance targets and corresponding service requirements. The fair value of the PSUs is equal to the average of the high and low prices of our common stock on the date of grant, multiplied by the number of units granted. For PSUs with a market condition such as total shareholder return, the Monte-Carlo simulation method is used to determine fair value. The Monte-Carlo simulation is a generally accepted statistical technique used to generate a defined number of stock price paths in order to develop a reasonable estimate of the range of our and the Peer Group’s future expected stock prices. The following table sets forth the weighted average fair value per share for PSUs and the related valuation assumptions used in the determination of those fair values. PSUs granted in fiscal 2014 are based on company-specific performance targets, with a total shareholder return collar, while grants in fiscal 2013 are based entirely on total shareholder return targets. Years Ended September 30 2014 2013 Weighted average fair value per share .............................................................. $47.91 $19.77 Valuation assumptions:
Risk-free interest rate ................................................................................. 0.5% 0.3% Expected dividend yield ............................................................................ 0.0% 0.0% Expected volatility ..................................................................................... 30.1% 32.6%
The basis for the assumptions listed above is similar to the valuation assumptions used for stock options, as discussed previously. The following table summarizes transactions for our nonvested PSUs for fiscal 2014: Weighted Number of Average Share Units Grant Date (in thousands) Fair Value Nonvested PSUs as of October 1, 2013 ........................................................................ 574 $ 23.84
Granted .................................................................................................................... 205 47.91 Vested ..................................................................................................................... - - Cancelled................................................................................................................. (122) 31.13 Forfeited .................................................................................................................. (71) 30.08
Nonvested PSUs at September 30, 2014 .................................................................... 586 $ 29.98
As of September 30, 2014, there was $8.6 million of unrecognized compensation expense related to PSUs granted under the Stock Incentive Plan based on the expected achievement of certain performance targets or market conditions. This unrecognized compensation expense does not reflect a reduction for our estimate of potential forfeitures, and is expected to be recognized by the end of fiscal 2016.

69
NOTE 8. SPECIAL CHARGES Over the past several years, we have placed a focus on improving our cost structure and business processes through various means including consolidation of certain manufacturing and select back office operations, customer rationalizations and various other organizational changes. As a result of these actions, we recognized special charges of $37.1 million, $5.7 million, and $18.2 million for the fiscal years ended September 30, 2014, 2013, and 2012, respectively. These charges are summarized below. 2014 Actions
During the second quarter of fiscal 2014, we announced a global restructuring program to improve our cost structure. As part of this program, we offered an early retirement program to certain U.S. employees. Through this program, other reduction in force actions, and the elimination of certain contractor and open positions, we eliminated over 200 net positions primarily in the U.S. This portion of the program resulted in a special charge of $11.0 million related to severance and other benefits to be provided to affected employees. We also recorded a $3.2 million charge related to special pension and postretirement healthcare plan benefits granted to employees eligible for the early retirement program. As discussed in Note 6, the severance and other benefits and postretirement benefit charge balances reflect a $1.3 million reclassification compared to the original charge recorded in the second quarter of 2014. Subsequently during the fiscal year, we reversed $0.7 million of the severance and other benefits accrual due to certain plan participants declining continuing healthcare coverage, as well as other changes in circumstances affecting the estimated future payments to be made. This portion of the restructuring program is substantially complete, but cash expenditures will continue into fiscal year 2015. The global restructuring program is also reducing our European manufacturing capacity and streamlining our global operations by, among other things, executing a back office process transformation program in Europe. The restructuring in Europe is in process and has resulted in year to date severance and benefit charges of $6.8 million. We have also incurred other costs associated with the global restructuring program of $4.6 million related to legal and professional fees, temporary labor, project management, and other administrative functions. We expect to incur $15 million to $20 million of additional restructuring costs related to this action over the next two years.
Also during the second quarter of fiscal 2014, we initiated a plan to discontinue third-party payer rentals of therapy
products occurring primarily in home care settings. We intend to continue renting these products to facilities and customers who are billed directly for the product. Due to this action, we recorded a non-cash impairment charge of $7.7 million for certain tangible assets for which the carrying values could not be fully recovered as a result of this strategic decision. We also eliminated approximately 70 positions and recognized a special charge of $2.0 million related to severance and other benefits for affected employees and $1.8 million in other related costs. Over the remainder of the fiscal year, we reversed $0.2 million of the other related costs as original estimates changed. The exit of this business is substantially complete by the first quarter of fiscal 2015, but certain cash expenditures will extend into fiscal 2015.
During the first quarter of fiscal 2014, we initiated a plan to improve our cost structure and streamline our
organization by offering an early retirement program to certain manufacturing employees in our Batesville, Indiana plant, meeting specific eligibility requirements, and other minor reduction in force actions. These programs resulted in the elimination of approximately 35 positions and required recognition of a special charge of approximately $1 million for lump sum payments under the program and severance and other benefits provided to other affected employees. This action was substantially complete by the end of the second quarter of fiscal 2014.
2013 Actions
During the second quarter of fiscal 2013, we announced a plan to improve our cost structure and streamline our organization by eliminating in excess of 100 positions across the Company, roughly half of which were contract and open positions. This resulted in a special charge of $1.7 million related to severance and other benefits to be provided to affected employees. We also incurred a contract termination charge of $0.6 million, a non-cash asset impairment charge of $0.2 million related to a product discontinuance action and $1.0 million in other related costs. We reversed $0.6 million of a fiscal 2012 severance and other benefits charge that was determined to be excessive during the second quarter of fiscal 2013. During the third and fourth quarters of fiscal 2013, we continued actions under the previously announced plan and incurred charges of $0.8 million and $2.0 million, respectively. These actions and the related cash expenditures are substantially complete.

70
2012 Actions
During the fourth quarter of fiscal 2012, we recorded a non-cash impairment charge of $4.7 million for certain tangible assets for which the carrying values could not be fully recovered as a result of strategic decisions made relative to the exiting of underperforming portions of our home care business. Also associated with this action was the elimination of approximately 100 positions and the related charge of $1.0 million, primarily related to severance and other benefits to be provided to the affected employees. These actions and the related cash expenditures were completed by the end of fiscal year 2013.
During the second quarter of fiscal 2012, we announced a plan to improve our cost structure and streamline our
organization by, among other things, eliminating approximately 200 positions across the Company resulting in a special charge of $9.3 million, net of reversals, recognized throughout fiscal 2012 primarily related to severance and other benefits to be provided to the affected employees. We also recorded an impairment of certain tangible assets for which the carrying values could not be fully recovered as a result of various strategic decisions, which resulted in a non-cash charge of $3.2 million. In addition, we recorded a non-cash impairment charge of $8.0 million related to a previously acquired trade name whose assessment was triggered by strategic changes in how the asset would be utilized on a go-forward basis. These actions and the related cash expenditures were completed by the end of fiscal year 2013.
Severance activity related to these actions during fiscal 2014 was as follows: Beginning Ending Balance Balance September 30, September 30, 2013 Expenses Cash Payments Reversals 2014
Fiscal 2014 Actions ....................................... $ - $ 20.8 $ (8.6) $ (0.7) $ 11.5 Prior Restructuring Actions ........................... 2.9 - (2.6) (0.1) 0.2
Total ........................................................... $ 2.9 $ 20.8 $ (11.2) $ (0.8) $ 11.7

71
NOTE 9. INCOME TAXES The significant components of income before income taxes and the consolidated income tax provision were as follows: Years Ended September 30 2014 2013 2012 Income before income taxes:
Domestic .................................................................................................. $ 87.0 $ 120.0 $ 148.6 Foreign ..................................................................................................... 28.2 24.0 14.9
Total ............................................................................................................ $ 115.2 $ 144.0 $ 163.5
Income tax expense: Current provision
Federal ..................................................................................................... $ 40.2 $ 45.0 $ 65.9 State ......................................................................................................... 3.1 1.8 4.3 Foreign ..................................................................................................... 7.4 7.0 4.8
Total current provision................................................................................ 50.7 53.8 75.0 Deferred provision:
Federal ..................................................................................................... (12.2) (9.9) (29.2)State ......................................................................................................... (1.0) 1.1 0.1 Foreign ..................................................................................................... 17.1 (6.0) (3.2)
Total deferred provision.............................................................................. 3.9 (14.8) (32.3)Income tax expense ..................................................................................... $ 54.6 $ 39.0 $ 42.7
Differences between income tax expense reported for financial reporting purposes and that computed based upon the application of the statutory U.S. Federal tax rate to the reported income before income taxes were as follows: Years Ended September 30 2014 2013 2012 % of % of % of Pretax Pretax Pretax Amount Income Amount Income Amount Income Federal income tax (a) .................. $ 40.3 35.0 $ 50.4 35.0 $ 57.2 35.0 State income tax (b) ...................... 2.0 1.7 2.5 1.7 3.5 2.2 Foreign income tax (c) .................. (7.7) (6.7) (5.7) (4.0) (3.4) (2.1)International tax restructuring ....... - - (0.8) (0.6) (11.0) (6.7)Application of federal tax credits .. (0.6) (0.5) (3.5) (2.4) (0.6) (0.4)Adjustment of estimated income tax accruals ................................... (0.6) (0.5) (1.5) (1.0) (2.1) (1.3)Valuation of tax attributes ............. 21.3 18.5 0.6 0.4 0.3 0.2 Other, net ...................................... (0.1) (0.1) (3.0) (2.0) (1.2) (0.8)Income tax expense ....................... $ 54.6 47.4 $ 39.0 27.1 $ 42.7 26.1
(a) At statutory rate. (b) Net of Federal benefit. (c) Federal tax rate differential.

72
The tax effect of temporary differences that gave rise to the deferred tax balance sheet accounts were as follows: Years Ended September 30 2014 2013 Deferred tax assets:
Employee benefit accruals ...................................................................... $ 49.3 $ 46.6 Inventory ................................................................................................. 13.9 7.4 Reserve for bad debts .............................................................................. 10.0 10.1 Accrued warranty .................................................................................... 7.3 9.7 Net operating loss carryforwards ............................................................ 40.3 38.3 Tax credit carryforwards ......................................................................... 2.5 2.0 Other, net ................................................................................................ 18.4 16.3
141.7 130.4 Less: Valuation allowance ..................................................................... (28.3) (8.9) Total deferred tax assets .................................................................... 113.4 121.5
Deferred tax liabilities:
Depreciation ............................................................................................ (13.9) (32.1) Amortization ........................................................................................... (62.8) (67.5) Other, net ................................................................................................ (4.9) (3.2) Total deferred tax liabilities .................................................................... (81.6) (102.8)
Deferred tax asset - net .............................................................................. $ 31.8 $ 18.7
At September 30, 2014, we had $37.4 million of deferred tax assets related to operating loss carryforwards in foreign jurisdictions that are subject to various carryforward periods with the majority eligible to be carried forward for an unlimited period. Additionally, we had $2.0 million of deferred tax assets related to federal net operating loss carryforwards which will expire in 2033 and $0.9 million of deferred tax assets related to state net operating loss carryforwards, which expire between 2018 and 2026. We had $2.5 million of deferred tax assets related to state tax credits, which expire between 2014 and 2026. The gross deferred tax assets as of September 30, 2014 were reduced by valuation allowances of $28.3 million primarily related to certain foreign deferred tax attributes as it is more likely than not that some portion or all of these tax attributes will not be realized. In evaluating whether it is more likely than not that we would recover our deferred tax assets, future taxable income, the reversal of existing temporary differences and tax planning strategies were considered. We believe that our estimates for the valuation allowances recorded against deferred tax assets are appropriate based on current facts and circumstances. We operate under tax holidays in both Singapore and Puerto Rico. The Singapore tax holiday is effective through 2016 while the Puerto Rico tax holiday is effective through 2025. Both incentives are conditional on meeting certain employment and/or investment thresholds. The impact of these tax holidays decreased foreign taxes by $4.0 million in fiscal 2014, $2.9 million for fiscal 2013 and $1.7 million for fiscal 2012. The benefit of the tax holidays on net income per share (diluted) was $0.07, $0.05 and $0.03 for fiscal 2014, 2013 and 2012, respectively. We file a consolidated federal income tax return as well as multiple state, local and foreign jurisdiction tax returns. In the normal course of business, we are subject to examination by the taxing authorities in each of the jurisdictions where we file tax returns. During fiscal 2014, the Internal Revenue Service (“IRS”) concluded its audit for fiscal year 2012 and initiated its post-filing examination of the fiscal 2013 consolidated federal return. We continue to participate in the IRS Compliance Assurance Program (“CAP”) for fiscal year 2014 and have submitted the application to remain in the CAP for fiscal years 2015 and 2016. The CAP provides the opportunity for the IRS to review certain tax matters prior to us filing our tax return for the year, thereby reducing the time it takes to complete the post-filing examination. We are also subject to state and local or foreign income tax examinations by taxing authorities for years back to fiscal 2008. We also have on-going audits in various stages of completion in several state and foreign jurisdictions, one or more of which may conclude within the next 12 months. Such settlements could involve some or all of the following: the payment of additional taxes, the adjustment of certain deferred taxes and/or the recognition of unrecognized tax benefits. The resolution of these matters, in combination with the expiration of certain statutes of limitations in various jurisdictions, make it reasonably possible that our unrecognized tax benefits may decrease as a result of either payment or recognition by approximately $3 to $4 million in the next twelve months, excluding interest.

73
The total amount of gross unrecognized tax benefits as of September 30, 2014, 2013 and 2012 was $4.1 million, $4.6 million and $9.8 million, which includes $2.7 million, $3.9 million and $8.4 million that, if recognized, would impact the effective tax rate in future periods. The remaining amount relates to items which, if recognized, would not impact our effective tax rate. A reconciliation of the beginning and ending amount of unrecognized tax benefits is as follows: Years Ended September 30 2014 2013 2012 Balance at October 1 .................................................................................... $ 4.6 $ 9.8 $ 17.8 Increases in tax position of prior years ........................................................ 2.1 - 0.5 Decreases in tax position of prior years ....................................................... (0.9) (0.5) (2.7)Increases in tax positions related to the current year ................................... - 0.1 - Settlements with taxing authorities .............................................................. (0.1) (3.2) (3.8)Lapse of applicable statute of limitations .................................................... (1.5) (1.7) (1.9)Foreign currency adjustments ...................................................................... (0.1) 0.1 (0.1)Total change ................................................................................................ (0.5) (5.2) (8.0)Balance at September 30 .............................................................................. $ 4.1 $ 4.6 $ 9.8
We recognize accrued interest and penalties related to unrecognized tax benefits as a component of income tax expense. Accrued interest and penalties, which are not presented in the reconciliation table above, were $0.4 million, $0.6 million and $0.8 million at September 30, 2014, 2013 and 2012. Related to interest and penalties, we recognized an income tax benefit (expense) of $0.2 million in 2014, $0.1 million in 2013 and less than $0.1 million in 2012. NOTE 10. EARNINGS PER COMMON SHARE Basic earnings per share is calculated based upon the weighted average number of outstanding common shares for the period, plus the effect of deferred vested shares. Diluted earnings per share is calculated consistent with the basic earnings per share calculation plus the effect of dilutive unissued common shares related to stock-based employee compensation programs. For all years presented, anti-dilutive stock options were excluded from the calculation of dilutive earnings per share. Excluded shares were 0.3 million, 1.4 million and 1.4 million for fiscal years 2014, 2013 and 2012. Cumulative treasury stock acquired, less cumulative shares reissued, have been excluded in determining the average number of shares outstanding. Earnings per share is calculated as follows: Years Ended September 30 2014 2013 2012 Net income attributable to common shareholders ................................. $ 60.6 $ 105.0 $ 120.8
Average shares outstanding - Basic (thousands) ................................... 57,555 59,910 62,120 Add potential effect of exercise of stock options
and other unvested equity awards (thousands) .............................. 968 340 241 Average shares outstanding - Diluted (thousands)................................ 58,523 60,250 62,361
Net income per common share - Basic ................................................. $ 1.05 $ 1.75 $ 1.94
Net income per common share - Diluted .............................................. $ 1.04 $ 1.74 $ 1.94

74
NOTE 11. SEGMENT REPORTING We disclose segment information that is consistent with the way in which management operates and views the business. Beginning in fiscal 2014, we changed our definition of divisional income within our internal reporting to management to exclude the impacts of acquisition-related intangible asset amortization. As a result, we have changed our segment reporting to reflect the way management views the business. The prior year segment information included below has been updated to reflect these changes. Our operating structure consists of the following three reporting segments:
North America - sells and rents our patient support and near-patient technologies and services, as well as our health information technology solutions, in the U.S. and Canada.
Surgical and Respiratory Care - sells and rents our surgical and respiratory care products globally.
International - sells and rents similar products as our North America segment in regions outside of the U.S. and
Canada. Our performance under each reportable segment is measured on a divisional income basis before non-allocated operating and administrative costs, impairment of other intangibles, litigation, special charges, and acquisition-related intangible asset amortization. Divisional income generally represents the division’s gross profit less its direct operating costs along with an allocation of manufacturing and distribution costs, research and development and certain corporate functional expenses. Non-allocated operating and administrative costs include functional expenses that support the entire organization such as administration, finance, legal and human resources, expenses associated with strategic developments, acquisition-related intangible asset amortization, and other events that are not indicative of operating trends. We exclude such amounts from divisional income to allow management to evaluate and understand divisional operating trends without the effects of such items. Years Ended September 30 2014 2013 2012 Revenue:
North America ................................................................................................... $ 888.9 $ 958.3 $ 998.2 Surgical and Respiratory Care ........................................................................... 301.6 245.8 153.2 International ....................................................................................................... 495.6 512.1 482.9 Total revenue ................................................................................................ $ 1,686.1 $ 1,716.2 $ 1,634.3
Divisional income:
North America ................................................................................................... $ 165.0 $ 201.7 $ 215.4 Surgical and Respiratory Care ........................................................................... 68.6 56.8 43.9 International ....................................................................................................... 24.9 33.5 31.4
Other operating costs:
Non-allocated operating and administrative costs ............................................. 98.8 131.4 99.3 Impairment of other intangibles ......................................................................... - - 8.0 Litigation credit .................................................................................................. - - (3.6)Special charges .................................................................................................. 37.1 5.7 18.2 Operating profit ............................................................................................. 122.6 154.9 168.8
Interest expense .................................................................................................. (9.8) (9.5) (6.5)Investment income and other, net ...................................................................... 2.4 (1.4) 1.2 Income before income taxes ......................................................................... $ 115.2 $ 144.0 $ 163.5

75
Geographic Information Geographic data for net revenue and long-lived assets (which consist mainly of property and equipment leased to others) were as follows: Years Ended September 30 2014 2013 2012 Net revenue to unaffiliated customers: (a)
United States ....................................................................................................... $ 1,070.8 $ 1,116.4 $ 1,077.8 Foreign ................................................................................................................ 615.3 599.8 556.5
Total revenue ......................................................................................................... $ 1,686.1 $ 1,716.2 $ 1,634.3
Long-lived assets: (b) United States ....................................................................................................... $ 151.7 $ 158.0 $ 172.5 Foreign ................................................................................................................ 109.8 76.3 77.6
Total long-lived assets ........................................................................................... $ 261.5 $ 234.3 $ 250.1
(a) Net revenue is attributed to geographic areas based on the location of the customer. (b) Includes property and equipment leased to others. NOTE 12. QUARTERLY FINANCIAL INFORMATION (UNAUDITED) The following table presents selected consolidated financial data by quarter for each of the last two fiscal years.
2014 Quarter Ended December 31,
2013 March 31,
2014 June 30,
2014 September 30,
2014 Net revenue .................................................................................. $ 393.4 $ 415.3 $ 397.6 $ 479.8 Gross profit .................................................................................. $ 176.8 $ 202.7 $ 187.1 $ 213.3 Net income (loss) ......................................................................... $ 13.2 $ (3.3) $ 26.1 $ 24.6 Basic net income (loss) per common share .................................. $ 0.23 $ (0.06) $ 0.46 $ 0.43 Diluted net income (loss) per common share ............................... $ 0.22 $ (0.06) $ 0.45 $ 0.42
2013 Quarter Ended December 31,
2012 March 31,
2013 June 30,
2013 September 30,
2013 Net revenue ................................................................................... $ 428.4 $ 425.7 $ 424.2 $ 437.9 Gross profit ................................................................................... $ 191.4 $ 196.1 $ 190.1 $ 202.7 Net income .................................................................................... $ 24.0 $ 22.3 $ 23.4 $ 35.3 Basic net income per common share ............................................ $ 0.39 $ 0.37 $ 0.39 $ 0.60 Diluted net income per common share ......................................... $ 0.39 $ 0.37 $ 0.39 $ 0.59

76
NOTE 13. COMMITMENTS AND CONTINGENCIES Lease Commitments Rental expense for fiscal years 2014, 2013 and 2012 was $24.7 million, $21.5 million and $20.7 million. The table below indicates the minimum annual rental commitments (excluding renewable periods) aggregating $62.9 million, for manufacturing facilities, warehouse distribution centers, service centers and sales offices, under non-cancelable operating leases. Amount2015 ....................................................... $ 22.52016 ....................................................... $ 16.62017 ....................................................... $ 12.52018 ....................................................... $ 6.92019 ....................................................... $ 1.72020 and beyond .................................... $ 2.7 Self Insurance We are also involved in other possible claims, including product and general liability, workers’ compensation, auto liability and employment related matters. Such claims in the United States have deductibles and self-insured retentions ranging from $25 thousand to $1.0 million per occurrence or per claim, depending upon the type of coverage and policy period. International deductibles and self-insured retentions are lower. We are also generally self-insured up to certain stop-loss limits for certain employee health benefits, including medical, drug and dental. Our policy is to estimate reserves based upon a number of factors including known claims, estimated incurred but not reported claims and outside actuarial analysis, which are based on historical information along with certain assumptions about future events. Such estimated reserves are classified as Other Current Liabilities and Other Long-Term Liabilities within the Consolidated Balance Sheets. Legal Proceedings Stryker Litigation On April 4, 2011, we filed two separate actions against Stryker Corporation alleging infringement of certain Hill-Rom patents covering proprietary communications networks, status information systems and powered wheels used in our beds or stretchers. Both suits sought monetary damages and injunctions against Stryker for selling or distributing any beds, stretchers or ancillary products that infringe Hill-Rom’s patents. On August 14, 2012, we entered into a confidential favorable settlement agreement with Stryker Corporation to resolve our lawsuit regarding claims about our powered wheel patents. No trial date for the remaining lawsuit has been set. Because the litigation is in a preliminary stage, we cannot assess the likelihood of a positive or negative outcome or determine an estimate, or a range of estimates, of potential damages, nor can we give any assurances that this matter will not have a material adverse impact on our financial condition, results of operations or cash flows. General We are subject to various other claims and contingencies arising out of the normal course of business, including those relating to governmental investigations and proceedings, commercial transactions, product liability, employee related matters, antitrust, safety, health, taxes, environmental and other matters. Litigation is subject to many uncertainties and the outcome of individual litigated matters is not predictable with assurance. It is possible that some litigation matters for which reserves have not been established could be decided unfavorably to us, and that any such unfavorable decisions could have a material adverse effect on our financial condition, results of operations and cash flows.

77
Item 9. CHANGES IN AND DISAGREEMENTS WITH ACCOUNTANTS ON ACCOUNTING AND FINANCIAL DISCLOSURE
None. Item 9A. CONTROLS AND PROCEDURES Evaluation of Disclosure Controls and Procedures Our management, with the supervision and participation of our President and Chief Executive Officer and our Treasurer and Interim Chief Financial Officer (the “Certifying Officers”), has evaluated the effectiveness of the design and operation of our disclosure controls and procedures as of September 30, 2014. Our disclosure controls and procedures are designed to ensure that information required to be disclosed in the reports we file or submit under the Securities Exchange Act of 1934, as amended, is recorded, processed, summarized and reported, within the time periods specified in the SEC’s rules and forms and such information is accumulated and communicated to management, including our Certifying Officers and our Board of Directors, as appropriate to allow timely decisions regarding required disclosure. Based upon that evaluation, the Certifying Officers concluded that our disclosure controls and procedures were effective as of September 30, 2014. Management’s Report on Internal Control Over Financial Reporting The report of management’s assessment of the effectiveness of our internal control over financial reporting as of September 30, 2014 and the related report of our independent registered public accounting firm, are included under Part II, Item 8 of this Form 10-K. Changes in Internal Control Over Financial Reporting As described in the following paragraphs, there were changes in our internal control over financial reporting during the quarter ended September 30, 2014 that have materially affected, or are reasonably likely to materially affect, our internal control over financial reporting. We have excluded Trumpf from our assessment of internal control over financial reporting as of September 30, 2014, because Trumpf was acquired by us in a purchase business combination in the fourth quarter of 2014. Trumpf is a wholly-owned subsidiary whose total assets and total revenue represent 11 percent and 2 percent, respectively, of the related consolidated financial statement amounts as of and for the year ended September 30, 2014. We are currently in the process of evaluating and integrating Trumpf’s historical internal control over financial reporting structure with ours. We expect to complete this integration in fiscal 2015. Additionally, during the fourth quarter of fiscal 2014, we implemented a new financial reporting consolidation system. In connection with the implementation of this system, we also implemented a series of internal controls regarding the reliability of our financial reporting and the preparation of consolidated financial statements. These new controls were included in management’s evaluation process for the year ended September 30, 2014. Other than the changes noted above, there have been no other changes to our internal controls over financial reporting. Management’s report on our internal control over financial reporting is included under Item 8 above. Item 9B. OTHER INFORMATION None.

78
PART III Item 10. DIRECTORS, EXECUTIVE OFFICERS AND CORPORATE GOVERNANCE The information required by this Item is incorporated herein by reference to our Proxy Statement to be filed with the SEC in January 2015 relating to our 2015 Annual Meeting of Shareholders (the “2015 Proxy Statement”), under the headings “Election of Directors”, “Section 16(a) Beneficial Ownership Reporting Compliance”, and “Corporate Governance.” Information relating to our executive officers is included in this report in Part I, Item 1 under the caption “Executive Officers of the Registrant.” Item 11. EXECUTIVE COMPENSATION The information required by this Item is incorporated herein by reference to the 2015 Proxy Statement, under the heading “Executive Compensation.” Item 12. SECURITY OWNERSHIP OF CERTAIN BENEFICIAL OWNERS AND MANAGEMENT AND
RELATED STOCKHOLDER MATTERS The information required by this Item is incorporated herein by reference to the 2015 Proxy Statement, under the headings “Security Ownership of Certain Beneficial Owners and Management” and “Equity Compensation Plan Information.” Item 13. CERTAIN RELATIONSHIPS AND RELATED TRANSACTIONS AND DIRECTOR
INDEPENDENCE The information required by this Item is incorporated herein by reference to the 2015 Proxy Statement, where such information is included under the heading “Corporate Governance.” Item 14. PRINCIPAL ACCOUNTING FEES AND SERVICES The information required by this Item is incorporated herein by reference to the 2015 Proxy Statement, where such information is included under the heading “Proposals Requiring Your Vote - Ratification of Appointment of Independent Registered Public Accounting Firm.”
79
PART IV Item 15. EXHIBITS AND FINANCIAL STATEMENT SCHEDULES (a) The following documents have been filed as a part of this Form 10-K or, where noted, incorporated by reference:
(1) Financial Statements
The financial statements of the Company and its consolidated subsidiaries are listed under Part II, Item 8 on the Index to Consolidated Financial Statements on page 39.
(2) Financial Statement Schedules
The financial statement schedule filed in response to Part II, Item 8 and Part IV, Item 15(c) of Form 10-K is listed under Part II, Item 8 on the Index to Consolidated Financial Statements on page 39.
(3) Exhibits (See changes to Exhibit Index below):
“The Exhibit Index, which follows the signature page to this Form 10-K and is hereby incorporated herein by reference, sets forth a list of those exhibits filed herewith, and includes and identifies management contracts or compensatory plans or arrangements required to be filed as exhibits to this Form 10-K by Item 601 (b)(10)(iii) of Regulation S-K.”
The agreements included as exhibits to this Form 10-K are intended to provide information regarding their terms and not to provide any other factual or disclosure information about us or the other parties to the agreements. The agreements may contain representations and warranties by the parties to the agreements, including us, solely for the benefit of the other parties to the applicable agreement. Such representation and warranties:
should not in all instances be treated as categorical statements of fact, but rather as a way of allocating the
risk to one of the parties if those statements prove to be inaccurate; may have been qualified by disclosures that were made to the other party in connection with the negotiation
of the applicable agreement, which disclosures are not necessarily reflected in the agreement; may apply standards of materiality in a way that is different from what may be viewed as material to certain
investors; and were made only as of the date of the applicable agreement or such other date or dates as may be specified in
the agreement and are subject to more recent developments.
Accordingly, these representations and warranties may not describe the actual state of affairs as of the date they were made or at any other time.

80
SCHEDULE II HILL-ROM HOLDINGS, INC. AND SUBSIDIARIES
Valuation and Qualifying Accounts
For The Fiscal Years Ended September 30, 2014, 2013 and 2012
(Dollars in millions)
ADDITIONS BALANCE AT CHARGED TO CHARGED TO DEDUCTIONS BALANCE BEGINNING COSTS AND OTHER NET OF AT END DESCRIPTION OF PERIOD EXPENSES ACCOUNTS RECOVERIES OF PERIOD Reserves deducted from assets to which they apply:
Allowance for possible losses and sales returns - accounts receivable:
Period Ended: September 30, 2014 ........... $ 30.1 $ 1.5 $ 8.6 (a) $ (8.8) (b) $ 31.4
September 30, 2013 ............. $ 38.5 $ 2.7 $ (0.1)(a) $ (11.0) (b) $ 30.1
September 30, 2012 ............. $ 26.7 $ 1.6 $ 18.5 (a) $ (8.3) (b) $ 38.5
Allowance for inventory valuation:
Period Ended: September 30, 2014 ........... $ 22.0 $ 4.0 $ 19.8 (c) $ (2.9) (d) $ 42.9
September 30, 2013 ............. $ 22.0 $ 1.8 $ - (c) $ (1.8) (d) $ 22.0
September 30, 2012 ............. $ 22.9 $ 2.2 $ 1.6 (c) $ (4.7) (d) $ 22.0
Valuation allowance against deferred tax assets:
Period Ended: September 30, 2014 ........... $ 8.9 $ 21.3 $ - $ (1.9) (e) $ 28.3
September 30, 2013 ............. $ 8.6 $ 0.6 $ - $ (0.3) (e) $ 8.9
September 30, 2012 ............. $ 8.1 $ 0.4 $ - $ 0.1 (e) $ 8.6
(a) Reduction of gross revenue for uncollectible health care rental reimbursements, cash discounts and other adjustments in
determining net revenue. Also includes the effect of acquired businesses, if any. (b) Generally reflects the write-off of specific receivables against recorded reserves. (c) Generally reflects the effect of acquired businesses, if any. (d) Generally reflects the write-off of specific inventory against recorded reserves. (e) Primarily reflects write-offs of deferred tax assets against the valuation allowance and other movement of the valuation
allowance offset by an opposing change in deferred tax assets.

81
SIGNATURES Pursuant to the requirements of Section 13 or 15(d) of the Securities Exchange Act of 1934, the registrant has duly caused this report to be signed on its behalf by the undersigned, thereunto duly authorized. HILL-ROM HOLDINGS, INC. By:/s/ John J. Greisch John J. Greisch President and Chief Executive Officer Date: November 19, 2014 Pursuant to the requirements of the Securities Exchange Act of 1934, this report has been signed below by the following persons on behalf of the registrant and in the capacities and on the date indicated. /s/ Rolf A. Classon /s/ William G. Dempsey
Rolf A. Classon Chairman of the Board
William G. Dempsey Director
/s/ John J. Greisch /s/ James R. Giertz
John J. Greisch President and Chief Executive Officer and Director (Principal Executive Officer)
James R. Giertz Director
/s/ Michael S. Macek /s/ Charles E. Golden
Michael S. Macek Vice President, Treasurer, and Interim Chief Financial Officer (Principal Financial Officer)
Charles E. Golden Director
/s/ Richard G. Keller /s/ William H. Kucheman Richard G. Keller Vice President — Controller and Chief Accounting Officer (Principal Accounting Officer)
William H. Kucheman Director
/s/ Joanne C. Smith, M.D. /s/ Ronald A. Malone Joanne C. Smith, M.D. Director
Ronald A. Malone Director
/s/ Eduardo R. Menascé
Eduardo R. Menascé Director
Date: November 19, 2014
82
HILL-ROM HOLDINGS, INC.
INDEX TO EXHIBITS Management contracts and compensatory plans or arrangements are designated with “*”. 2.1 Share Purchase and Transfer Agreement dated as of June 13, 2014 by and among TRUMPF International
Beteiligungs-GmbH, Hill-Rom Holdings Netherlands B.V., HR Europe B.V. and Hill-Rom Holdings, Inc. (Incorporated herein by reference to Exhibit 1.1 filed with Form 8-K dated June 16, 2014)
2.2 Stock Purchase Agreement dated as of July 23, 2012 between Roundtable Healthcare Partners II, L.P. and Hill-Rom
Inc. regarding the purchase of Aspen Surgical Products Holding, Inc. (Incorporated herein by reference to Exhibit 2.1 filed with Form 8-K dated July 26, 2012)
3.1 Restated and Amended Articles of Incorporation of Hill-Rom Holdings, Inc., as currently in effect (Incorporated
herein by reference to Exhibit 3.1 filed with Form 8-K dated March 10, 2010) 3.2 Amended and Restated Code of By-Laws of Hill-Rom Holdings, Inc., as currently in effect (Incorporated herein by
reference to Exhibit 3.2 filed with Form 8-K dated March 10, 2010) 4.1 Indenture dated as of December 1, 1991, between Hill-Rom Holdings, Inc. and Union Bank, N.A. (as successor to
LaSalle Bank National Association and Harris Trust and Savings Bank) as Trustee (Incorporated herein by referenceto Exhibit (4) (a) to Registration Statement on Form S-3, Registration No. 33-44086)
*10.1 Hill-Rom Holdings, Inc. Amended and Restated Short Term Incentive Compensation Program (Incorporated herein
by reference to Exhibit 10.1 filed with Form 10-K dated November 24, 2009) *10.2 Form of Director Indemnity Agreement (Incorporated herein by reference to Exhibit 10.6 filed with Form 10-K
dated December 23, 2003) *10.3 Form of Indemnity Agreement between Hill-Rom Holdings, Inc. and certain executive officers (Incorporated herein
by reference to Exhibit 10.6 filed with Form 10-K dated November 16, 2011) *10.4 Hill-Rom Holdings, Inc. Board of Directors’ Deferred Compensation Plan (Incorporated herein by reference to
Exhibit 10.10 filed with Form 10-Q dated July 13, 2001) *10.5 Hill-Rom Holdings, Inc. Director Phantom Stock Plan and form of award (Incorporated herein by reference to
Exhibit 10.11 filed with Form 10-Q dated July 13, 2001) *10.6 Form of Non-Qualified Stock Option Agreement under Amended and Restated Hill-Rom Holdings, Inc. Stock
Incentive Plan (Incorporated herein by reference to Exhibit 10.11 filed with Form 10-K dated November 16, 2011) *10.7 Form of Non-Qualified Stock Option Agreement (CEO version) under Amended and Restated Hill-Rom Holdings,
Inc. Stock Incentive Plan (Incorporated herein by reference to Exhibit 10.12 filed with Form 10-K dated November 16, 2011)
*10.8 Amended and Restated Hill-Rom Holdings, Inc. Stock Incentive Plan, as currently in effect (Incorporated herein by
reference to Exhibit 10.30 filed with Form 10-K dated November 24, 2009) *10.9 Employment Agreement dated as of March 31, 2008 between Hill-Rom Company, Inc. and Richard G. Keller
(Incorporated herein by reference to Exhibit 10.12 filed with Form 10-Q dated May 14, 2008) *10.10 Hill-Rom Holdings, Inc. Employee Stock Purchase Plan (Incorporated by reference to Appendix I to the Company’s
definitive Proxy Statement on Schedule 14A dated January 7, 2009)

83
*10.11 Employment Agreement dated January 6, 2010 between Hill-Rom Holdings, Inc. and John J. Greisch (Incorporated herein by reference to Exhibit 10.1 filed with Form 8-K dated January 7, 2010)
*10.12 Employment Agreement between Hill-Rom Holdings, Inc. and Susan R. Lichtenstein dated May 10, 2010
(Incorporated herein by reference to Exhibit 10.7 filed with Form 10-Q dated May 6, 2010) *10.13 Form of Change in Control Agreement between Hill-Rom Holdings, Inc. and certain of its officers, including
Named Executive Officers (other than the CEO) (Incorporated by reference to Exhibit 10.58 filed with the Company’s Form 10-K dated November 17, 2010)
*10.14 Amended Change in Control Agreement between Hill-Rom Holdings, Inc. and John J. Greisch dated September 30,
2010 (Incorporated by reference to Exhibit 10.59 filed with the Company’s Form 10-K dated November 17, 2010) *10.15 2014 Non-Employee Director Compensation Policy *10.16 Form of Restricted Stock Unit Agreement under Amended and Restated Hill-Rom Holdings, Inc. Stock Incentive
Plan (Incorporated by reference to Exhibit 10.63 filed with the Company’s Form 10-K dated November 17, 2010) *10.17 Form of Restricted Stock Unit Agreement (CEO version) under Amended and Restated Hill-Rom Holdings, Inc.
Stock Incentive Plan (Incorporated by reference to Exhibit 10.65 filed with the Company’s Form 10-K dated November 17, 2010)
*10.18 FY 2011 Form of Performance Based Stock Award under the Stock Incentive Plan (Incorporated by reference to
Exhibit 10.61 filed with the Company’s Form 10-K dated November 16, 2011) *10.19 FY 2011 Form of Performance Based Stock Award under the Stock Incentive Plan (CEO version) (Incorporated by
reference to Exhibit 10.62 filed with the Company’s Form 10-K dated November 16, 2011) *10.20 Hill-Rom Holdings, Inc. Short-Term Incentive Plan (Incorporated by reference to Appendix 1 to the Hill-Rom
Holdings, Inc. Definitive Proxy Statement on Schedule 14A dated January 18, 2011) *10.21 Hill-Rom Holdings, Inc. Amended and Restated Supplemental Executive Retirement Plan (Incorporated by
reference to Exhibit 10.69 filed with the Company’s Form 10-K dated November 16, 2011) *10.22 Employment Agreement between Hill-Rom Holdings, Inc. and Alton Shader, dated July 11, 2011 (Incorporated by
reference to Exhibit 10.2 filed with the Company’s Form 10-Q dated July 28, 2011) *10.23 Employment Agreement between Hill-Rom Holdings, Inc. and Andreas Frank, dated October 3, 2011 (Incorporated
by reference to Exhibit 10.72 filed with the Company’s Form 10-K dated November 16, 2011) *10.24 Employment Agreement between Hill-Rom Services, Inc. and Michael Macek, dated February 26, 2011
(Incorporated by reference to Exhibit 10.1 filed with the Company’s Form 8-K dated July 17, 2013) 10.25 Credit Agreement dated as of August 24, 2012 among Hill-Rom Holdings, Inc., the lenders named therein, and
JPMorgan Chase Bank N.A. as agent for the lenders (Incorporated herein by reference to Exhibit 10.1 to the Form 8-K dated August 24, 2012)
*10.26 Form of Limited Recapture Agreement between Hill-Rom Holdings, Inc. and certain of its officers, including
Named Executive Officers (Incorporated by reference to Exhibit 10.34 filed with the Company’s Form 10-K dated November 20, 2013)
*10.27 Employment Agreement between HR Europe B.V. and Michiel de Zwaan, dated September 5, 2011 21 Subsidiaries of the Registrant 23 Consent of Independent Registered Public Accounting Firm

84
31.1 Certification of Chief Executive Officer Pursuant to Section 302 of the Sarbanes-Oxley Act of 2002 31.2 Certification of Chief Financial Officer Pursuant to Section 302 of the Sarbanes-Oxley Act of 2002 32.1 Certification of Chief Executive Officer Pursuant to 18 U.S.C. Section 1350, as Adopted Pursuant to Section 906 of
the Sarbanes-Oxley Act of 2002 32.2 Certification of Chief Financial Officer Pursuant to 18 U.S.C. Section 1350, as Adopted Pursuant to Section 906 of
the Sarbanes-Oxley Act of 2002 101.INS XBRL Instance Document 101.SCH XBRL Taxonomy Extension Schema Document 101.CAL XBRL Taxonomy Extension Calculation Linkbase Document 101.DEF XBRL Taxonomy Extension Definition Linkbase Document 101.LAB XBRL Extension Labels Linkbase Document 101.PRE XBRL Taxonomy Extension Presentation Linkbase Document

EXHIBIT 10.15
Hill-Rom Holdings, Inc. FY 2014 Non-Employee Director Compensation Policy Non-employee directors, other than the Chairman of the Board, shall each receive an annual cash retainer of $55,000
for their service as directors and shall not receive meeting fees for attendance at Board meetings; the Chairman of the Board shall receive an annual cash retainer of $110,000 for service as Chairman of the Board.
Each non-employee director, other than the Chairpersons of each committee, who is a member of the Audit,
Compensation and Management Development Committee or Nominating/Corporate Governance, shall receive a $12,500, $7,500 and $5,000 annual retainer, respectively. Notwithstanding the foregoing, for any meeting of an ad hoc Committee of the Board that requires attendance in person or by telephone, the non-employee directors who attend, shall each receive a meeting fee of $1,500.
The Chairpersons of each of the Audit, Compensation and Management Development and Nominating/Corporate
Governance Committees shall receive a $25,000, $20,000 and $15,000 annual retainer, respectively. Non-employee directors who attend meetings of Committees of which they are not members shall receive no fees for
their attendance. Board and Committee retainers shall be paid in quarterly installments (with such quarterly installments to be paid on
the first day of each quarter). Each non-employee director shall be reimbursed for expenses incurred as a result of attendance at Board or Committee
meetings. Each non-employee director shall be awarded, on the first trading day following the close of each annual meeting of
the Company’s shareholders, restricted stock units (otherwise known as deferred stock awards) valued at $150,000 on the date of grant under the Corporation’s Stock Incentive Plan; provided that the Chairman of the Board’s annual grant of deferred stock awards shall be valued at $190,000. Each deferred stock award granted to any non-employee director shall be for a number of shares of Common Stock determined by dividing (i) the indicated dollar amount by (ii) the average high and low prices of the Common Stock on the date of grant. Vesting for all such restricted stock units will occur on the later to occur of one year and one day from the date of the grant or the six month anniversary of the date that the applicable director ceases to be a member of the Board.

EXHIBIT 21
HILL-ROM HOLDINGS, INC. SUBSIDIARIES OF THE REGISTRANT
All subsidiaries of the Company as of November 19, 2014 are wholly-owned Indiana corporations, unless otherwise noted. Subsidiaries of Hill-Rom Holdings, Inc.
Hill-Rom, Inc. Eagle Acquisition Sub B.V, a Netherlands corporation Huntersville Insurance Company, Inc., a Utah corporation
Subsidiaries of Hill-Rom, Inc.
Advanced Respiratory, Inc., a Minnesota corporation Allen Medical Systems, Inc. Hill-Rom Services, Inc. Aspen Surgical Products Holding, Inc., a Delaware corporation Hill-Rom DTC, Inc. Trumpf Medical Systems, Inc.
Subsidiary of Allen Medical Systems, Inc.
AMATECH Corporation Subsidiary of Aspen Surgical Products Holding, Inc.
Aspen Surgical Products, Inc., a Michigan corporation Subsidiary of Aspen Surgical Products, Inc.
Aspen Surgical Puerto Rico Corp., a Puerto Rico corporation Jointly owned subsidiary of Hill-Rom, Inc. and Advanced Respiratory, Inc.
Hill-Rom Company, Inc. Subsidiaries of Hill-Rom Company, Inc.
Hill-Rom International, Inc. MEDIQ/PRN Life Support Systems, LLC Hill-Rom Logistics, LLC
Subsidiary of Hill-Rom Services, Inc.
Hill-Rom Manufacturing, Inc. Subsidiary of Hill-Rom Manufacturing, Inc.
Hill-Rom Finance Limited Partner, Inc. Subsidiaries of Hill-Rom International, Inc.
Hill-Rom Pty, Ltd, an Australian corporation Hill-Rom Asia Limited, a Hong-Kong corporation Hill-Rom Japan KK, a Japanese corporation
Subsidiary of Hill-Rom Asia Limited
Hill-Rom Business Services Co., Ltd, a Chinese corporation Hill-Rom Shanghai Ltd., a Chinese corporation
Jointly owned subsidiary of Hill-Rom Finance Limited Partner, Inc., Hill-Rom, Inc. and Aspen Surgical Products, Inc.
Hill-Rom EU C.V., a Netherlands partnership Subsidiary of Hill-Rom EU C.V
Hill-Rom (Gibraltar) General Partner Limited, a Gibraltar limited partnership

Subsidiary of Hill-Rom (Gibraltar) General Partner Limited Hill-Rom Holding (Gibraltar) Limited, a Gibraltar limited partnership
Jointly owned subsidiary of Hill-Rom Holding (Gibraltar) Limited and Hill-Rom (Gibraltar) General Partner Limited
HR Finance C.V., a Netherlands partnership Subsidiary of Hill-Rom Holdings (Gibraltar) Limited
Hill-Rom International S.á r.l./B.V., a Luxembourg corporation Subsidiaries of HR Finance C.V.
HR Europe B.V. a Netherlands corporation Hill-Rom Global Holdings, B.V., a Netherlands corporation Hill-Rom Receivables, LLC, a Delaware limited liability company
Subsidiaries of Hill-Rom Global Holdings, B.V.
Hill-Rom Holdings Netherlands, B.V., a Netherlands corporation Hill-Rom Singapore Holdings S.á r.l., a Luxembourg corporation
Joint owned subsidiary of Hill-Rom Global Holdings B.V. and Hill-Rom International S.á r.l./B.V.
Hill-Rom SPRL, a Belgium corporation Jointly owned subsidiary of Hill-Rom Holdings Netherlands, B.V. and Hill-Rom Holdings (Gibraltar) Limited
Hill-Rom HB, a Swedish partnership Subsidiary of Hill-Rom Singapore Holdings S.á r.l.
Hill-Rom Services Pte, Ltd., a Singapore corporation Subsidiaries of Hill-Rom Holdings Netherlands, B.V.,
Hill-Rom UK (Holdings) Ltd., a United Kingdom corporation Trumpf Medizin Systeme Beteiligungs GmbH, a German corporation
Subsidiary of Trumpf Medizin Systeme Beteiligungs GmbH
Trumpf Medizin Systeme GmbH & Co KG, a German partnership Subsidiaries of Trumpf Medizin Systeme GmbH & Co KG
Trumpf Medical Systems Ltd. (UK), a United Kingdom corporation Trumpf Medical Systems (Taicang) Co., Limited, a Chinese corporation Trumpf Med (Aust) Pty Limited, an Australian corporation Videomed S.r.l., an Italian corporation
Subsidiaries of Hill-Rom UK (Holdings) Ltd.
Aspen Medical Europe Limited (UK), a United Kingdom corporation Hill-Rom Ltd., a United Kingdom corporation
Subsidiary of Hill-Rom Ltd.
Hill-Rom (UK), Ltd., a United Kingdom corporation Subsidiaries of Hill-Rom International S.á r.l./B.V.
Hill-Rom B.V., a Netherlands corporation Hill-Rom S.A., a Switzerland corporation Hill-Rom Austria GmbH, an Austrian corporation Hill-Rom Sociedade Unipessoal, LDA a Portuguese corporation Hill-Rom Poland sp. z o.o., a Polish corporation Hill-Rom Canada, Ltd., a Canadian Corporation Hill-Rom SARL, a French corporation

Jointly owned subsidiaries of Hill-Rom International S.á r.l./B.V. and Hill-Rom Services, Inc. Hill-Rom India Private Ltd., an Indian corporation Hill-Rom Rus, LLC, a Russian entity Hill-Rom de Mexico S de RL de CV, a Mexican corporation Hill-Rom Servicios S de RL de CV, a Mexican corporation Hill-Rom Comercializador a de Mexico S de RL de CV, a Mexican corporation Hill-Rom Importacao e Comercio de Equipamentos Medicos Ltda, a Brazilian corporation Hill-Rom Turkey Medikal Urunler Dagitim ve Ticaret Limited Sirketi, a Turkish corporation
Subsidiary of Hill-Rom Austria GmbH
Trumpf Medizinsystems Osterreich GmbH, an Austrian corporation Subsidiaries of Hill-Rom SARL
Hill-Rom Industries SA, a French corporation Hill-Rom, S.p.A, an Italian corporation Hill-Rom SAS, a French corporation SCI Le Couviour Immoblier, a French corporation Hill-Rom Iberia S.L., a Spanish corporation Hill-Rom AB, a Swedish corporation Trumpf Systemes Medicaux SAS, a French corporation
Jointly owned subsidiary of Hill-Rom SARL and Hill-Rom SAS
Hill-Rom sro, a Czech Republic corporation Subsidiaries of Hill-Rom AB
Liko R&D AB, a Swedish corporation Liko AB, a Swedish corporation Hill-Rom Norway, a Norwegian corporation
Subsidiary of Liko AB
Völker Verwaltung GmbH, a German corporation Jointly owned subsidiary of Liko AB and Eagle Acquisition Sub B.V.
Völker Holdings GmbH & Co KG, a German partnership Subsidiaries of Völker Holdings GmbH & Co KG
Völker GmbH, a German corporation Hill-Rom GmbH, a German corporation
Subsidiary of Völker GmbH
Völker BVBA, a Belgian corporation
EXHIBIT 23
Consent of Independent Registered Public Accounting Firm We hereby consent to the incorporation by reference in the Registration Statement on Form S-8 (Nos. 333-157341, 333-157338, 333-88354, 333-49669, and 333-88328) of Hill-Rom Holdings, Inc. of our report dated November 19, 2014, relating to the financial statements, financial statement schedule and the effectiveness of internal control over financial reporting, which appears in this Form 10-K. /s/ PricewaterhouseCoopers LLP PricewaterhouseCoopers LLP Indianapolis, Indiana November 19, 2014

EXHIBIT 31.1
CERTIFICATIONS
Certification of Chief Executive Officer Pursuant to Section 302 of the Sarbanes-Oxley Act of 2002 I, John J. Greisch, certify that: 1. I have reviewed this Annual Report on Form 10-K of Hill-Rom Holdings, Inc.; 2. Based on my knowledge, this report does not contain any untrue statement of a material fact or omit to state a material
fact necessary to make the statements made, in light of the circumstances under which such statements were made, not misleading with respect to the periods covered by this report;
3. Based on my knowledge, the financial statements, and other financial information included in this report, fairly present
in all material respects the financial condition, results of operations and cash flows of the registrant as of, and for, the periods presented in this report;
4. The registrant’s other certifying officer and I are responsible for establishing and maintaining disclosure controls and
procedures (as defined in Exchange Act Rules 13a-15(e) and 15d-15(e)) and internal control over financial reporting (as defined in Exchange Act Rules 13a-15(f) and 15d-15(f)) for the registrant and have:
a) designed such disclosure controls and procedures, or caused such disclosure controls and procedures to be designed
under our supervision, to ensure that material information relating to the registrant, including its consolidated subsidiaries, is made known to us by others within those entities, particularly during the period in which this report is being prepared;
b) designed such internal control over financial reporting, or caused such internal control over financial reporting to be
designed under our supervision, to provide reasonable assurance regarding the reliability of financial reporting and the preparation of financial statements for external purposes in accordance with generally accepted accounting principles;
c) evaluated the effectiveness of the registrant’s disclosure controls and procedures and presented in this report our
conclusions about the effectiveness of the disclosure controls and procedures, as of the end of the period covered by this report based on such evaluation; and
d) disclosed in this report any change in the registrant’s internal control over financial reporting that occurred during
the registrant’s fourth fiscal quarter that has materially affected, or is reasonably likely to materially affect, the registrant’s internal control over financial reporting; and
5. The registrant’s other certifying officer and I have disclosed, based on our most recent evaluation of internal control over
financial reporting, to the registrant’s auditors and the audit committee of the registrant’s Board of Directors (or persons performing the equivalent functions):
a) all significant deficiencies and material weaknesses in the design or operation of internal control over financial
reporting which are reasonably likely to adversely affect the registrant’s ability to record, process, summarize and report financial information; and
b) any fraud, whether or not material, that involves management or other employees who have a significant role in the
registrant’s internal control over financial reporting. Date: November 19, 2014 /s/ John J. Greisch John J. Greisch President and Chief Executive Officer

EXHIBIT 31.2
CERTIFICATIONS
Certification of Chief Financial Officer Pursuant to Section 302 of the Sarbanes-Oxley Act of 2002 I, Michael S. Macek, certify that: 1. I have reviewed this Annual Report on Form 10-K of Hill-Rom Holdings, Inc.; 2. Based on my knowledge, this report does not contain any untrue statement of a material fact or omit to state a material
fact necessary to make the statements made, in light of the circumstances under which such statements were made, not misleading with respect to the periods covered by this report;
3. Based on my knowledge, the financial statements, and other financial information included in this report, fairly present
in all material respects the financial condition, results of operations and cash flows of the registrant as of, and for, the periods presented in this report;
4. The registrant’s other certifying officer and I are responsible for establishing and maintaining disclosure controls and
procedures (as defined in Exchange Act Rules 13a-15(e) and 15d-15(e)) and internal control over financial reporting (as defined in Exchange Act Rules 13a-15(f) and 15d-15(f)) for the registrant and have:
a) designed such disclosure controls and procedures, or caused such disclosure controls and procedures to be designed
under our supervision, to ensure that material information relating to the registrant, including its consolidated subsidiaries, is made known to us by others within those entities, particularly during the period in which this report is being prepared;
b) designed such internal control over financial reporting, or caused such internal control over financial reporting to be
designed under our supervision, to provide reasonable assurance regarding the reliability of financial reporting and the preparation of financial statements for external purposes in accordance with generally accepted accounting principles;
c) evaluated the effectiveness of the registrant’s disclosure controls and procedures and presented in this report our
conclusions about the effectiveness of the disclosure controls and procedures, as of the end of the period covered by this report based on such evaluation; and
d) disclosed in this report any change in the registrant’s internal control over financial reporting that occurred during
the registrant’s fourth fiscal quarter that has materially affected, or is reasonably likely to materially affect, the registrant’s internal control over financial reporting; and
5. The registrant’s other certifying officer and I have disclosed, based on our most recent evaluation of internal control over
financial reporting, to the registrant’s auditors and the audit committee of the registrant’s Board of Directors (or persons performing the equivalent functions):
a) all significant deficiencies and material weaknesses in the design or operation of internal control over financial
reporting which are reasonably likely to adversely affect the registrant’s ability to record, process, summarize and report financial information; and
b) any fraud, whether or not material, that involves management or other employees who have a significant role in the
registrant’s internal control over financial reporting. Date: November 19, 2014 /s/ Michael S. Macek Michael S. Macek Vice President, Treasurer, and Interim Chief Financial Officer

EXHIBIT 32.1
Certification of Chief Executive Officer Pursuant to 18 U.S.C. Section 1350, as Adopted Pursuant to Section 906 of the Sarbanes-Oxley Act of 2002
In connection with the Annual Report on Form 10-K of Hill-Rom Holdings, Inc. (the “Company”) for the year ended September 30, 2014, as filed with the Securities and Exchange Commission on the date hereof (the “Report”), I, John J. Greisch, President and Chief Executive Officer of the Company, certify, pursuant to 18 U.S.C. Section 1350, as adopted pursuant to Section 906 of the Sarbanes-Oxley Act of 2002, that:
(1) The Report fully complies with the requirements of Section 13(a) or 15(d) of the Securities Exchange Act of 1934; and
(2) The information contained in the Report fairly presents, in all material respects, the financial condition and results of
operations of the Company. /s/ John J. Greisch John J. Greisch President and Chief Executive Officer November 19, 2014 A signed original of this written statement required by Section 906 has been provided to Hill-Rom Holdings, Inc. and will be retained by Hill-Rom Holdings, Inc. and furnished to the Securities and Exchange Commission or its staff upon request.

EXHIBIT 32.2
Certification of Chief Financial Officer Pursuant to 18 U.S.C. Section 1350, as Adopted Pursuant to Section 906 of the Sarbanes-Oxley Act of 2002
In connection with the Annual Report on Form 10-K of Hill-Rom Holdings, Inc. (the “Company”) for the year ended September 30, 2014, as filed with the Securities and Exchange Commission on the date hereof (the “Report”), I, Michael S. Macek, Vice President, Treasurer and Interim Chief Financial Officer of the Corporation, certify, pursuant to 18 U.S.C. Section 1350, as adopted pursuant to Section 906 of the Sarbanes-Oxley Act of 2002, that:
(1) The Report fully complies with the requirements of Section 13(a) or 15(d) of the Securities Exchange Act of 1934; and
(2) The information contained in the Report fairly presents, in all material respects, the financial condition and results of
operations of the Company. /s/ Michael S. Macek Michael S. Macek Vice President, Treasurer, and Interim Chief Financial Officer November 19, 2014 A signed original of this written statement required by Section 906 has been provided to Hill-Rom Holdings, Inc. and will be retained by Hill-Rom Holdings, Inc. and furnished to the Securities and Exchange Commission or its staff upon request.

[This page intentionally left blank]

[This page intentionally left blank]
