trade and distributional impact of genetically modified ... · pdf filetrade and...
TRANSCRIPT

1
Trade and Distributional Impact of Genetically Modified Crops in
India: A CGE Analysis∗
Amrita Chatterjee
Associate Fellow
National Council of Applied Economic Research (NCAER)
New Delhi, India
Arpita Ghose
Reader, Department of Economics
Jadavpur University
Kolkata, India
and
Sanjib Pohit
Chief Economist
National Council of Applied Economic Research (NCAER)
New Delhi, India
1. Introduction
Application of Biotechnology in agriculture and commercialization of Genetically
Modified (GM) Crops have been an issue of much debate. The benefits of GM crops in terms of
increase in crop productivity, alleviation of poverty, reduction of Environmental footprints of
Agriculture, mitigating climate change, reducing Greenhouse gases etc are well approved
worldwide (James, 2007).At the same time there are questions raised regarding the negative
environmental and health effects of these crops by opponents of GM food. This has paved the
∗ This paper was written when the first author was a UGC-Senior Research Fellow in Jadavpur University, Kolkata, Inida.

2
way for several economic studies to give a clear idea about the prospective effects of adoption
of GM crops.
India’s approach towards modern biotechnology has been focused and systematic. The
Department of Biotechnology was created in February 1986 to independently pioneer the
multifaceted development of biotechnology in the country. In India use of all GM substances is
regulated under the Environment (Protection) Act 1989 (EPA) and the Rules 1989 (Rules). As
per the notification of the Ministry of Environment and Forest on 5th December, 1989 the
Genetic Engineering Approval Committee (GEAC) was established among others which was
responsible for approval of proposals related to release of Genetically Engineered Organisms
and products into the environment including experimental field trials. On March 2002, GEAC
took a milestone decision to give permission for commercial production and sale of three Bt
cotton varieties. Since then the success story of Bt Cotton in India is a remarkable one. In 2008,
5 million small farmers are cultivating 7.6 million hectare of Bt cotton with an adoption rate of
80% (James, 2008). In spite of this high success rate there have been very strong opponents of
biotechnology who have thwarted the further spread of this techno logy. As a result no other GM
crop has been approved by GEAC so far, though Bt bringal has been approved by GEAC for
commercialization in October, 2009. However, very recently the Ministry of Environment and
Forest announced its decision to impose a moratorium on the release of the transgenic brinjal
hybrid developed by Mahyco, a subsidiary of global seed giant Monsanto. The moratorium will
last till such time independent scientific studies establish, to the satisfaction of both the public
and professionals, the safety of the product from the point of view of its long-term impact on
human health and environment, including the rich genetic wealth existing in brinjal in India.
India and GM crops:
• Department of Biotechnology was established in 1986. • Use of all GM substances is regulated under the Environment (Protection) Act
1989 (EPA) and the Rules 1989 (Rules). • Genetic Engineering Approval Committee (GEAC) was established in 1989 for
approval of proposals related to release of Genetically Engineered Organisms and products into the environment including experimental field trials.
• On March 2002, GEAC gave permission for commercial production and sale of three Bt cotton varieties.
• In 2008, 5 million small farmers are cultivating 7.6 million hectare of Bt cotton with an adoption rate of 80% in India.

3
There have been considerable numbers of papers which have used Computable general
Equilibrium technique to analyze the impact of introduction of GM-potential crops into the
production structure of different countries under various scenarios. Smale et al. (2006) gave a
detailed survey which includes 14 papers involving developing countries using a modified
version of CGE model based on the GTAP database. Among those, we focus on the group of
papers which have analyzed the effect of introduction of specific GM potential crops in some
specific regions. Anderson and Yao (2001) and Huang et al (2004) considered various GM
adoption related policy issues regarding China whereas Elberhri and MacDonalnd (2004) and
Anderson and Jackson (2005a) have analyzed the case of Sub-Saharan Africa. Anderson and
Jackson (2005b) have studied introduction of some GM crops in Australia and New Zealand
under various trade scenarios. Hareau et al (2005) have evaluated the potential adoption of three
different rice varieties in Asian countries without considering any trade scenario. The studies
which have included India as one of the countries in their regional aggregation are as follows.
• On March 10th, 2006 the Central Government of India in consultation with the Central Committee for Food Standards published two draft rules to amend the Prevention of Food Adulteration Rules (1955), introducing labeling and approval requirements for GM food and products derived form it.
• The Draft Rule 37-E Labeling of Genetically Modified Food states that all primary or processed foods, food ingredients or food additives derived from a GM food require to be labeled accordingly and the imported GM foods should indicate the status of approval in the country of origin
• Bt bringal has been approved by GEAC for commercialization in October, 2009.
• On February 2010, with severe pressure from the environmental activists and Brinjal producing states, the Ministry of Environment and Forest announced its decision to impose a moratorium on the release of the transgenic brinjal hybrid developed by Mahyco, a subsidiary of global seed giant Monsanto.
• The moratorium will last till such time independent scientific studies establish, to the satisfaction of both the public and professionals, the safety of the product from the point of view of its long-term impact on human health and environment.

4
Anderson, Neilsen and Robinson (2002), Neilsen and Anderson (2001), Anderson and Jackson
(2005b) have studied the effects of adoption of GMOs on global production, trade pattern and
welfare of several non-European countries (including India) in the context of the policy
reactions from Western Europe. Anderson and Jackson (2006) have studied the cause of the
strong aversion of GM crops by EU and its effects on the developing countries’ welfare.
Anderson, Venezuela and Jackson (2006) have focused on GM cotton adoption in developing
countries and have also compared its effects with the WTO rule of removal of cotton subsidies.
Gruere et al (2007) have studied the potential effects of introducing GM food crops in
Bangladesh, India, Indonesia and Philippines in the presence of trade related regulations on GM
food. However, the effect of GM crop adoption on income distribution has not attracted much
attention so far. Anderson and Jackson (2003) have made a significant assumption regarding the
income of farm household i.e. factor shares for farm households are a weighted sum of factor
income shares used in agricultural production and the factor income shares of capital owners.
Results show that the farmers of USA will welcome the worldwide adoption of GM varieties
whereas the EU farmers would like the continuation of the EU GM moratorium. Jackson (2004)
has also used same factor ownership structure. Anderson, Jackson and Nielsen (2005) have
considered the same set of assumptions as Anderson and Jackson (2003) in terms of factor
ownership to compare the potential welfare gains from consumer focused golden rice with that
of the producer focused other non-golden rice. They have considered a higher productivity of
the unskilled and non-farm workers with better health with larger vitamin A intake from golden
rice. The results suggest that the welfare gains from the health enhancing golden rice will be
bigger than the gain from productivity improvement which in turn will boost the productivity of
the unskilled laborers in Asian countries.
The perusal of the literature suggests that there is dearth of studies which have
exclusively focused on India to analyze various issues related to GM adoption in detail in CGE
framework. This has been the motivation of the current paper which has studied empirically the
effect of the adoption of GM cotton, soybean, maize and rice on various sectors of Indian
economy using a modified GTAP model. Regarding the policy issues, we have considered a
comparison of a possible imposition and reduction of import tariff by India on vegetable oil and
fat imported from major soybean exporting countries to India. Moreover, incorporating the
Draft rule 37-E of India regarding labeling of GM food, we have considered the effect of

5
introduction of labeling for domestically produced rice in one of the scenarios. In addition to
this, as the profitability of introduction of any new product depends upon the consumers’
acceptance towards it, we have analyzed both positive and negative preference shift of the
Indian consumers towards domestic GM rice the effect of which is yet to be explored in a CGE
frame work. Last but not the least, we have tried to capture the effect of a possible ban imposed
by European Union on import of Indian rice as EU are very much skeptical about the
environmental impact of GM foods. We have considered the effects of all the policies on the
welfare of the country along with the effects on the sectors which are closely related to the GM
potential crops and compared them with the situations when the other countries are also
adopting GM crops. Most importantly, we have studied the distributional effects of all the above
policies which have so far been neglected in the GM related CGE modeling. Here the traditional
method is to use an aggregated CGE with representative households to infer about changes in
the income distribution due to certain policy scenario. The paper has been structured in the
following way. Section 2 explains the methodology, Section 3 & 4 gives the overview of
different scenarios and Section 5 contains the concluding remarks.
2. Methodology and Database
The impact of adoption of GM crops in Indian agriculture has been assessed using the
well-known GTAP (Global Trade Analysis Project) modeling framework which is in detail
documented in Hertel (1997). The model is run through widely used GEMPACK software
package developed by Monash University of Australia. The GTAP model is a multi-region
multi-sector static computable general equilibrium model based on neoclassical macroeconomic
theory. Thus markets are perfectly competitive; profit maximizing producers use the technology
that exhibits constant returns to scale. Like any other general equilibrium model GTAP provides
detailed bilateral trade, transport and protection data with the vertical and horizontal linkages
between all product markets both within the model’s chosen countries and regions and also
between the countries and regions via bilateral trade flows. We have modified the GTAP model
to incorporate the cost of labeling incurred by the j th industry which uses i th commodity as
intermediate input. Further, we have followed Nielson and Anderson (2001) to modify the
model to capture the issue of consumer preference (See Appendix 1 for details of the modified
6
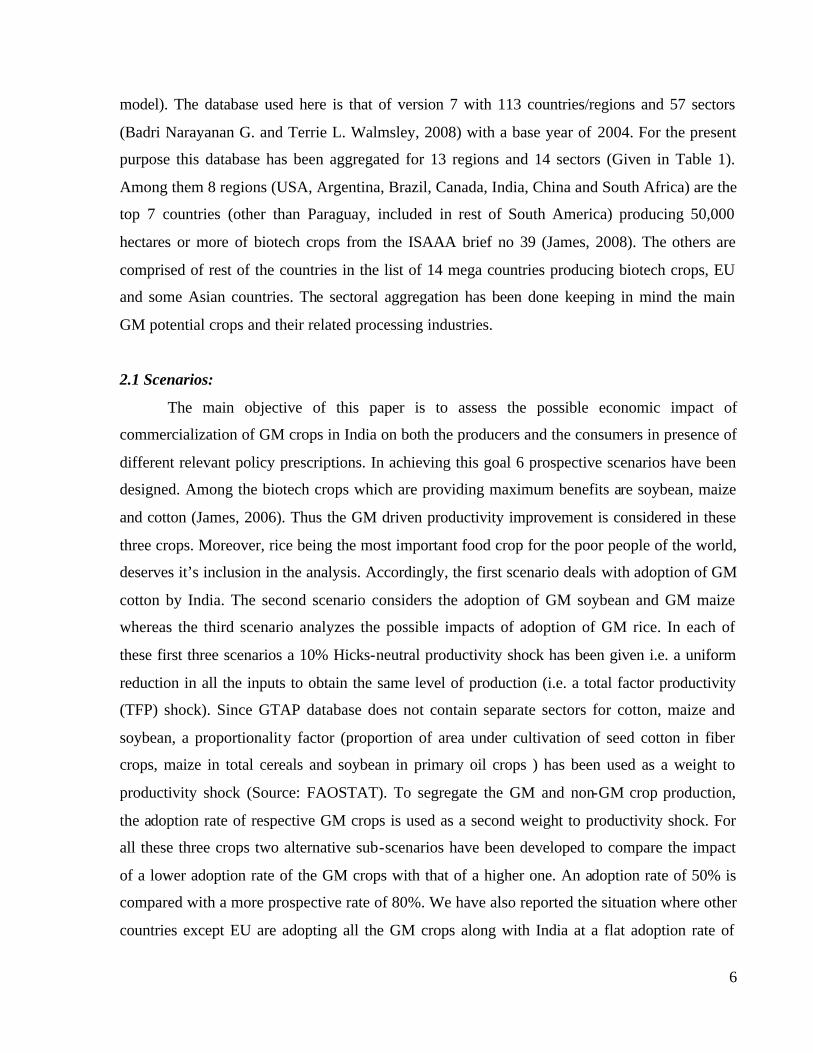
model). The database used here is that of version 7 with 113 countries/regions and 57 sectors
(Badri Narayanan G. and Terrie L. Walmsley, 2008) with a base year of 2004. For the present
purpose this database has been aggregated for 13 regions and 14 sectors (Given in Table 1).
Among them 8 regions (USA, Argentina, Brazil, Canada, India, China and South Africa) are the
top 7 countries (other than Paraguay, included in rest of South America) producing 50,000
hectares or more of biotech crops from the ISAAA brief no 39 (James, 2008). The others are
comprised of rest of the countries in the list of 14 mega countries producing biotech crops, EU
and some Asian countries. The sectoral aggregation has been done keeping in mind the main
GM potential crops and their related processing industries.
2.1 Scenarios:
The main objective of this paper is to assess the possible economic impact of
commercialization of GM crops in India on both the producers and the consumers in presence of
different relevant policy prescriptions. In achieving this goal 6 prospective scenarios have been
designed. Among the biotech crops which are providing maximum benefits are soybean, maize
and cotton (James, 2006). Thus the GM driven productivity improvement is considered in these
three crops. Moreover, rice being the most important food crop for the poor people of the world,
deserves it’s inclusion in the analysis. Accordingly, the first scenario deals with adoption of GM
cotton by India. The second scenario considers the adoption of GM soybean and GM maize
whereas the third scenario analyzes the possible impacts of adoption of GM rice. In each of
these first three scenarios a 10% Hicks-neutral productivity shock has been given i.e. a uniform
reduction in all the inputs to obtain the same level of production (i.e. a total factor productivity
(TFP) shock). Since GTAP database does not contain separate sectors for cotton, maize and
soybean, a proportionality factor (proportion of area under cultivation of seed cotton in fiber
crops, maize in total cereals and soybean in primary oil crops ) has been used as a weight to
productivity shock (Source: FAOSTAT). To segregate the GM and non-GM crop production,
the adoption rate of respective GM crops is used as a second weight to productivity shock. For
all these three crops two alternative sub-scenarios have been developed to compare the impact
of a lower adoption rate of the GM crops with that of a higher one. An adoption rate of 50% is
compared with a more prospective rate of 80%. We have also reported the situation where other
countries except EU are adopting all the GM crops along with India at a flat adoption rate of

7
50% for all the crops. For other countries also the respective proportionality factors have been
considered. The above scenarios are additive in nature as we add one after another crop in each
scenario.
Furthermore, we have brought into consideration some important policy scenarios.
Scenario 4 deals with the comparison of imposition and withdrawal of import tariff by 20% by
India on vegetable oil and fat imported from Other Asian countries (being the largest exporter
of vegetable oil and fat to India) given the fact that India as well the three trading partners have
adopted only GM soybean. The fifth scenario is designed to capture the issue of increase in
labeling cost for domestically produced GM rice under the condition that India is adopting only
GM rice. The next scenario investigates the consumer’s response towards GM rice in India.
Thus both positive and negative response to domestically produced rice has been considered in
presence of labeling policy adopted in only rice sector, when India adopts only GM rice and no
other country has adopted GM rice. The last scenario takes into account the hypothetical
situation when European Union imposes an import ban on Indian GM rice, given the fact that
only India adopts GM rice and exports it.
Table: 1 Regions and Sectors used for General Equilibrium Modeling of the present study
Regions Sectors
1. Oceania
2. China
3. USA
4. Argentina
5. Brazil
6. India
7. Canada
8. South Africa
9. Other Asia (Hong Kong, Japan,
Korea, Taiwan, Rest of East Asia,
Cambodia, Indonesia, Lao
People’s Democratic Republic,
Myanmar, Malaysia, Philippines,
1. Rice
2. Cereal Grains (Maize)
3. Oilseeds (soybean)
4. Grains Crops (wheat, vegetable, fruits
and nuts, Sugar cane, sugar beet, crops
necessary)
5. Plant based fibers (cotton)
6. Processed food (sugar, food products
necessary, Beverages and tobacco
products)
7. Meat products and livestock (cattle,
Sheep, goat, horses, animal products
necessary, wool, silk-worm, cocoons,

8
Singapore, Thailand, Vietnam,
Rest of southeast Asia, Bangladesh
Pakistan, Sri Lanka and Rest of
South Asia )
10. Other Latin American Countries
( Other Latin America,
Bolivia, Chile, Colombia,
Ecuador,Peru,Mexico, Colombia,
Chile, Uruguay, Venezuela,
Rest of South America, Costa Rica,
Guatemala, Nicaragua, Panama,
Rest of Central America, Caribbean.
11. EU_25
12. Sub-Saharan Africa
13. Rest of the world
meat: (cattle, sheep, goats, horse, meat
products necessary))
8. Milk and dairy
9. Extraction (Forestry and fishery,
coal,oil, gas, Minerals necessary)
10. Vegetable oil and fats
11. Processed rice
12. Textile
13. Manufacturing
14. Services
3 Assessment of economic impact under various scenarios:
3.1 Scenario 1: commercialization of GM cotton in India
India is the largest cotton growing country in the world. As per ISAAA brief 39, in 2008,
5 million small farmers planted 7.6 million hectares of Bt cotton in India which is equivalent to
82% of adoption rate. Thus we have compared, in this scenario, two prospective adoption rates
of 50% and 80% for Bt cotton with a 10% Hicks-neutral productivity shock to the cotton sector.
A 10% reduction in the overall production cost in cotton sector will have its effect of textile
sector as well. Table 2 and Table 2(a) show the effects of adoption of Bt cotton in India with a
lower adoption rate of 50% and a higher rate of 80% respectively on the cotton and textile
sector. With a fall in production cost due to adoption of GM cotton, there is increase in output
which is followed by a fall in supply price. However, the magnitude of these changes depends
on the adoption rate. For a lower adoption rate supply price is reduced by 4.16% and 0.46%
respectively whereas output is increased by 2.24% and 1.32% in cotton and textile sector. With
a higher adoption rate supply price is lower by 6.66% in cotton sector and 0.74% in textile
sector. Output will also increase at a higher rate of 3.58% and 2.12% respectively. The lower

9
supply price has led to an increase in consumer demand which is up by 1.63% and 0.32 %
respectively. A higher adoption rate prompts a much higher demand for cotton and textile at the
rate of 2.61% and 0.5% respectively. Also there is an increase in exports. With a lower adoption
rate of 50%, export increases by 18.26% in cotton sector and by 3.08% in textile sector. A
higher adoption rate of 80% shows the prospect of increase in export by 29.22% and 4.93% in
the two sectors in concern. Thus the extent of increase in exports increases with increase in
adoption rate. Here we must take note of the fact that, domestic demand may have increased less
than proportionately compared to the increase in output level. This has led to an increase in
export and a fall in import in both the sectors by 8.64% and 1.17%. Import will be much lower
(by 13.83% and 1.87% in cotton and textile sector) if India adopts Bt cotton at a higher rate.
With rise in export and fall in import, trade balance is obvious to improve. It has improved more
in textile sector (450.4 million USD) than in cotton sector (62.42 million USD). Trade balance
will further improve with 80% adoption rate (see Table 2 (a)).
Table 2: Sectoral effects (in % change form) of adoption of Bt Cotton in India when the
adoption rate is 50%
Sector Supply Price Output Consumer Export(fob) Import(cif) Trade Balance
Demand (Million USD)
Cotton -4.16 2.24 1.63 18.26 -8.64 62.42
Textile -0.46 1.32 0.32 3.08 -1.17 450.4
Table 2 (a): Sectoral effects (in % change form) of adoption of Bt Cotton in India when the
adoption rate is 80%
Sector Supply Price Output Consumer Export(fob) Import(cif) Trade Balance
Demand (Million USD)
Cotton -6.66 3.58 2.61 29.22 -13.83 99.88
Textile -0.74 2.12 0.5 4.93 -1.87 720.63

10
3.2 Scenario 2: commercialization of GM maize and soybean along with GM cotton in India
This scenario considers the adoption of GM maize and soybean in addition to GM cotton
in India. With 10% Hicks neutral productivity shock in these two sectors, output increases by
0.16% and 0.34% respectively with an adoption rate of 50% (See Table 3 and 3 (a)). As the
adoption rate increases to 80%, output in these sectors increases by 0.26% and 0.54%. The
supply price on the other hand is lower by 0.48% and 1.13% in the two sectors respectively
which leads to increase in consumer demand by 0.12% and 0.19%. For higher adoption rate
supply price falls by 0.77% and 1.81% in maize and soybean sector leading to a rise in
consumer demand by 0.19% and 0.31% respectively. In India 51% of total Maize consumption
goes to poultry sector and only 26% is used for human consumption (The Associated Chambers
of Commerce and Industry of India (ASSOCHAM) report, 2009). Thus consumer demand for
maize is not growing at a very high rate, but with higher adoption rate situation is expected to
improve. Exports of maize increase by 1.09% whereas imports showed a decline by 0.48% with
a lower adoption rate leading to an improvement in trade balance by 1.36 million USD. A
higher adoption rate reduces maize import by 0.77% and raises export by 1.75% thereby
improving the trade balance by 2.17 million USD. As far as soybean is concerned, with a fall in
import and rise in export the trade balance gets improved by 12.7 million USD which is further
reinforced by a trade balance of 20.31 million USD with increase in adoption rate.
Table 3: Impact on maize and soybean sector (in % change form) due to adoption of GM maize
and GM soybean along with GM cotton at the rate of 50% by India
Sector Supply Price Output Consumer Export(fob) Import(cif) Trade Balance
Demand (Million USD)
Maize -0.48 0.16 0.12 1.09 -0.48 1.36
Soybean -1.13 0.34 0.19 4.71 -2.56 12.7
11
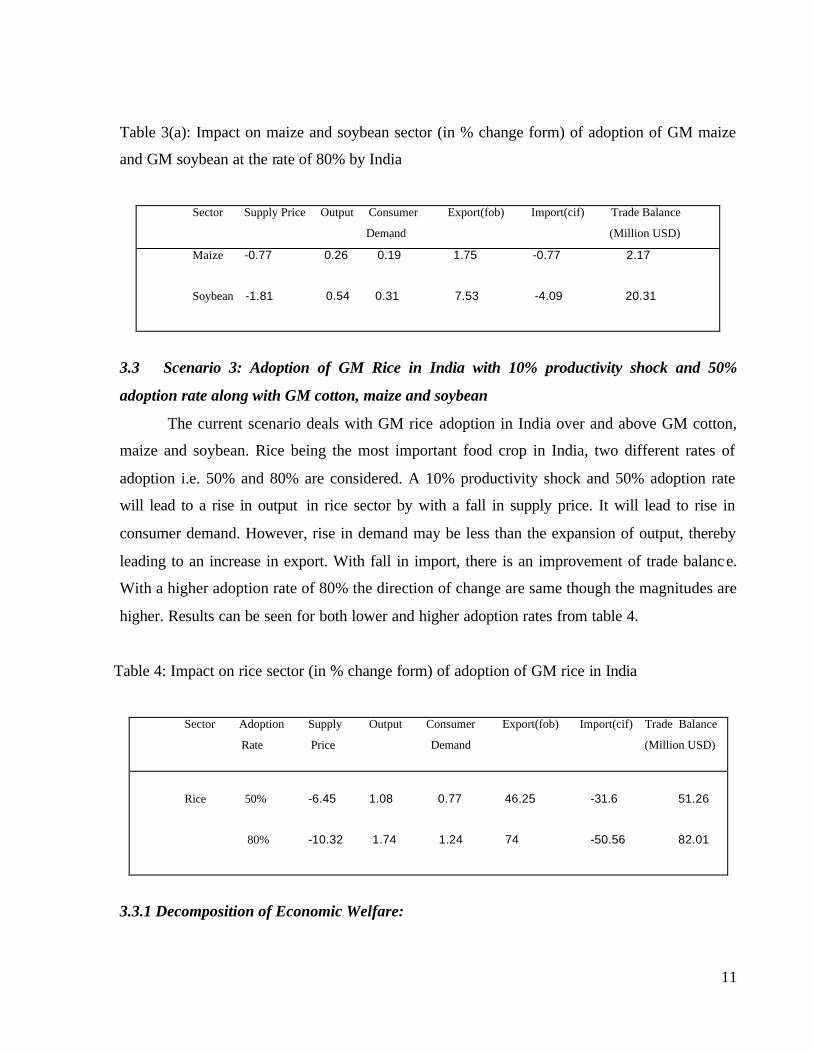
Table 3(a): Impact on maize and soybean sector (in % change form) of adoption of GM maize
and GM soybean at the rate of 80% by India
Sector Supply Price Output Consumer Export(fob) Import(cif) Trade Balance
Demand (Million USD)
Maize -0.77 0.26 0.19 1.75 -0.77 2.17
Soybean -1.81 0.54 0.31 7.53 -4.09 20.31
3.3 Scenario 3: Adoption of GM Rice in India with 10% productivity shock and 50%
adoption rate along with GM cotton, maize and soybean
The current scenario deals with GM rice adoption in India over and above GM cotton,
maize and soybean. Rice being the most important food crop in India, two different rates of
adoption i.e. 50% and 80% are considered. A 10% productivity shock and 50% adoption rate
will lead to a rise in output in rice sector by with a fall in supply price. It will lead to rise in
consumer demand. However, rise in demand may be less than the expansion of output, thereby
leading to an increase in export. With fall in import, there is an improvement of trade balance.
With a higher adoption rate of 80% the direction of change are same though the magnitudes are
higher. Results can be seen for both lower and higher adoption rates from table 4.
Table 4: Impact on rice sector (in % change form) of adoption of GM rice in India
Sector Adoption Supply Output Consumer Export(fob) Import(cif) Trade Balance
Rate Price Demand (Million USD)
Rice 50% -6.45 1.08 0.77 46.25 -31.6 51.26
80% -10.32 1.74 1.24 74 -50.56 82.01
3.3.1 Decomposition of Economic Welfare:

12
Now, table 5 shows, how the adoption of these GM crops have substantial welfare effect
in India, which is measured in terms of equivalent variations of income. This can be interpreted
as the change in the regional household income at constant prices that is equivalent to the
proposed change. We have further decomposed the EV into three components as per Huff and
Hertel (2000). The adoption of only GM cotton leads to an improvement of welfare of 393.36
million USD, most of which is due to the value added augmenting technical change (arises out
of change in the uses of inputs available for production). With addition of maize and soybean
the welfare is further enhanced to 609.43 million USD. However, the adoption of GM rice leads
to considerable jump in welfare (1192.93 million USD). In both cases major share of
improvement in EV comes from productivity shock.
Table 5: Decomposition of economic welfare when India adopts GM cotton, maize, soybean and
rice in India
Commodity Equivalent Variation Decomposition of Welfare
adopted (EV,Million USD)
Allocative Terms Of Value Added
Efficiency Trade Augmenting
Effect Effect Technical
Change
Cotton 393.36 27.29 9.99 259.64
Cotton,
maize and 609.43 22.43 10.89 464.09
soybean
Cotton, maize, 1192.93 40.68 2.02 1005.77
Soybean and
rice
3.3.2 Distributional Effects:
Table 6(a) and 6(b) give the change in the distributional effects of adoption of GM
cotton, soybean, maize and rice, adoption rate being 50%. Land being a sluggish factor of
production can not be easily reallocated between alternative uses. Hence land rent differentials

13
are allowed across sectors. As Hicks neutral productivity shock has been given to cotton, maize,
soybean and rice sectors, demand for land falls in these sectors leading to a fall in land prices in
these sectors. As factors have become more productive, in aggregate less land is required for
higher production. Labor and capital are perfectly mobile domestically. Though less labor is
needed for production in these sectors due to improvement in productivity, total demand for
labor will increase with increase in total production. Moreover, with a fall in supply price of the
sectors which are experiencing productivity shock (as they together enjoy a significant share in
the consumption basket of India consumers), the real income of laborers may rise for both
skilled and unskilled labor. However, the income of the skilled labor increases more compared
to the unskilled labor. Here we note that the capital income has also increased, though the
percentage increase is higher than unskilled labor and lower than skilled labor. Thus the highest
benefit goes to the skilled labor which gives an interesting insight into the fact that the GM
technology needs more scientists and extension workers to spread its benefit to the grass root
level. Another observation can be made here, which points out to the widening wage gap of
skilled to unskilled wages. This is in conformity with the existing literature. Shariff and Gumber
(1999) has put forward the evidence that suggests that the wage-gap between the graduate and
non- literate has widened significantly in transport and storage, agriculture and in services in
India. This trend has continued even if the productivity shocks are experienced.
Table 6 (a): % change in demand for factors used in different sectors in India
Factor Rice Maize Soybean Cotton
Land -5.12 0.31 -0.31 -2.43
UnSklab -7.16 -0.5 -1.26 -3.85
Sklab -7.2 -0.54 -1.3 -3.89
Cap -7.17 -0.51 -1.27 -3.87

14
Table 6(b): Effects of adoption of GM crops on factor income (in % change form) in India
Factor Prices Adoption of GM cotton, GM maize, GM soybean and GM Rice
(real income)
Land -1.96
Unskilled labor 0.44
Skilled labor 0.56
Capital 0.48
3.3.3 Effect on other sectors:
The adoption of GM cotton, maize, soybean and rice will have its effects on the other
sectors which are closely related to these sectors. A fall in land price has led to expansion in
output and accordingly a fall in supply price of the crops which use land more intensively than
others such as wheat, sugar and other food crops. The sectors like animal products, milk and
dairy are gaining as they use soybean, maize and rice as their intermediate inputs at a cheaper
price. Soybean and rice are also used in vegetable oil and fat and processed rice. Moreover, the
land not used by the GM adopting sectors can well be utilized by other sectors which will also
help then to raise the production level. The change in magnitudes can be seen from Table 7.

15
Table 7: Impact of adoption of GM cotton, maize, soybean and rice (in % change form) on the
other sectors of the economy
Sector Supply Price Output Consumer Export(fob) Import(cif) Demand Grains Crops -0.44 0.29 0.22 1.94 -0.82 Processed food 0.02 0.15 0.17 -0.09 0.2 Meat and Livestock -0.45 0.47 0.34 2.88 -0.69 Milk and Dairy 0 0.24 0.24 -0.04 0.25 Veg oil and fat -0.62 1.37 1.06 3.54 -0.87 Processed Rice -0.99 0.4 0.25 3.4 -2.26 Extraction 0.06 -0.16 0.21 -0.56 0.02 Manufacturing 0.16 -0.09 0.18 -1.11 0.49 Services 0.23 0.09 0.24 -0.76 0.43
3.3.4 Trade effect on other countries
Now, if we look at the trade effects on trade balance of other countries (Table 8) when
only India is adopting GM crops, it is clear that the major rice exporting south-east Asian
countries which are part of our other Asian countries are losing the market share to India. Even
in case of textile also the major cotton exporting countries like Bangladesh, Pakistan (among
other Asian countries), China and USA are affected adversely due to low cost products of India.
As far as maize and soybeans are concerned, though India does not enjoy much trade share in
these sectors, USA and Brazil will be to some extent on the losing side which will be a gain for
some other Asian countries.

16
Table 8: The effect on trade balance of the other countries when only India is adopting the GM
crops (in million USD)
Countries Rice Cotton Textile Maize Soybean
USA -9.81 -23.39 -40.12 -3.72 -9.16
Argentina -0.04 -0.01 -0.18 -0.24 -1.53
Brazil -0.09 -3.32 -1.95 -0.29 -6.21
South Africa -0.01 -0.83 -3.14 -0.1 -0.03
China -1.39 0.15 -98.97 -0.33 0.91
Canada -0.18 -0.18 -3.64 -0.07 -3.36
Rest of
Latin
American -2.81 -0.89 -12 0.17 -1.06
Countries
Oceania -0.3 -5.68 -3.66 -0.23 -0.9
Other Asia -15.18 -0.27 -77.25 2.25 9.61
SSA -0.61 -15.11 -0.7 0.07 -0.68
3.3.5 Trade Scenario:
3.3.5.1 Scenario 3(a): Adoption of GM cotton, maize, soybean and Rice in India and in all
other countries except EU with 10% productivity shock and 50% adoption rate
This scenario shows how the adoption of GM crops by other countries except EU
(Canada not adopting GM cotton) changes the global trade pattern. First we consider the effects
on India when other countries are also producing GM crops (Table 9). With other countries

17
adopting the GM crops, India has lost its export share in world market both for the rice and
cotton sectors which is reflected in the significant fall in the trade balance in these two sectors
compared to the situation when only India was adopting GM crops. In textile sector though,
India’s dominance is continued with a slight improvement in trade balance in this sector.
However, in maize and soybean sector India is losing its market to other major trading countries
in the world.
India:
Table 9: Sectoral effect (in % change form) in India when all the other countries except EU is
adopting all the GM crops under consideration
Sector Export(fob) Import(cif) Trade Balance
(Million USD)
Rice 30.3 -11.67 30.16
Cotton 10.77 -4.98 35.83
Textile 3.44 -1.03 487.19
Maize -1 -0.02 -4.58
Soybean -0.11 -2.43 -5.35
Now, if we compare these results with the other GM adopting countries in the world
(Table 10), it is observed that the other Asian countries (mostly south-east Asia) which are the
main rice exporters have gained the most from the GM rice adoption. India has gained much
more than China in terms of exports revenue from rice. Brazil, other Latin American countries
and sub-Saharan African countries have also gained. As far as textile sector is concerned, China
has the possibility of gaining the most which in fact gives tough competition to the other major
textile exporting countries in Asia and also USA, though in cotton sector almost all the countries
are doing well. In maize sector, USA and Argentina are losing their share to other Latin
American countries and some Asian countries. The three major players in the world soybean
market i.e. USA, Argentina and Brazil have lost their market share to some extent to China,
Other Latin American countries and other Asian countries. Thus adoption of GM crop is giving

18
greater benefits to the Asian countries and low-income developing countries of Latin America
along with the Sub-Saharan Africa compared to the high- income developed countries.
Table 10: Secrotal effects (in % change form) of GM adoption on all the other countries Sector USA Argentina Brazil Canada South Africa China Other Latin Other Asia Oceania SSA
American
Countries
Rice
Export 0.3 -7.37 -5.7 -26.19 -13.03 1.06 3.94 13.9 -5.65 9.28
Import 7.1 4.61 -0.73 3.48 1.22 1.05 -3.55 -5.02 0.84 -2.57
Trade
Balance -18.54 -3.27 4.23 -0.23 -0.29 -2.35 14.4 40.89 -1 15.76
Cotton
Export 3.95 -2.79 3.12 -7.72 -5.9 -0.38 1.06 -1.64 5.12 5.77
Import -3.85 1.38 0.54 2.05 3.15 0.79 0.48 0.47 -1.94 3.07
Trade
Balance 35.08 -0.01 3.9 -1.23 -5.41 51.33 3.76 81.37 10.39 43.45
Textile
Export -0.08 -0.75 -0.38 -0.42 -0.64 0.55 -0.31 0.02 -0.09 1.5
Import 0.11 0.11 0.26 0.09 0.4 -0.02 0.09 0.15 0.09 0.06
Trade
Balance -26.33 -3.95 -10.31 -17.1 -13.54 392.88 -44.72 -100.42 -1.36 50.13
Maize
Export 1.08 -0.55 3.06 -1.73 1.01 -0.43 2.63 1.03 -1.48 0.68
Import -1.22 1.69 -0.79 0.73 -0.83 -1 -0.56 0.04 0.76 0.35
Trade
Balance -46.8 -18.99 8.99 -8.2 -0.06 -4.48 29.67 88.91 -13.81 3.5
Soybean
Export 2.81 0.43 2.29 -4.05 -3.66 -1.06 3.74 -0.76 -4.3 -5.07
Import -2.75 5.52 2.24 2.22 -0.41 0.31 -0.81 0.01 0.42 0.64
Trade
Balance 3.94 -41.48 -27.28 -89.07 -0.4 111.71 39.62 107.06 -25.46 -24.02

19
3.3.5.2 Decomposition of Economic Welfare:
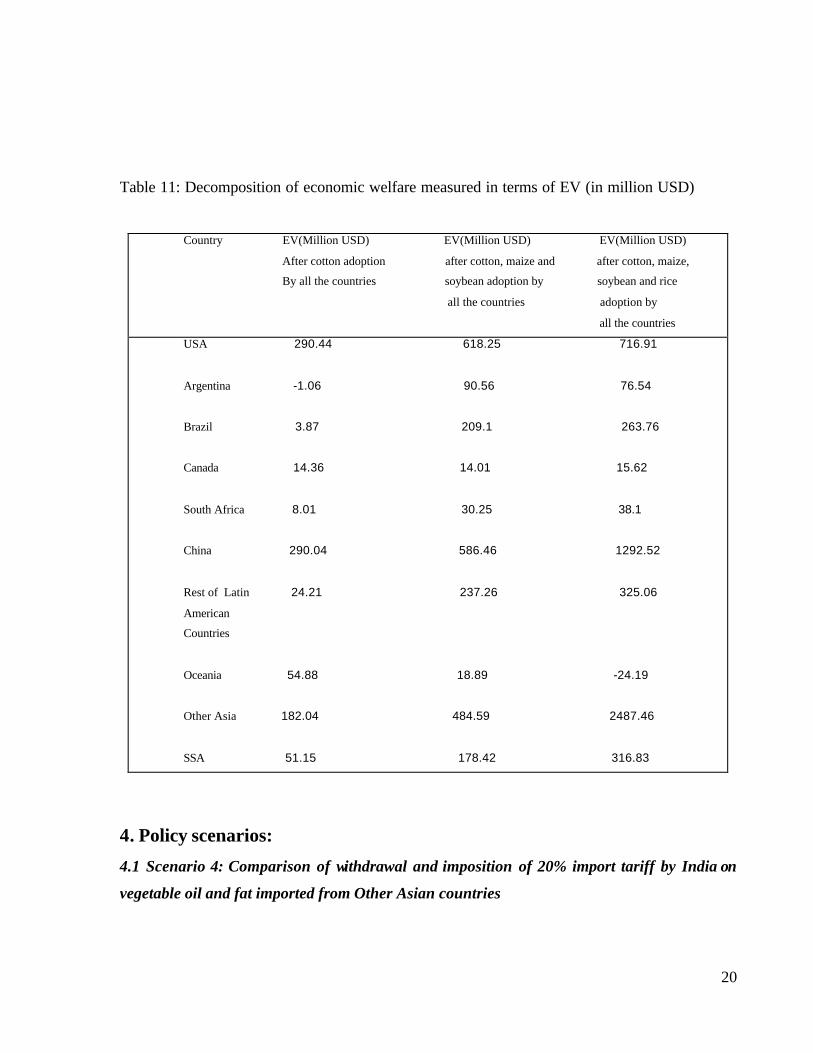
It is easily observable from Table 11 that the maximum welfare gain is captured by the
Asian countries like China, India and the south-east Asian giants. The interesting fact is that
though they have gained from cotton, maize and soybean adoption, rice is the main source of
this improvement in welfare. The enhancement in export revenue from rice has led to this huge
gain. Thus the adoption of GM rice has a very significant role to play in these Asian economies.
Here we want to note that USA is gaining more from cotton, maize and soybean adoption rather
than rice. EV after rice adoption has gone down slightly for USA (from 716.91 million USD
after cotton, soybean and maize adoption to 618.25 million USD) which can be attributed to the
increase in rice export share of China and other Asian countries. Same is the story for
Argentina. It is evident from the loss of EV from the terms of trade effect. Brazil, South-Africa
and other Latin American countries have improved their welfare with GM adoption, though the
magnitude of their gain varies. As far as Canada and Oceania are concerned, though they have
considerable share in soybean export, they are facing steep competition mainly from USA. As a
result their welfare has gone down. Australia-New Zealand, however, having a large share in
cotton and textile export, gains from cotton adoption.
20
Table 11: Decomposition of economic welfare measured in terms of EV (in million USD)
Country EV(Million USD) EV(Million USD) EV(Million USD)
After cotton adoption after cotton, maize and after cotton, maize,
By all the countries soybean adoption by soybean and rice
all the countries adoption by
all the countries
USA 290.44 618.25 716.91
Argentina -1.06 90.56 76.54
Brazil 3.87 209.1 263.76
Canada 14.36 14.01 15.62
South Africa 8.01 30.25 38.1
China 290.04 586.46 1292.52
Rest of Latin 24.21 237.26 325.06
American
Countries
Oceania 54.88 18.89 -24.19
Other Asia 182.04 484.59 2487.46
SSA 51.15 178.42 316.83
4. Policy scenarios:
4.1 Scenario 4: Comparison of withdrawal and imposition of 20% import tariff by India on
vegetable oil and fat imported from Other Asian countries

21
Among the GM potential crops soybean and soybean oil are the major agricultural
products imported by India. According to the Directorate General of Commercial Intelligence
and Statistics under the Ministry of Commerce and Industries, government of India, India has
imported oilseeds worth Rs.12133.09 lacs and vegetable (edible) oil, which includes soybean
oil, worth Rs.1443769.26 lacs within the period April 2008-February 2009. The major exporters
of vegetable oil to India are other Asian countries. The Government of India on 28th November
2008 imposed a 20 per cent import duty on crude soybean oil, while keeping the import duty on
other crude vegetable oils at zero. However, it has subsequently abolished the 20 per cent import
duty bringing it on the same level as other crude vegetable oils such as palm, sunflower, and
rapeseed. This has led to the current scenario, where we compare the effect of withdrawal and
imposition of import tariff by 20% on vegetable oil imported from other Asian countries by
India. In this scenario we have assumed that India and Other Asian countries are adopting only
GM soybean which is modeled as a 10% productivity shock (with 50% adoption rate) to
soybean sector in these four countries while no other country is adopting any other GM crop.
Over and above this, the shock corresponding to 20% tariff reduction and imposition on
vegetable oil and fat imported from other Asian countries are given separately. Table 12 (a) and
12 (b) respectively give the sectoral effects of withdrawal and imposition of 20% tariff on India.
Withdrawal of import tariff has led to significant flow of cheap import of vegetable oil and fat to
India (by approximately 20%) whereas the imposition of tariff will lead to obvious fall in
import. Comparing with the scenario of productivity shock to soybean sector in India and other
Asian countries, it can be observed that, there is a significant fall in output of vegetable oil & fat
after the additional shock of withdrawal of import tariff. With the withdrawal of import tariff
there will be a fall in price of imported vegetable oil & fat which will lead to a fall in demand
for the domestic counterpart of the product. This will lead to rise in India’s export of vegetable
oil & fat, though it will be outweighed by large rise in import. As a result there will be
considerable fall in trade balance compared to the productivity shock scenario. On the other
hand, with imposition of import tariff, imported vegetable oil and fat will be costlier which will
lead to significant rise in demand for domestic soybean. As a result there will be rise in
domestic production of vegetable oil & fat accompanied by a fall in export, though its
magnitude is not very significant. Since import has been reduced to a great extent, there will be
much improvement in trade balance.

22
Table 12 (a): Sectoral effects of 20% reduction of tariff on vegetable oil and fat imported from
Other Asian countries Sector Output Consumer Export(fob) Import(cif) Trade Demand Balance Vegetable oil -12.35 -19.1 7.73 20.41 -384.68 and fat
Table 12 (b): Sectoral effects of imposition of 20% tariff on vegetable oil and fat imported from
Other Asian countries Sector Output Consumer Export(fob) Import(cif) Trade Demand Balance Vegetable oil 14.16 20.43 -2.61 -21.85 474.23 and fat
4.1.1: Decomposition of Economics welfare:
From Table 13 (a) and (b) it is evident that there is huge improvement in the economic
welfare after the withdrawal of import tariff, which is mainly due to the allocative efficiency
though there are adverse terms of trade effect. However, there is significant fall in EV from
imposition of import tariff due to allocative inefficiency, even if terms of trade effect improves.

23
Table 13 (a): Decomposition of economic welfare measured in terms of EV (in million USD)
with withdrawal of import tariff Equivalent Variation
(EV,Million USD)
Decomposition of Welfare
Allocative
Efficiency
Effect
Terms Of
Trade
Effect
Change
Value Added
Augmenting
Technical
800.85
736.77
-91.85
187.14
Table 13 (b): Decomposition of economic welfare measured in terms of EV (in million USD)
with imposition of import tariff
Equivalent Variation
(EV,Million USD)
Decomposition of Welfare
Allocative
Efficiency
Effect
Terms Of
Trade
Effect
Change
Value Added
Augmenting
Technical
-402.95
-745.84
95.33
187.14
4.1.2 Distributional effects:
Table 13 (c) and 13 (d) give the change in demand for different factors of production
used in vegetable oil & fat sector due to withdrawal and imposition of import tariff respectively.

24
With the imposition of import tariff there will be a rise in demand for domestically produced
vegetable oil and fat. As a result demand for all the factors of production rises in this sector
compared to the situation when India and its trading partners are experiencing productivity
shock in soybean sector only. However, with rise in domestic demand, there will be rise in
domestic price of vegetable oil and fat as well. This can outweigh the rise in nominal income of
the factors of income as both soybean and vegetable oil and fat as significant share in total
consumption of Indian consumers. This can be the possible cause of fall in real income of
capital, skilled and unskilled labor. Opposite happens when the tariff is withdrawn. As there will
be a fall in demand for domestically produced vegetable oil & fat, the demand for all the factors
of production will fall in this sector accompanied by a larger fall in price of the domestically
produced vegetable oil and fat. This may lead to rise in real income of capital, skilled and
unskilled labor. Here also skilled laborers have benefited more than the unskilled laborers. The
impact on real income of the factors of production is reported in table 13 (e).
Table 13 (c): % change in demand for factors used in vegetable oil & fat sector in India after
withdrawal of import tariff
Factor vegetable oil & fat
Land -4.91
UnSklab -12.31
Sklab -12.43
Cap -12.37
Table 13 (d): % change in demand for factors used in vegetable oil and fat sector in India after
imposition of import tariff
Factor vegetable oil & fat
Land 6.22
UnSklab 14.15
Sklab 14.2
Cap 14.16

25
Table 13(e): Effects of adoption of GM crops on factor income (in % change form) in India
after withdrawal of import tariff
Factor Prices Withdrawal of import Imposition of import
(real income) tariff from vegetable tariff on vegetable
oil and fat oil and fat
Land -1.39 0.68
Unskilled labor 0.32 -0.17
Skilled labor 0.42 -0.21
Capital 0.36 -0.18
4.2 Scenario 5: Labeling cost increases by 10% on intermediate input used by GM rice and
their related sectors
This scenario examines the effect of introduction of mandatory labeling requirement for
GM food adopted in India. On March 10th, 2006 the Central Government of India in
consultation with the Central Committee for Food Standards published two draft rules to amend
the Prevention of Food Adulteration Rules (1955), introducing labeling and approval

26
requirements for GM food and products derived form it. The Draft Rule 37-E Labeling of
Genetically Modified Food states that all primary or processed foods, food ingredients or food
additives derived from a GM food require to be labeled accordingly and the imported GM foods
should indicate the status of approval in the country of origin (Gruere and Rao, 2007). Now, this
labeling involves some costs and there are few studies evaluating the cost of labeling in
developed countries. As far as the developing countries are concerned, a study regarding
Philippines evaluated that the mandatory labeling leads to an increase in production cost of 11-
12% (Gruere, 2007). Since cotton is a non-food crop, it does not require a label. So in this
scenario we have considered the adoption of only GM rice by India. Here we have assumed a
10% increase in the production cost of domestically produced GM rice and also for the sectors
which use rice as intermediaries due to labeling requirement (milk & dairy and processed rice)
over and above 10% productivity shock. The GTAP model has been modified accordingly to
incorporate the labeling cost for domestically produced GM rice (see appendix A.2). Currently
we are refraining from the issue of labeling on imported commodities. Table 14 gives the
sectoral effects this labeling policy for domestic GM rice in India.
Table 14: Sectoral effects (in % change form) of labeling policy in India Sector Output Export(fob) Import(cif) Trade Balance (Million USD) Rice 0.79 47.03 -31.19 52.14 Milk and Dairy 0.04 1.1 -0.53 1.5 Processed Rice -0.14 -2.09 1.48 -17.96
Here we note that, the price of rice used as intermediate input was reduced by 6.32%
from baseline situation after the 10% productivity shock to rice sector in India, which has
increased by 3.35% from the baseline in rice, milk & dairy and processed rice sector under the
labeling policy scenario, which is obvious given the fact that the production cost has gone up
due to labeling requirement. Due to increase in production cost output has fallen in both rice and
rice related sectors compared to the situation of GM rice adoption (from 1% to 0.79% in rice
sector, from 0.36% to -0.14% in processed rice and from 0.13% to 0.04% in milk & dairy). The

27
domestic demand for rice as intermediary in all these sectors has fallen compared to previous
scenario, may be due to rise in price level, which has prompted a fall in import (expect
processed rice sector) and a rise in export leading to an improvement in trade balance. Here we
observe that even after a rise in price of processed rice due to labeling its demand has increased
though output has not grown to satisfy that. This has prompted a rise in import and a fall in
export, leading to a deterioration of trade balance. This may be explained by a price inelastic
demand for processed rice, if processed rice contains the finer and costlier varieties of rice.
4.2.1 Decomposition of Economic Welfare:
Table 15: Decomposition of Economic Welfare
Country Equivalent Variation(EV,Million USD) Decomposition of Welfare
Allocative
Efficiency
Effect
Terms
Of
Trade
Effect
Value Added
Augmenting
Technical
Change
India -43.16
2.34
-74.16
541.69
Since labeling is costly and any positive utility towards the consumers arising out of the
availability of new information about GM crops are not considered he re, there is a fall in
welfare in terms of equivalent variation for India (table 15).
4.2.2 Distributional Effects:
Due to imposition of labeling policy, demand for all the factors of production falls as
output has reduced in rice and related sector compared to the scenario where only adoption of
the GM crop take place. As a result real return to all the factors of production falls. However,
even if output falls, it remains above the baseline projection. Thus, the effect of productivity
shock outweighs the negative effect of labeling policy. Accordingly, price of both skilled and
unskilled labor rises. Here an important observation is that skilled labor is benefited more
compared to the unskilled labor. As a result the skilled-unskilled wage gap has increased from
the productivity shock scenario to the labeling policy scenario, thereby widening the wage gap.

28
Table 15 (a): % change in demand for factors used in different sectors in India after imposition
of labeling policy
Factor Rice Land -3.56 UnSklab -4.72 Sklab -4.74 Cap -4.73
Table 15(b): Effects of adoption of GM crops on factor income (in % change form) in India
after imposition of labeling policy
Factor Prices Labeling on domestic rice
(real income)
Land -1.43
Unskilled labor 0.12
Skilled labor 0.2
Capital 0.18
4.3 Scenario 6: Preference shift towards domestically produced rice and its related sectors
with labeling policy applicable on GM rice India, when no the other country is adopting GM
crops
In this scenario we try to analyze the consumer’s attitude towards GM crop. Rice being
the most important food crop for Indian consumers, it is essential to investigate how Indian
consumers will accept the introduction of GM rice in their consumption basket. Deodhar et al
(2008) have studied the Indian consumer’s awareness; opinion and willingness to pay for GM
food and have shown that, consumers are willing to pay a premium of 19.5% for golden rice and
16.12% for edible oil due to high nutritional value and low pesticide usage in GM crops. This
study is based on the questionnaire survey on 602 respondents in the city of Ahmedabad and
110 other over internet. There is dearth of literature which has tried to capture the issue of
Indian consumer’s preference towards GM food through a CGE analysis. In this paper we have
29
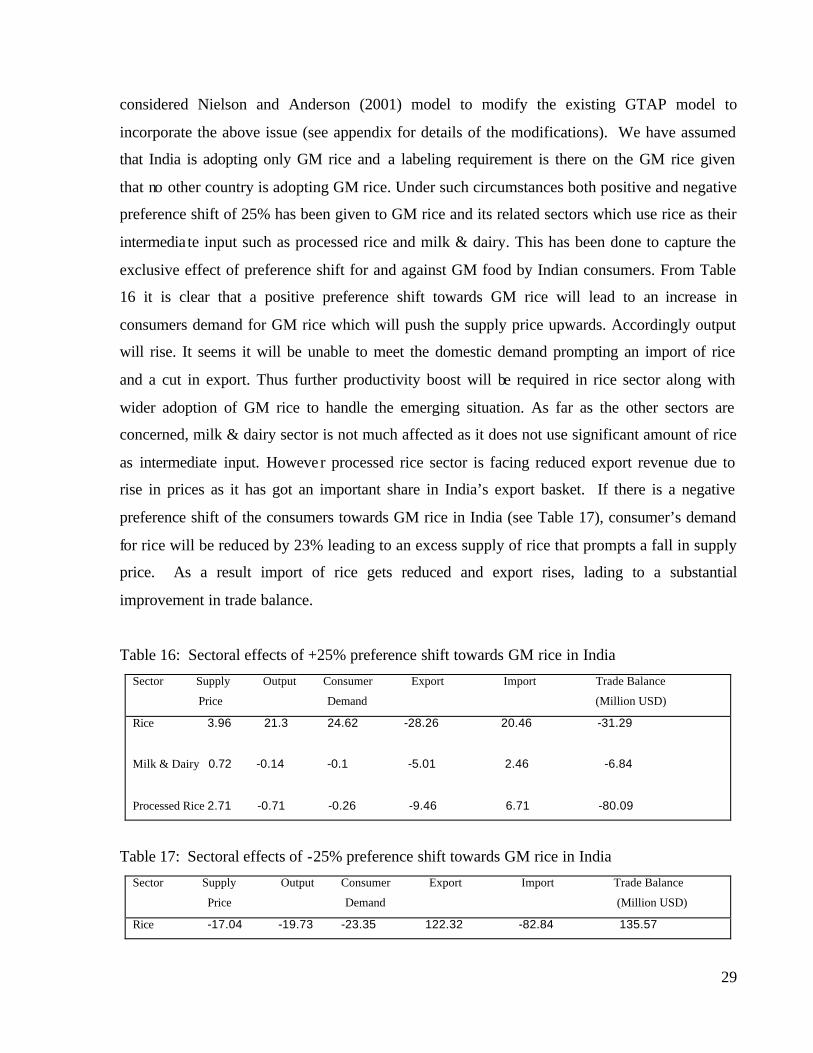
considered Nielson and Anderson (2001) model to modify the existing GTAP model to
incorporate the above issue (see appendix for details of the modifications). We have assumed
that India is adopting only GM rice and a labeling requirement is there on the GM rice given
that no other country is adopting GM rice. Under such circumstances both positive and negative
preference shift of 25% has been given to GM rice and its related sectors which use rice as their
intermedia te input such as processed rice and milk & dairy. This has been done to capture the
exclusive effect of preference shift for and against GM food by Indian consumers. From Table
16 it is clear that a positive preference shift towards GM rice will lead to an increase in
consumers demand for GM rice which will push the supply price upwards. Accordingly output
will rise. It seems it will be unable to meet the domestic demand prompting an import of rice
and a cut in export. Thus further productivity boost will be required in rice sector along with
wider adoption of GM rice to handle the emerging situation. As far as the other sectors are
concerned, milk & dairy sector is not much affected as it does not use significant amount of rice
as intermediate input. However processed rice sector is facing reduced export revenue due to
rise in prices as it has got an important share in India’s export basket. If there is a negative
preference shift of the consumers towards GM rice in India (see Table 17), consumer’s demand
for rice will be reduced by 23% leading to an excess supply of rice that prompts a fall in supply
price. As a result import of rice gets reduced and export rises, lading to a substantial
improvement in trade balance.
Table 16: Sectoral effects of +25% preference shift towards GM rice in India
Sector Supply Output Consumer Export Import Trade Balance
Price Demand (Million USD)
Rice 3.96 21.3 24.62 -28.26 20.46 -31.29
Milk & Dairy 0.72 -0.14 -0.1 -5.01 2.46 -6.84
Processed Rice 2.71 -0.71 -0.26 -9.46 6.71 -80.09
Table 17: Sectoral effects of -25% preference shift towards GM rice in India
Sector Supply Output Consumer Export Import Trade Balance
Price Demand (Million USD)
Rice -17.04 -19.73 -23.35 122.32 -82.84 135.57

30
Milk & Dairy -1.03 0.22 0.15 7.22 -3.53 9.85
Processed Rice -1.55 0.43 0.16 5.27 -3.74 44.17
4.3.1Decomposition of Economic Welfare:
Now if we compare the welfare effects of a positive and a negative preference shifts, it is
evident that India will be better of with a positive preference shift towards GM crops as the
welfare measured in terms of EV will be enhanced by 387 million UDS (see Table 18(a)). Here
we note that, with only rice adoption the welfare effect was much higher, though with labeling
requirement it has gone down substantially. However, with a positive preference shift it has
again recovered and showed a considerable improvement from the baseline. With a negative
preference shift against GM rice the welfare will further go down and will settled much below
the baseline projection (see Table 18(b)). Thus there is a trade off with this policy scenario
between a positive trade balance and a negative welfare for consumers. If there is higher
adoption of GM rice accompanied by higher productivity shock, the situation may improve.
Table 18 (a): Decomposition of economic welfare with Positive preference shift
Country Equivalent Variation
(EV,Million USD)
Decomposition of Welfare
Allocative
Efficiency
Effect
Terms Of
Trade
Effect
Value Added
Augmenting
Technical Change
India 387.38
-170.94
350.16
541.69
Table 18 (b): Decomposition of economic welfare with negative preference shift Country Equivalent Variation
(EV,Million USD)
Decomposition of Welfare

31
Allocative
Efficiency
Effect
Terms Of
Trade
Effect
Value Added
Augmenting
Technical Change
-473.71 175.62 -498.53 541.69
4.4.3 Distributional Effects:
Table 19 (a): % change in demand for factors used in different sectors in India with preference
shifts Factor Rice
Positive preference shift Negative preference shift
Land 13.7 -20.82
UnSklab 18.33 -27.78
Sklab 18.41 -27.89
Cap 18.38 -27.85
Table 19(b): Effects of adoption of GM crops on factor income (in % change form) in India
with preference shifts
Factor Prices Rice
(real income) Positive preference shift Negative preference shift
Land 6.19 -9.05
Unskilled labor -0.49 0.73
Skilled labor -0.8 1.2
Capital -0.69 1.05
With a positive preference shift towards GM rice, to meet the rising consumer demand,
there is an increase in demand for both land and labor. As a result land prices rise. However,
with excess demand in product market, price of rice rises which in turn reduces the real income
of the laborer in rice sector marginally. Opposite happens in case of preference shift against GM
32
crops. With fall in consumer demand accompanied by a fall in output, there is a substantial
reduction in demand for all the factors of production. However, with a considerable fall in
consumer price, there is a small improvement in real income of the factors. Here also skilled
labor is better off than unskilled labor and thus the skilled-unskilled wage gap has widened.
4.4 Scenario 7: Adoption of GM rice by India in presence of ban on import of rice from India
to EU
The main reason of European Union being skeptical regarding the adoption of GM crops was
because of environmental and food safety concerns, thereby endangering the export market
prospects for adopters of the transgenic crops (Pinstrup-Andersen and Schioler, 2000; Paarlberg,
2003). As a result European Union imposed a de facto moratorium on the production and
importation of food products that may contain genetically modified organisms (GMOs) in 1998.
Though the EU replaced its moratorium in May 2004 with new regulatory arrangements, but
they involve complex and laborious segregation, identity preservation and labeling
requirements.
The perceived risks from the GM-derived foods are that they may contain toxic substances
resulting in allergies and they can alter the genome of the person or animal consuming them.
But such concerns are baseless as per the reports of the EU scientific community (European
Commission, 2001), and the report commissioned by the UK government (King, 2003, p.23).
The latter report concludes that, “the risks to human health are very low for GM crops currently
on the market” (King, 2003, p.23). A newer report, by the Food Safety Department of the UN’s
World Health Organization, concludes: “GM foods currently on the international market have
passed risk assessments and are not likely to, nor have been shown to, present risks for human
health” (WHO, 2005, p.v).They could not find any theoretical reason or empirical evidence to
suggest that GM crops can be more invasive or persistent, or toxic to soil or wildlife than
conventional crop varieties, or spread their genes to other plants. The Nuffield Council on
Bioethics also concluded in a recent discussion paper: “We do not take the view that there is
currently enough evidence of actual or potential harm to justify a blanket moratorium on either

33
research, field trials or the controlled release of GM crops into the environment.” (Thomas et al.,
2004, p.62). However, Anderson and Jackson (2006) has examined the impact of the extreme
position taken by EU regarding the adoption of GM food crops on the developing countries.
In this scenario we have assumed a hypothetical situation such that EU, being very much
skeptical about the adoption of GM foods, has put a ban on import of rice from India to EU if
India adopts GM rice.
Table 20: Sectoral effect of adoption of GM rice in presence of Import Ban from EU
Sector Supply Output Consumer Export Import Trade Balance
Price Demand (Million USD)
Rice -6.52 0.6 0.71 8.26 -32.18 9.36
Referring to table 20 we can observe that, with the imposition of import ban by EU on
Indian GM rice, India’s export will be down by substantial amount. As a result domestic
production has reduced though it is still above the baseline projection. There is marginal fall in
domestic price level. This can prompt a rise in domestic demand for rice. Since export has been
reduced significantly, domestic production is sufficient to feed the domestic demand which can
cause a fall in import as well. Fall in export has resulted in a considerable fall in trade balance.
4.4.1Decomposition of Economic Welfare:
Table 21: Decomposition of economic welfare with Import Ban on Rice
Country Equivalent Variation
(EV,Million USD)
Decomposition of Welfare
Allocative
Efficiency
Effect
Terms Of
Trade
Effect
Value Added
Augmenting
Technical Change
India 584.21
21.84
-9.01
541.69

34
As far as the economic welfare (see table 21) is concerned, India is slightly better off in
spite of the import ban. Though welfare has been reduced due to terms of trade, it is outweighed
by positive allocative efficiency effect.
4.4.3 Distributional Effects:
There is not much distributional effect of import ban by EU on India. As there is a significant
fall in export and output of rice, demand for all the factors of production falls from the scenario
where India adopts GM rice without the ban. Land price has fallen as expected. However, there
is marginal rise in the real return to the other factors of production. This may be due to the fact
that the labor and capital released by the rice sector are absorbed in some other sector where
there were demands for those factors, which is on the balance outweighed by the fall in demand
for factors in rice sector (See table 22 (a) and (b) for the distributional effects).
Table 22 (a): % change in demand for factors used in different sectors in India with import ban
from EU
Factor % change in demand for
factor
Land -3.72
UnSkilled lab -4.93
Skilled lab -4.95
Cap -4.94
Table 22(b): Effects of adoption of GM crops on real factor income (in % change form) in India
with import ban from EU
Factors of % change in Factor Prices
Production (real income)
Land -1.32
Unskilled labor 0.24
Skilled labor 0.33

35
Capital 0.29
Thus we get an interesting observation that import ban on Indian rice has no negative
welfare effect on Indian consumers, in fact it is marginally improved. However, India is losing
much of its export earning from rice.
6.5 Conclusion:
This paper has studied the overall macro-economic impact of adoption of GM cotton,
soybean, maize and rice in India using a modified GTAP model and GTAP 7 database with a
regional aggregation comprising 13 countries and 14 sectors. It tries to contribute in the
literature by exclusively focusing on India taking into account the sectors directly and indirectly
related to above GM potential crops, though the effects on other major GM producing countries
are also reported. Apart from the productivity shocks with both low and high adoption rates the
important policy scenarios considered here are: a comparison of withdrawal and imposition of
import tariff by India on vegetable oil and fat imported from other Asian countries and
introduction of labeling policy for domestically produced rice. We have also analyzed the effect
of both positive and negative preference shift towards GM food crops for Indian consumers.
Moreover, we have studied the possible effect of an import ban imposed by EU on Indian rice.
All these policies have their significant effects on the welfare of the country along with the GM
potential sectors and their allied sectors. Last but not the least we have captured the
distributional effects of all the above policies. Moreover, these results have been compared with
the situation when other countries except EU have adopted GM crops.
The productivity improvement due to GM technology adoption in India has led to an
increment in output for all the GM potential crops considered in the paper followed by a fall in
supply price. Domestic demands have also increased though less than rise in output. This has led

36
to fall in import and expansion of export registering positive trade balance. The economic
welfare measured in terms of EV has improved with adoption of each additional GM crop
though there is a considerable jump in EV with GM rice adoption. The decomposition of the
welfare shows that the major source of it is the productivity shock. As far as the other sectors in
the economy concerned, wheat, sugar and the other food crops, which use land more
intensively, have experienced higher output and a lower supply price. Other sectors which use
either of maize, soybean or rice as intermediate inputs such as animal product, milk & dairy,
vegetable oil & fat and processed rice have also gained. Now, the aspect of income distribution
gives an interesting finding. As far as income distribution is concerned, it has been observed that
the real income of both skilled and unskilled income rises with GM adoption, though maximum
income benefit accrues to the skilled labor. This highlights the importance of skilled
professionals in dissemination of GM technology. However, the skilled-unskilled wage gap has
aggravated, which is supporting the evidence documented in literature though.
The adoption of GM crops by India has some trade effects on the other countries who
are not adopting any GM food products. The major rice exporting south-east Asian giants will
lose market share to India. In textile sector also countries like Bangladesh, Pakistan, USA and
China are adversely affected in terms of trade balance. However, when these countries along
with India adopt GM crops, India loses some of its market share in rice and cotton though its
dominance in world textile market continues. The south-east Asian countries have gained the
most from the GM rice adoption whereas Brazil, other Latin American countries and sub-
Saharan African countries have also gained. As far as textile sector is concerned, China has the
possibility of gaining the most which can give tough competition to the other major textile
exporting countries in Asia and also USA. In maize sector, USA and Argentina are losing their
share to other Latin American countries and some Asian countries. The three major players in
the world soybean market i.e. USA, Argentina and Brazil have lost their market share to some
extent to China, Other Latin American countries and other Asian countries. Thus adoption of
GM crop is giving greater benefits to the Asian countries and low-income developing countries
of Latin America along with the Sub-Saharan Africa compared to the high- income developed
countries. As far as the welfare gains are concerned, China, India and South-East Asian
countries are the major gainer and their main source of gain is GM rice.

37
Turning to the policy scenarios we find, withdrawal of import tariff from vegetable oil
and fat imported from other Asian countries to India when accompanied by productivity
improvement in soybean sector will lead to significant flow of cheap import vegetable oil and
fat to India whereas the imposition of tariff will lead to obvious fall in import. With the
withdrawal of import tariff there will be significant fall in output along with a fall in price of
imported vegetable oil & fat which will lead to a fall in demand for the domestic counterpart of
the product. This will lead to rise in India’s export of vegetable oil & fat, though it will be
outweighed by large rise in import. As a result there will be considerable fall in trade balance
compared to the productivity shock scenario. On the other hand, with imposition of import
tariff, imported vegetable oil and fat will be costlier which will lead to significant rise in
demand for the domestic product. As a result there will be rise in domestic production of
vegetable oil & fat as well as a fall in export, though of insignificant amount. Since import has
been reduced to a great extent, there will be much improvement in trade balance. There is huge
welfare improvement resulting from withdrawal of import tariff from vegetable oil & fat
accompanied by fall in real income. However, opposite happens in both the cases with
imposition of tariff.
The policy of mandatory labeling which raises the production cost by 10% in domestic
rice sector will cause a fall in output and domestic demand, may be due to higher prices. This
will be accompanied by a fall in import and higher exports. Since labeling involves higher
prices and we have not considered any psychological gain from the available GM related
information from the label, there is a fall in EV in India with this policy. As far as the
distributional effects are concerned, the skilled labor has gained more than unskilled labor and
thereby widening the skilled-unskilled wage gap. In the following scenario we compare a
positive and a negative preference shift towards the domestically produced GM rice by the
Indian consumers. A positive preference shift towards GM rice will lead to an increase in
consumers demand for GM rice pushing the supply price upwards and thereby resulting in
output expansion. However, a 10% productivity shock will not be sufficient to meet this boost in
domestic demand prompting an import of rice and a cut in export. Thus further productivity
boost will be required in rice sector. On the other hand if consumers are critical about GM rice
in India, rice sector will face a reduced demand for rice leading to an excess supply of rice that
prompts a fall in supply price. This will result into contraction of import volume and expansion

38
of export, lading to a substantial improvement in trade balance. As far as the welfare gain is
concerned with positive preference shift the country is gaining whereas a negative attitude
towards GM rice reduces economic welfare. However, in case of the negative preference shift
the country has to choose between the negative social welfare and a positive trade balance. The
positive acceptances of the consumers towards GM rice will lead to a rise in land price with
higher demand for land for higher production though rise in price of rice will reduce the real
income of both skilled and unskilled laborers marginally even if there is higher demand for all
the factors of production. In case of negative preference with a fall in price level there is slight
improvement in labor income even if there is fall in demand for factors. Last but not the least; in
order to capture the negative views regarding adoption of GM technology we have analyzed a
hypothetical scenario of imposition of an import ban on Indian rice by EU. This ban will lead to
a significant fall in total export of rice by India. Domestic production will also fall but it will be
sufficient to meet the domestic demand. As a result there will be fall in import as well with an
overall fall in trade balance. However, India will be slightly better off in terms of the economic
welfare and there will be marginal rise in real return to both skilled and unskilled labor.
Thus the macroeconomic overview of various scenarios gives an overall promising
future of India if it adopts the above GM crops. With higher adoption rate of course the benefits
will be higher. This analysis, of course, has taken recourse to the environmentally sustainable
and human health enhancing positive attributes of Genetically Modified food crops, though we
acknowledge that there is a school of thought which has strong reservation against the
commercial production of such crops. Both the views, however, are well supported in the
literature.
6. Appendix:
6.1 GTAP Model:
In the GTAP model the firm’s production structure is characterized by Constant
Elasticity of Substitution functional forms to combine intermediate inputs and primary factors of
production such as land, natural resources, skilled and unskilled labor and capital. Intermediate
inputs are composites of foreign and domestically produced components. International trade is

39
characterized by Armington specification (Armington 1969) such that foreign components of
intermediate goods are differentiated by region of origin. Thus firms can decide the sources of
their imports and based on the composite import price they decide on the optimal mix of the
domestic and imported inputs. On factor market, full employment is assumed with labor and
capital being mobile within the countries but immobile internationally. Natural resources are
only used in non-agricultural primary industries and land is specific to agricultural usage. The
mobility of these factors is determined by a Constant Elasticity of Transformation revenue
function (Powell and Gruen 1968). Land has a negative unitary value of CET whereas natural
resource has the value of -0.001. The greater the absolute value of CET, the greater will be the
mobility of the factor and hence the extent to which the rental rates across alternative uses move
together.
On the demand side of the GTAP model, each region is comprised of a representative
household who disposes of the entire regional income according to a Cobb-Douglas utility
function specified over three forms of final demand such as private household expenditure,
government expenditure and savings. Now, private household expenditure is defined over a
Constant Difference of Elasticity (CDE) demand system that permits different price and income
responsiveness across countries (MacDougall 2003).
Moreover, there is an explicit treatment for international trade and transport margins and
a global banking sector intermediates between global savings and consumption. The model
determines trade balance in each region endogenously and hence foreign capital inflow may
supplement regional domestic savings.
The closure of the model is of general neo-classical general equilibrium type with saving
investment equality and clearance of the factor markets. It ensures endogenous wages and full
employment of all the resources. Each of the economic relationships described in the model are
based on literature reviews and econometric estimates.
A.2 Modifications in the present model: 1. We have incorporated a new exogenous variable named labeling cost (lbc) in the
equation that links the domestic market and the firm prices. The new equation becomes: pfm (i,j,r) = tfm (i,j,r) + pim (i,r) + lbc (i,j,r) 2. Following Neilsen and Anderson (2001) (GMOs, Trade policy and Welfare in Rich
and poor countries) we have incorporated preference shift parameters in the behavioral relations

40
of producers and households. The original model has a set of equations that describe the individual producing sector’s demand for domestically and imported intermediaries respectively. A sector j in region s uses intermediate input i which can either be imported or domestically produced. The following two equations determine the j th sector’s demand for imported and domestically produced intermediate input qfm (i, j,s) and qfd (i, j,s) respectively.
(1) qfm (i, j,s)= qf (i,j,s) -ϒ(i )* [pfm (i,j,s)-p f(i,j,s)] + ffm (i,j,s)
(2) qfd (i, j,s)= qf (i,j,s) -ϒ(i )* [pfd (i,j,s)-p f(i,j,s)] + ffd (i,j,s) (3) pf (i,j,s )= FMSHR (i,j,s)* pfm (i,j,s)+ [1- FMSHR (i,j,s)] * pfd (i,j,s) In the first two equations two preference shift parameters have been included which are
ffm (i,j,s) and ffd (i,j,s). ffm (i,j,s) = 25 implies a 25% increase in the demand for imported
intermediary i in sector j in region s whereas ffd (i,j,s)= -25 implies a reduction in the demand for domestically produced intermediary i.
The following are the behavioral relations for private household and the public sector:
(4) qpm (i,s)= qp (i,s) - ϒ(i )* [ppm (i,s)-pp (i,s)] + fpm (i,s)
(5) qpd (i,s)= qp (i,s) - ϒ(i )* [ppd (i,s)-pp(i,s)] + fpd (i,s) (6) pp (i,s)= PMSHR (i,s) * ppm (i,s)+ [1- PMSHR (i,s)] * ppd (i,s)
(7) qgm (i,s) = qg (i,s) - ϒ(i )* [pgm (i,s)-pg (i,s)]+ fgm (i,s)
(8) qgd (i,s) = qg (i,s) - ϒ(i )* [pgd (i,s)-pg (i,s)]+ fgd (i,s) (9) pg (i,s)= GMSHR (i,s) * pgm (i,s) + [1- GMSHR (i,s)]* pgd (i,s) Above equations have two dimensions and contain preference shift parameters as earlier
equations. References
Anderson, K., and L.A. Jackson (2005a). Some Implications of GM food technology policies for
Sub-Saharan Africa. Journal of African Economics 14(3): 385-410.
Anderson, K., and L.A. Jackson (2005b). GM crop technology and trade restraints: economic
implications for Australia and New Zealand. Journal of Agricultural and Resource Economics 49:
263-281.
Anderson, K., and S. Yao. 2003. China, GMOs and World trade in agriculture and textile products.
Pacific Economic Review 8: 157-169.
41
Anderson. K., C.P. Nielson., and S. Robinson.2002. Estimating the economic effects of GMOs:
The importance of policy choices and preferences. In Evenson, R.E., V. Santaniello., and D.
Zilberman. (eds), Economic and Social Issues in Agricultural Biotechnology. CAB International,
London.
Anderson., K., and L.A. Jackson (2006). Transgenic crops, EU precautions and developing
countries. International Journal of Technology and globalization. Vol 2 (1/2): 65-80.
Anderson., K., E. Valenzuela and L.A. Jackson. 2006. GM cotton adoption, recent and prospective:
A global CGE analysis of economic impacts. World Bank Policy Research Working Paper No.
3917.
Anderson., K., L.A. Jackson., and C.P. Nielson (2004). Genetically Modified Rice Adoption:
Implications for Welfare and Poverty Alleviation. World bank Policy research Working Paper.
WPS 3380.
Armington.P.S., 1969. A Theory of Demand for Products Distinguished by Place of Production.
International Monetory Fund Staff Paper 16: 159-176.
Badri Narayanan G. and Terrie L. Walmsley, (Ed). 2008. Global Trade, Assistance, and Production:
The GTAP 7 Data Base, Center for Global Trade Analysis, Purdue University.
Deodhar ., Y. S., and S. Ganesh and W.S. Chern (2008) Emerging Markets for GM foods: An
Indian perspective on consumer understanding and willingness to pay. International Journal of
Biotechnology. 2008. Vol 10(6): 570-587.
Elbehri, A., and S. MacDonald. 2004. Estimating the impact of Bt cotton in west and central Africa:
A general equilibrium approach. World Development 32 (12): 2049-2064.
European Commission (2001) GMOs: Are There Any Risks?, Press Release by Research
Directorate-General European Commission, October 8, available at http://europa.eu.int/
comm./research/press/2001/pr0901en.html.

42
Gruere. G., A. Bouet., and S. Mevel.2007. Gene tically Modified Food and International Trade: The
Case of India, Bangladesh, Indonesia and the Philippines. IEPRI Discussion Paper 740.
Gruere., G. and S.R. Rao (2007). A Review of International Labeling Policies of Genetically
Modified Food to Evaluate India’s Proposed Rule. AgBioforum, Vol 10(1): 51-64.
Gruere., G., 2007. Labeling Policies of Genetically Modified Food: Lessons from an
International Review of Existing Approaches. PBS, IFPRI Policy Brief 7.
Hareau, G.G., G.W. Norton, B.F. Mills, and E. Peterson. 2005. Potential benefits of transgenic rice
in Asia: A general equilibrium analysis. Quarterly Journal of International Agriculture 44(3): 229-
146.
Hertel. T. W. (Ed). 1997. Global Trade analysis: Modelling and Applications. Cambridge university
Press.
Huang, J., R. Hu., H. Meijl., F. Tongeren. 2004. Biotechnology boosts to crop productivity in
China: trade and welfare implications. Journal of Development Economics 75, 27-54.
Huff. M.K., and T.W. Hertel (2000) Decomposing welfare changes in GTAP model. GTAP
technical paper no. 5.
James, Clive. 2006. Global Status of Commercialized Biotech/GM Crops: 2006. ISAAA Brief No.
35. ISAAA: Ithaca, NY.
James, Clive., 2007. Global Status of Commercialized Biotech/GM crops: ISAAA brief 37, ISAAA:
Ithaca, NY.
James, Clive., 2008. Global Status of Commercialized Biotech/GM crops: ISAAA brief 39,
ISAAA: Ithaca, NY.

43
King, D.K. (2003) GM Science Review: First Report, Prepared by the GM Science Review
Panel under the chairmanship of Sir David King for the UK Government, July.a, NY.
MacDougall. R., 2003. A new regional household demand system for GTAP. GTAP Technical
Paper No.20. Purdue University. Available at: http://docs.lib.purdue.edu/gtaptp/20.
Nielson., C.P., and K. Anderson 2001. GMOs, trade policy, and welfare in rich and poor countries.
In Quantifying the Impact of Technical Barriers to Trade. Ed. J. Maskus, and J. Wilson. Ann Arbor:
University of Michigan Press.
Paarlberg, R.L. (2003) The Politics of Precaution: Genetically Modified Crops in Developing
Countries, Johns Hopkins University Press, Baltimore.
Pinstrup-Andersen, P. and Schioler, E. (2000) Seeds of Contention: World Hunger and the
Global Controversy Over GM Crops, Johns Hopkins University Press, Baltimore.
Powell A.A. and F.G.H. Gruen., 1968.The constant elasticity of transformation production
frontier and linear supply system. International Economic Review. Vol. 9(3): 315-328.
Smale, M.,P. Zambrano., J. Falck., G. Gruere. (2006). Parables: Applied Economics literature about
the impact of genetically engineered varieties in developing economies: EPT Discussion paper 158.
International Food Policy Research Institute.
Thomas, S. et al. (2004) The Use of Genetically Modified Crops in Developing Countries,
Nuffield Council on Bioethics, London.
WHO (2005) Modern Food Biotechnology, Human Health and Development: An Evidence-
based Study, World Health Organization, Geneva, June.

44