unit 9 data processing - coding, tabulation and …...the survey data collected from the field...
TRANSCRIPT

Data Processing and Analysis
UNIT 9 DATA PROCESSING - CODING, TABULATION AND DATA PRESENTATION
Objectives
After studying this unit you should be able to:
distinguish between two types of editing •
•
•
•
•
•
design the coding scheme for a questionnaire
classify the data according to attributes or numerical characteristics and
differentiate between simple and manifold classification of data
present the data in the forms of tables and graphs
put the data in the form of frequency distribution
Structure
9.1 Introduction
9.2 Editing of Data
9.3 Coding of Data
9.4 Classification of Data
9.5 Statistical Series
9.6 Tables as Data Presentation Devices
9.7 Graphical Presentation of Data
9.8 Summary
9.9 Self -Assessment Questions
9.10 Further Readings
9.1 INTRODUCTION The survey data collected from the field should be processed and analyzed as indicated in the research plan. Data processing primarily involves editing, coding, classification and tabulation of data, so that it becomes amenable for data analysis. This unit concentrates on various aspects of data processing. The processing of data can either be in the form of tables or in the form of' graphs. These aspects have been widely covered in unit 6, block 2 of the course on Quantitative Analysis for Managerial Applications (MS-8). You are therefore advised to go through it before reading this unit.
9.2 EDITING OF DATA The editing of data is a process of examining the raw data to detect errors and omissions and to correct them, if possible, so as to ensure legibility, completeness, consistency and accuracy. The recorded data must be legible so that it could he coded later. An illegible response may be corrected by getting in touch with people who recorded it or alternatively it may be inferred from other parts of the question. Completeness involves that all the items in the questionnaire must be fully completed. If some questions are not answered, the interviewers may be contacted to find out whether he failed to respond to the question or the respondent refused to answer the question. In case of former, it is quite likely that the interviewer will not remember the answer. In such a case the respondent may be contacted again or alternatively this particular piece of data may be treated as missing data. 16

It is very important to check whether or not respondent is consistent in answering the questions. For example there could a respondent claiming that he makes purchases by credit card may not have one.
17
Data Processing- Coding, Tabulation and Data
Presentation
The inaccuracy of the survey data may be due to interviewer bias or cheating. One way of spotting is to look for a common pattern of responses in the instrument of a particular interviewer.
Apart from ensuring quality data this will also facilitate in coding and tabulation of data. In fact, the editing involves a careful scrutiny of the completed questionnaires.
The editing can be done at two stages:
1. Field Editing, and
2. Central Editing.
Field Editing : The field editing consists of review of the reporting forms by the investigator for completing or translating what the latter has written in abbreviated form at the time of interviewing the respondent. This form of editing is necessary in view of the writing of individuals, which vary from individual to individual and sometimes difficult for the tabulator to understand. This sort of editing should be done as soon as possible after the interview, as it may be necessary sometimes to recall the memory. While doing so, care should be taken so that the investigator does not correct the errors of omission by simply guessing what the respondent would have answered if the question was put to him.
Central Editing: Central editing should be carried out when all the forms of schedules have been completed and returned to the headquarters. This type of editing requires that all the forms are thoroughly edited by a single person (editor) in a small field study or a small group of persons in case of a large field study, The editor may correct the obvious errors, such as an entry in a wrong place, entry recorded in daily terms whereas it should have been recorded in weeks/months, etc. Sometimes, inappropriate or missing replies can also be recorded by the editor by reviewing the other information recorded in the schedule. If necessary, the respondent may be contacted for clarification. All the incorrect replies, which are quite obvious, must be deleted from the schedules.
The editor should be familiar with the instructions and the codes given to the interviewers while editing. The new (corrected) entry made by the editor should be in some distinctive form and they be initialed by the editor. The date of editing may also be recorded on the schedule for any future references.
Activity 1
Define the following.
a) Field Editing. ..............................................................................................................................................................................................................................................................................................................................................................................................................................................................................................................
b) Central Editing. ...............................................................................................................................................................................................................................................................................................................................................................................................................................................................................................................
Activity 2
A marketing research organization is conducting a survey to determine the consumption pattern of food items by households in Delhi. You are the head of computer division responsible for editing the raw data from the questionnaires and analyzing the same. A filled up set of questionnaires have been sent to you. List out the points on which you would like to concentrate while editing the raw data.

.........................................................................................................................................
.........................................................................................................................................
.........................................................................................................................................
.........................................................................................................................................
18
Data Processing and Analysis
9.3 CODING OF DATA
Coding is the process of assigning some symbols (either) alphabetical or numerals or (both) to the answers so that the responses can be recorded into a limited number of classes or categories. The classes should be appropriate to the research problem being studied. They must be exhaustive and must be mutually exclusive so that the answer can be placed in one and only one cell in a given category. Further, every class must be defined in terms of only one concept.
The coding is necessary for the efficient analysis of data. The coding decisions should usually be taken at the designing stage of the questionnaire itself so that the likely responses to questions are pre-coded. This simplifies computer tabulation of the data for further analysis. It may be noted that any errors in coding should be eliminated altogether or at least be reduced to the minimum possible level.
Coding for an open-ended question is more tedious than the closed ended question. For a closed ended or structured question, the coding scheme is very simple and designed prior to the field work. For example, consider the following question.
•
•
•
−
−
−
−
What is your sex?
Male Female
We may assign a code of `0' to male and `1' to female respondent. These codes may be specified prior to the field work and if the codes are written on all questions of a questionnaire, it is said to be wholly precoded.
The same approach could also be used for coding numeric data that either are not be coded into categories or have had their relevant categories specified. For example,
What is your monthly income?
Here the respondent would indicate his monthly income which may be entered in the relevant column. The same question may also be asked like this:
What is your monthly income?
< Rs. 5000
Rs. 5000 - 8999
Rs. 13000 – 12999
Rs. 13000 or above.
We may code the class less than Rs.5000' as ,1', Rs. 5000 - 8999' as `2', `Rs. 9000 - 12999' as `3' and `Rs. 13000 or above' as `4'.
Coding of open-ended questions is a more complex task as the verbatism responses of the respondents are recorded by the interviewer. In what categories should these responses be put to? The researcher may select at random 60-70 of the responses to a question and list them. After examining the list, a decision is taken to what categories are appropriate to summarize the data and the coding scheme for categorized data as discussed above is used-A word of caution-that while classifying the data into various categories we should keep provision for "any other" to include responses which may not fall into our designated categories.
It may be kept in mind that the response categories must be mutually exclusive and collectively exhaustive.
19
Data Processing- Coding, Tabulation and Data
Presentation
•
•
•
•
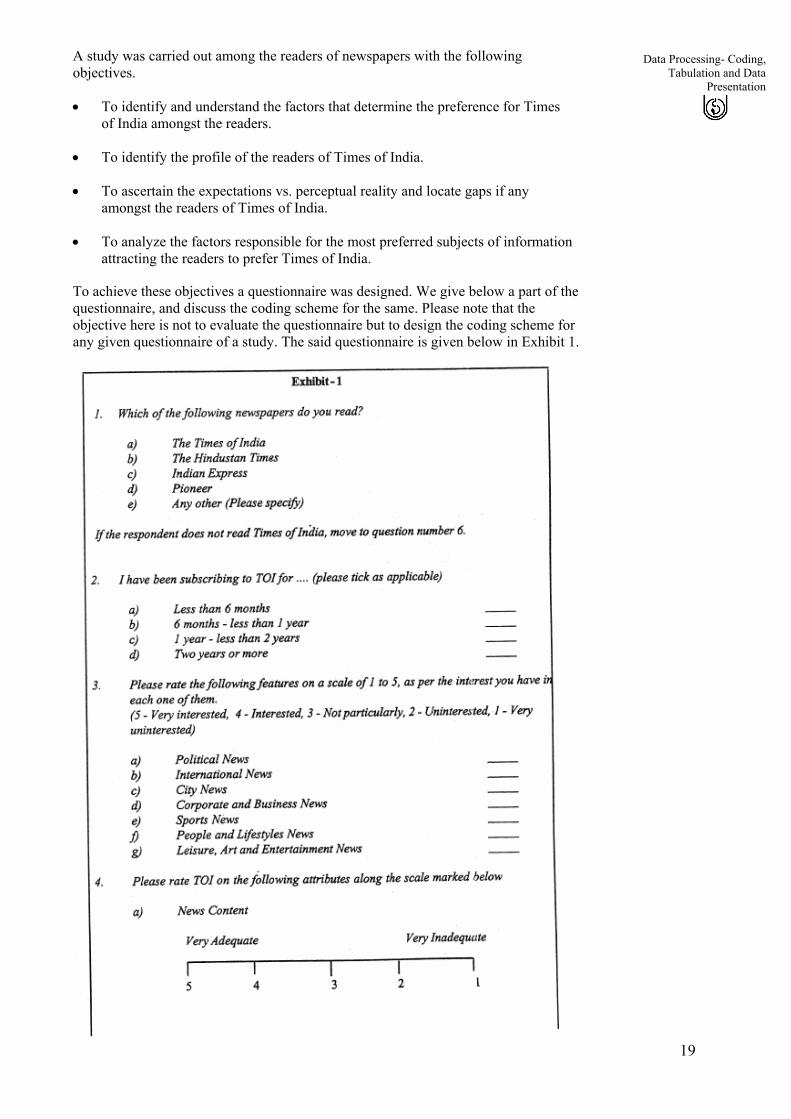
A study was carried out among the readers of newspapers with the following objectives.
To identify and understand the factors that determine the preference for Times of India amongst the readers.
To identify the profile of the readers of Times of India.
To ascertain the expectations vs. perceptual reality and locate gaps if any amongst the readers of Times of India.
To analyze the factors responsible for the most preferred subjects of information attracting the readers to prefer Times of India.
To achieve these objectives a questionnaire was designed. We give below a part of the questionnaire, and discuss the coding scheme for the same. Please note that the objective here is not to evaluate the questionnaire but to design the coding scheme for any given questionnaire of a study. The said questionnaire is given below in Exhibit 1.

20
Data Processing and Analysis

21
Data Processing- Coding, Tabulation and Data
Presentation
•
•
•
•
•
•
Let us design the coding scheme for the questionnaire given in exhibit 1. We note that question number 1 may have multiple responses because a respondent could read one or more than one newspapers. There are 5 alternatives assigned for question number 1 and therefore we will use five columns in the data matrix to record the responses of this question. If the respondent reads Times of India we code it a value 1 otherwise O. Similarly it is done for the remaining newspapers. However, if there is a respondent who read Times of India and Indian Express we will code question la and lc having a value of I and for the remaining parts namely b, d and e the coded value will be 0.
For question number 2, the respondent can choose only one of the four alternatives. Therefore one single column is required to record the responses of the respondents. The response categories are mutually exclusive and collectively exhaustive. Whichever category is chosen by the respondent that is coded 1 and the remaining are coded O.
Question number 3 has seven parts and the respondent is to rate each one of them on a 5-point scale ranging from 1 to 5. Therefore a total of seven column is required to record the responses of the respondent. Suppose the respondent rates-International News as 4 the value of 4 should be assigned to question number 3b and so on.
There are five attributes of Times of India mentioned in question number 4 and the respondent is assigned the job of rating each of them on a scale of I to 5. Therefore five columns are required to record the responses of this question. Suppose for question 4c (Weekend Supplements) the rating of the respondent is 2, and the same will be shown in the coding book corresponding to this question.
There are six features of Times of India mentioned in question number 5 and labeled as 5a to 5f. The respondent is to rank them from 1 to 6 with regards to the importance it gives to each of these features. Therefore we need six columns for this. Suppose the rating is 2, 3, 6, 1, 4 & 5 for questions numbering 5a to 5f respectively. The same numbers would appear on the coding sheet corresponding to this question.
Question number 6 is divided into five parts. For each of the part one separate column is required. 6a indicates the age of the respondent which will be indicated as per the data revealed by the respondent. Question 6b is concerning the sex of the respondent. Here male respondents are coded as 1 whereas female respondents are coded as O. Question 6c indicates the total number of members in the household. Question 6d is concerned with the occupation of the respondent, Question 6e mention the monthly income of the household put in categorized form. Here the responses are mutually exclusive and collectively exhaustive. If the respondent has a monthly income of less than 5000 rupees, the response is coded as 1, if monthly income is between 5001-10000 rupees, it is coded as 2, in case it is between 10001- 15000; the code is 3. From 15001-20000; the code is 4, 20001-25000; the code is 5 and above 25000; the code is 6: The above discussion can be shown below in the form of a code book.

22
Data Processing and Analysis
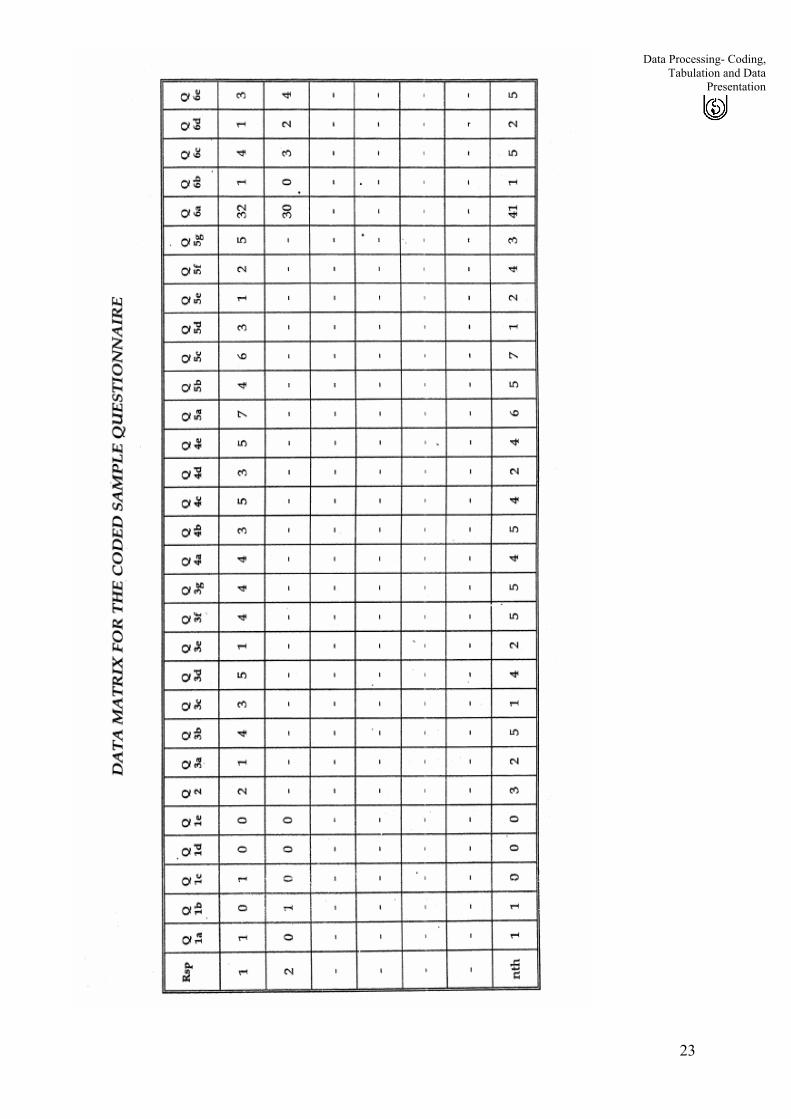
The data matrix corresponding to the above coding scheme is shown in the table given below:
23
Data Processing- Coding, Tabulation and Data
Presentation

24
Data Processing and Analysis
The above table indicates that the respondent number I reads both Times of India and Indian Express and no other newspaper. This is indicated by code 1 corresponding to question la and is and for the remaining parts of questions 1 a `0' is indicated. Question number 2 indicates that the respondent is reading Times of India from 6 to 12 months. The rating of various features of a newspaper in terms of the interest he has in them is indicated by responses indicated in questions 3a to 3g. The respondent is not very uninterested in critical news, interested in international news, not particular about city news, very interested in corporate and business news, very uninterested in sports news and interested in people and lifestyle news; and leisure art and entertainment news. The respondent rates Times of India on five attributes. He can give a possible rating of Times of India on various attributes on a scale of 1 to 5 where 1 is on extremely unfavorable side whereas 5 represents extremely favourable side. He has rated Times of India on news content as 4, editorial as 3, weekend supplements as 5, weekdays supplements as 3 and layout as 5. However, his ranking of how various features are important to him on 1 to 7 scale, where 1 represents very important and 7 the least important is indicated in question 5. As per the respondent, classified advertisements are ranked the least, weekdays supplements get a rank of 4, number of pages get a rank of 6, advertisement; a rank of 3, news content; a rank of 1, weekend supplements; a rank of 2, and layout; a rank of 5. The respondent is of 32 years of age and is a male as indicated by a code of 1 to question 6b. There are four members in his household. His occupation is business and has a monthly income between Rs. 10001 to 15000 as indicated by code 3 for question 6c.
Respondent 2 does not read Times of India. In fact the respondent is a reader of Hindustan Times and no other newspaper and therefore the questions mentioned in questions numbering 6 are asked to the respondent. The respondent is 30 years of age, and a female as indicated by code 0 for question 6b. The respondent has 3 family members, is a professional and have monthly income between 15001 - 20000 rupees as indicated by code 4 corresponding to 6c.
Activity 3
Describe the characteristics of nth respondent as given in data matrix.
.........................................................................................................................................
.........................................................................................................................................
........................................................................................................................................
9.4 CLASSIFICATION OF DATA In most research studies, voluminous raw data collected through a survey need to be reduced into homogeneous groups for any meaningful analysis. This necessitates classification of data, which in simple terms is the process of arranging data in groups or classes on the basis of some characteristics. Classification condenses the data, facilitates comparisons, helps to study the relationships and facilitates in statistical treatment of data. The classification should be unambiguous and mutually exclusive and collectively exhaustive. Further, it should not only be flexible but also suitable for the purpose for which it is sought.' Classification can either be according to attributes or numerical characteristics.
1. Classification According to Attributes: To classify the data according to attributes we use descriptive characteristics like sex, caste, education, user of a product etc. The descriptive characters are the one which can not be measured quantitatively. One can only talk in terms of its presence or absence. The classification according to attributes may be of two types. i) Simple Classification: In the case of simple classification each class
is divided into two sub classes and only one attribute is studied viz, user of a product or non-user of a product, married or unmarried, employed or unemployed, Brahmin or non-Brahmin etc.
ii) Manifold Classification: In the case of manifold classification more than one attributes are considered. For example, the respondents in a survey may be classified as user of a particular brand of a product and non-user of particular brand of product. Both user and non-user can be further classified into male and female. Further one can classify male and female into

25
Data Processing- Coding, Tabulation and Data
Presentation

26
Data Processing and Analysis
two categories such as below 25 years of age and 25 and more years of age. We can further classify them as professionals at non-professionals. This way one can keep on adding more attributes. This is shown in Figure - 1. However, the addition of a particular attribute (process of sub-classification) depends upon the basic purpose for which the classification is required. The objectives of such a classification has to be clearly spelt out.
2. Classification According to Numerical Characteristic: When the observations possesses numerical characteristics such as sales, profits, height, weight, income, marks, they are classified according to class intervals. For example, persons whose monthly income is between Rs. 2001 and Rs. 3500 may-form one group, those whose income is within Rs. 3501 and Rs. 7000 may form another group, and so on. In this manner, the entire data may be divided into a number of groins or classes, which are usually called class-intervals. The number of items in each class is called the. Frequency of the class. Every class has two limits: an upper limit and a lower limit, which are known as class limits. The difference between these two limits is called the magnitude of the class or the width of the class interval. The class intervals may be formed by using inclusive and exclusive method. Suppose we have the class intervals such as 10 - 15, 16 - 21, 22 - 27 etc. Such a class interval is an example of inclusive method because both the lower and upper limit are included in the class. If the variable X falls in the first class interval, it can take values like 10 = X >=15. The class intervals like 10 - 15, 15 - 20, 20 -
25 etc. form an example of exclusive class interval since the lower limit is included whereas the upper limit is excluded from the class interval. The variable X if falling in the first class interval, would take values as 10 X <
15. As an illustration of how the data can be classified into class intervals using inclusive and exclusive method, we may consider the following example.
Example: Following data refers to the sales of a company for the 40 quarters. Tabulate the data using the inclusive method.
Qtr. Sales Qtr. Sales Qtr. Sales Qtr. Sales
1 1060 11 1255 21 1690 31 1200
2 2125 12 1190 2 2130 32 2190
3 1440 13 870 23 1870 33 1800
4 1940 14 1460 24 1875 34 2255
5 2060 15 2125 25 1650 35 2000
6 1310 16 750 26 945 36 1060
7 2120 17 1120 27 2240 37 1370
8 2560 18 2000 28 1700 38 2375
9 2250 19 1750 29 1165 39 1470
10 2135 20 .1760 30 1945 40 2250

We will be using the data given above. We form five class intervals each of width 370. These are inclusive class intervals in the sense that the variable X could take any value between the lower and upper limit in such a way that both ends of the interval could be covered under this. The class intervals alongwith the number of items in each class interval is shown in the table below:
27
Data Processing- Coding, Tabulation and Data
Presentation
Activity 4
A survey was conducted to estimate the expenditure of households on entertainment. The data on a number of variable was collected. One of the variable of interest being monthly income. A sample of 60 respondents gave the following data on monthly household income. Use the data to form class interval using exclusive method.
Rsp Inc Rsp Inc Rsp Inc Rsp Inc Rsp Inc Rsp Inc
1 4560 11 4200 21 6700 31 115,00 41 1040p 51 7100
2 9824 12 5432 22 11660 32 7342 42 4660 52 e 6200
3 7336 13 98570 23 4050 33 8956 43 9876 53 65345
4 5874 14 10560 24 7890 34 4322 44 5656 54 5768
5 12000 15 12000 25 8845 35 6798 45 8888 55 7880
6 10660 16 10095 26 4560 36 4789 46 6999 56 4665
7 11650 17 6790 27 4824 37 5432 47 7645 57 5668
8 4465 18 7780 28 7366 38 98570 48 7891 58 8655
9 5378 19 5430 29 .4874 39 10560 49 9800 59 5475
10 8765 20 4400 30 11200 40 9000 50 4050 60 11671
……………………………………………………………………………………………………………………………………………………………………………………………………………………………………………………………………………………………………………………………………………………………………………………………………………………………………………………………………
28
Data Processing and Analysis
9.5 STATISTICAL SERIES
A series is defined as a logical or systematic arrangement of observations or items. Whet the attributes or things are counted, measured or weighed and arranged in an orderly manner, say either descending or ascending order, they constitute a series. When the statistical data pertains to time, the series is said to be historical or time series. The important factor in such series is the chronology. In time series data, the time difference between any two observations must be same. It could be hour, minute, week, month, quarter, year etc. The data presented in following table on sales forms a time series data
Year 1986 1987 1988 1989 1990 1991 1992 1993 1994 1995
Sales (Rs. lass) 60 75 68 74 82 73 91 96 90 102
When the data pertains to space, the series is referred to as special, and is also known as geographical series. When the data refers to physical conditions such as height, weight, age, etc., the series is referred to as condition series. The following series, for example, refers to special series of regionwise sales of a firm during 1989-90.
Region Sales (Rs. in lakhs)
Northern 135.00
North-eastern 56.00
Southern 85.00
Central 76.00
Western 163.00
Eastern 68.00
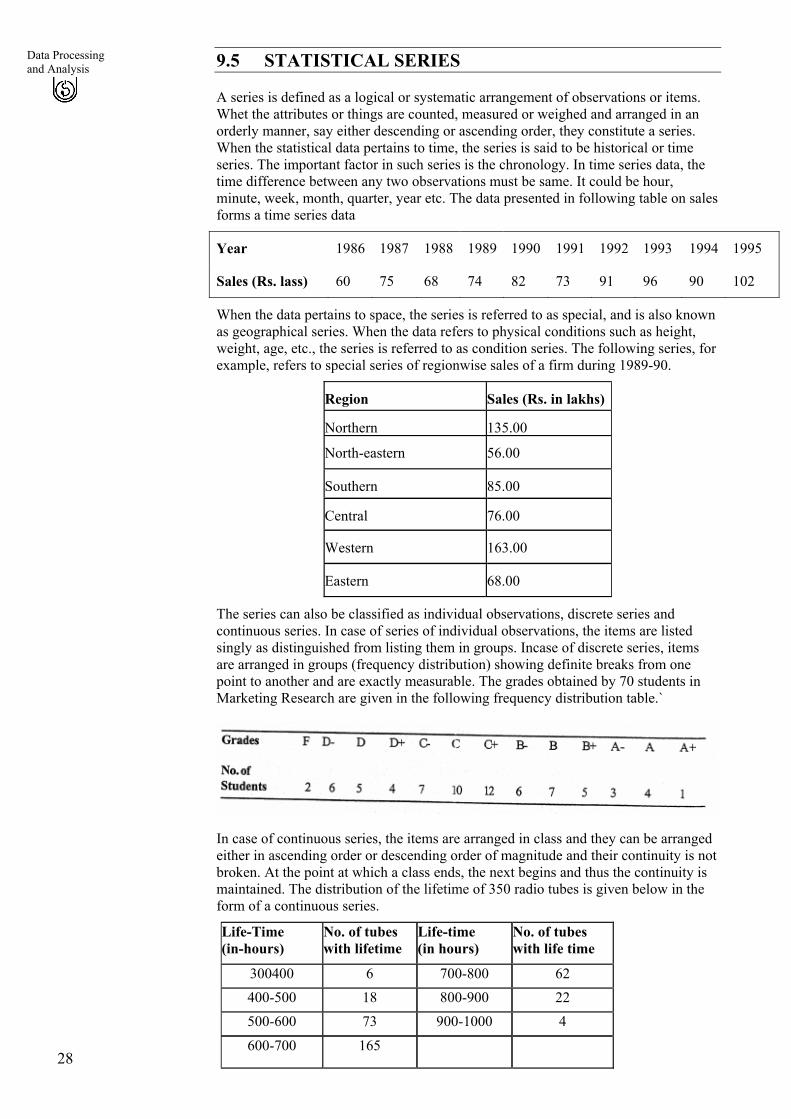
The series can also be classified as individual observations, discrete series and continuous series. In case of series of individual observations, the items are listed singly as distinguished from listing them in groups. Incase of discrete series, items are arranged in groups (frequency distribution) showing definite breaks from one point to another and are exactly measurable. The grades obtained by 70 students in Marketing Research are given in the following frequency distribution table.`
In case of continuous series, the items are arranged in class and they can be arranged either in ascending order or descending order of magnitude and their continuity is not broken. At the point at which a class ends, the next begins and thus the continuity is maintained. The distribution of the lifetime of 350 radio tubes is given below in the form of a continuous series.
Life-Time (in-hours)
No. of tubes with lifetime
Life-time (in hours)
No. of tubes with life time
300400 6 700-800 62 400-500 18 800-900 22 500-600 73 900-1000 4
600-700 165

Activity 5
29
Data Processing- Coding, Tabulation and Data
Presentation
Collect the data on the salaries of the employees in your organisation and develop a continuous series for the data you have collected. ........................................................................................................................................................................................................................................................................................................................................................................................................................... Activity 6 Stale what labels you will attach to the following series of data. i) Density of population (per sq. Ian in different cities of India) ............................................................................................................................ ii) Number of defective items produced by machine per week ……………………………………………………………………………….. iii) Population of workers classified as male, female and further classification is
based on their being vegetarian or non-vegetarian. ……………………………………………………………………………….
9.6 TABLES AS DATA PRESENTATION DEVICES Statistical data can be presented in the form of tables and graphs. In the tabular foam, the classification of data is made with reference to time or some other variables. The graphs are used as a visual form of presentation of data. The tabulation is used for summarization and condensation of data. It aids in analysis of relationships, trends and other summarization of the given data. The tabulation may be simple or complex. Simple tabulation results in one-way tables, which can be used to answer questions related to one characteristic of the data. The complex tabulation usually results in two way tables, which give information about two interrelated characteristics of the data; three way tables which give information about three interrelated characteristics of data; and still higher order tables, which supply information about several interrelated characteristics of data. Following are the important characteristics of a table: i)
ii) iii)
iv) v)
vi)
vii) viii)ix) x)
xi)
Every table should have a clear and concise title to make it understandable without reference to the text. This title should always be just above the body of the table. Every table should be given a distinct number to facilitate easy reference. Every table should have captions (column headings) and stubs (row headings) and they should be clear and brief The units of measurements used must always be indicated. Source or sources from where the data in the table have been obtained must be indicated at the bottom of the table. Explanatory footnotes, if any, concerning the table should be given beneath the table alongwith reference symbol. The columns in the tables may be numbered to facilitate reference.
Abbreviations should be used to the minimum possible extent. The tables should be logical, clear, accurate and as simple as possible. The arrangement of the data categories in a table may be a chronological, geographical, alphabetical or according to magnitude to facilitate comparison. Finally, the table must suit the needs and requirements of the research study.
Activity 7 Construct a table showing the number of letters sent by ordinary male, registered post and through courier in your organisation for the last 10 years. Also show the number of inland and overseas letters.
………………………………………………………………………………………………………………………………………………………………………………………………………………………………………………………………………………

Activity 8
30
Data Processing and Analysis
You are working in a company dealing with exports of readymade-garment§. Prepare a table showing the exports to various countries for the financial year 1997-98.
.........................................................................................................................................
.........................................................................................................................................
.........................................................................................................................................
........................................................................................................................................
9.7 GRAPHICAL PRESENTATION OF DATA
Several types of graphs -r charts are used to present statistical data. Of them; the following are commonly used: bar chart, two dimensional diagrams, pictograms, pie charts and arithmetic chart or line chart. Several of these have been discussed in detail in Unit 6, (Presentation of data), Block 2 (Data Collection and Analysis) of Quantitative Analysis of Managerial Applications (MS-8). You may therefore refer to the said study material. Therefore, charts and graphs not covered are discussed below.
1. Two dimensional diagrams: The commonly used two dimensional diagrams are rectangular diagrams and squares. In rectangular diagrams the rectangles are used to present the data in the graphic form. These diagrams are used for comparing two sets of data. The height of the rectangle is proportional to the ratio of the data which bear to each other in a given series and the width of the rectangle varies in proportion to the aggregate. Before constructing the rectangular diagram, the data is converted into percentages. A rectangular diagram to the data on household expenditures of various items by two families A and B is given below.
Family A Family B Items Expenditure % Expenditure %
Food 2000 50 3000 50
Clothing 480 12 750 12.5
Education 320 8 400 6.67
House Rent 400 10 750 12.5
Miscellaneous 800 20 1100 18.3
Total 4000 100 6000 100
The above data is presented below in two-dimensional diagram. In this diagram the width of the rectangles for family A to that of family B is taken in the proportion of 2: 3.

When the difference between two quantities is very large, one bar would become too big and the other too small in a rectangular diagram. To overcome this difficulty, squares are used to present the data. The size of the square is the square roots of the given data.
31
Data Processing- Coding, Tabulation and Data
Presentation
2. Pictograms:- In this form of presentation, data are represented by a picture. For example, population figures are presented by the picture of a human being, production figures of, say motorbikes, is presented by the picture of a motorbike, cattle population by a picture of a cattle and so on. The following figure presents a pictograph showing the students on roll at the school/university level for the year 1996-97 and 1997-98.
3. Pie Chart: In a pie chart, different segments of a circle represent percentage contribution of various components to the total. It brings out the relative importance of various components of data. For drawing a pie chart, we construct a circle of any diameter and then the circle is broken into a desired number of segments, angle 3600 representing 100 percent. The expenditure on various commodities by two families A and B is given in the following table:

Monthly Expenditure on Various Commodities by Two Families (Figures in Rupees)
32
Data Processing and Analysis
Type of Commodity Family A Family B
Food 3000 5000
Rent 2000 3500
Clothes 1250 250
Education 1100 225
Miscellaneous 750 1250
Savings. 900 1500
The various items are converted into corresponding degrees using the fact that the sum total of degrees in the circle equals 360. The degrees for various items corresponding to family A and B is given below:
Type of Commodity Family A Family B
Food 120.000 112.500
Rent 80.000 78.750
Clothes 50.000 56.250
Education 44.000 50.625
Miscellaneous 30.000 28.125
Savings. 36.000 33.750
Total 360.000 360.000
The pie chart corresponding to the figures given in the above table is shown below

33
Data Processing- Coding, Tabulation and Data
Presentation
4. Line or Arithmetic Chart: The line or arithmetic chart is used to identify the changes or the trend that exist in a series of data. The data on export sales of a company between 1997-98 and 1996-97 is presented below in the form of a line chart. This data is given in the following table:
Years 87-88 88-89 89-90 90-91 91-92 92-93 93-94 94-95 95-96 96-97
Sales (Rs. lacs)
10.4 12.3 11.6 11.9 13.2 14.1 14.6 14.9 15.4 16.2
Although we can see changes in the data, the presentation of the same on a line chart gives a better picture of the information. The other forms of presentation of the data have already been discussed in Unit 6, Block 2 of Quantitative Analysis for Managerial Applications (MS-8).

34
Data Processing and Analysis
9.8 SUMMARY In this unit various aspects of data processing namely editing, coding, classification and presentation of data through tables and graphs have been discussed. Editing is of two type namely field editing and central editing. Coding involves assigning of some symbols or numerals or both to the answers of the questions in a questionnaire so that the responses can be recorded in a limited number of classes or categories. This helps in analysis of data. Designing of a coding scheme has been discussed with the help of a sample questionnaire. Classification is the process of arranging data in groups or classes on the basis of certain characteristics. It involves condensation of data which facilitates comparison and helps in establishing relationships between variables. Classification can be according to attributes or numerical characteristics. The former may be divided into simple and manifold classification. The later is achieved using either inclusive or exclusive method of forming frequency distribution. The data may be presented in the form of tables or graphs. The unit discusses various characteristics which should be taken into consideration while forming a table. The graphical presentation of data to be done by using pie chart, line chart, histograms etc. Some of these have been covered in this unit.
9.9 SELF-ASSESSMENT QUESTIONS 1. Describe, in brief, the importance of editing, coding, classification, tabulation
and presentation of data in the context of research study.
2. Discuss the different aspects of classification of data. What are the likely problems encountered in the classification and how they can be handled?
3. Why tabulation is considered essential in a research study? Give the characteristics of a good table.
4. Write briefly about the different forms of data presentation devices.
5. Monthly salary of 32 employees of a firm are given below. Tabulate the data after selecting a suitable class interval.
2250 1800 1650 1760 3520 5600 2450 26802700 1680 3650 3240 5850 3150 1860 24254520 3275 4215 3760 1950 1850 3750 28254500 3800 4300 2750 4370 3350 2375 3215
6. Discuss the fundamental rules of code construction.
7. Discuss with the help of suitable examples various steps involved in data processing.
8. Indicate the diagrams you would consider most appropriate to use for representing each of the following classes of statistical data stating briefly the reason for choice:
a) Distribution of a large number of candidates according to the number of marks scored by each at a public examination.
b) Distribution by age, sex and civil condition of persons enumerated at the census in 1981.
c) Distribution of assets of All Indian Insurance Companies put together as at Jan. 19, 1996.
d) Total value of India Exports and Imports during the years 1995-1996.
9. Draw a pie chart for comparing the various costs (rs. in lakhs) of the house building activities in two periods, 1984 and 1989.
1984 1989
Land cost 0.75 1.00 Material cost 1.00 1.75Labour cost 0.60 1.00Fixtures & furnitures 0.40 0.75Miscellaneous 0.25 0.50

35
Data Processing- Coding, Tabulation and Data
Presentation
9.10 FURTHER READINGS
Ben, G. C. "Marketing Research - Text and Cases" Tata McGraw-Hill Publishing Co ,Ltd. (1st Edition).
Kinnear, Thomas C. and James R. Taylog, “Marketing Research - An Applied Approach” McGraw-Hill International Editions (3rd Edition).
Luck, David J. and Ronald S. Rubin, "Marketing Research " Prentice-Hall of India Pvt. Ltd. (7th Edition).
Majumdar, Ramanuj "Marketing Research - Text, Applications and Case Studies " Wiley Eastern Ltd. (1st Edition).