2012 greater fargo-moorhead community health needs assessment of community leaders
DESCRIPTION
2012 Greater Fargo-Moorhead Community Health Needs Assessment of Community Leaders. Results of a May 2012 Survey of Community Leaders in Cass County, North Dakota and Clay County, Minnesota. Introduction. Purpose: Explore views of key leaders in F-M metro area Key leaders - PowerPoint PPT PresentationTRANSCRIPT

2012 Greater Fargo-Moorhead Community Health Needs Assessment of Community
Leaders
Results of a May 2012 Survey of Community Leaders in Cass County, North Dakota and Clay
County, Minnesota

Introduction• Purpose:– Explore views of key leaders in F-M metro area – Key leaders
• Elected leadership• Nonprofit leaders• Health professionals• Social workers• Educators
– Views on• Population’s health• Prevalence of disease and health issues
• Results of this survey are not generalizable

Study Design and Methodology• Study Design
― Developed in collaboration with Fargo-Moorhead Community Health Needs Assessment Collaborative (FMCHNAC)
― Electronic survey – contained 30 questions― Questions focused on:
• Community assets/best thing about the community• General concerns about the community• Health and wellness concerns about the community• Personal health care information• Demographic information
• Methodology― Community leaders invited to a breakfast meeting sponsored by the FMCHNAC ― List of invitees generated by members of the Collaborative― Written survey administered at the breakfast meeting― Survey data hand-entered into Internet-based survey tool (Survey Monkey)― Leaders not able to attend were contacted via e-mail with instructions for them to fill out the survey― 58 surveys completed (including 44 at the breakfast meeting and 14 via Internet survey link)― Findings not generalizable to the community
• But offer important insight and should be interpreted as anecdotal narrative

Key Findings
Community Assets/Best Things About the Community
• High levels of agreement that community:– Has educational opportunities and programs– Is a good place to raise kids– Has quality health care
• Agreed the least that – There is tolerance, inclusion, and open-mindedness

Key Findings
General Concerns About the Community
• Highest levels of concern were for:―Safety issues―The aging population―Children and youth
• Lowest levels of concern were for:―Environmental issues

Key Findings
Most concern for:• Safety issues
―Domestic violence―Child abuse and neglect

Key Findings
Most concern for:• The aging population
― Availability/cost of long-term care
– Availability of resources to help elderly stay in their homes
– Availability of resources for family and friends caring for elders

Key Findings
Most concern for:• Children and youth– Availability/cost of
quality child care– Bullying

Key Findings
Health and Wellness Concerns About the Community
• Highest levels of concern were for:– Cost and access issues– Physical and mental health issues
• Least concerned about:– Patient confidentiality– Distance to health care services

Key Findings
Most concern for:• Cost and access issues
– The cost of health insurance– The cost of health care– The cost of prescription drugs– Adequacy of health insurance– Access to health insurance
coverage

Key Findings
Most concern for:• Physical and mental health
– Obesity– Poor nutrition and eating habits– Inactivity or lack of exercise– Chronic disease– Depression

SURVEY RESULTS

Survey Results
Community Assets/Best Things About Their Community
• People• Services and resources• Quality of life

Respondents’ level of agreement with statements about their community regarding PEOPLE
• Respondents agree most that:• People are friendly,
helpful, and supportive• There is a sense of
community or feeling connected to people who live here
• Respondents agree least that:• There is tolerance,
inclusion, and open-mindedness (although still a moderate level of agreement)

Respondents’ level of agreement with statements about their community regarding
SERVICES AND RESOURCES
• Respondents agree most that:• There are quality higher
education opportunities and institutions
• There are quality school systems and programs for youth
• There is quality health care
• Respondents agree the least that:• There is effective
transportation (although still a moderate level of agreement)

Respondents’ level of agreement with statements about their community regarding QUALITY OF LIFE
• Respondents agree the most that:• Their community is a
good place to raise kids• Their community is a
healthy place to live
• Respondents agree the least that:• There are many
recreational, exercise, and sports activities/opportunities (although still a high level of agreement)

Survey Results
General Concerns About Their Community
• Economic Issues• Transportation• Environment• Children and Youth• The Aging Population• Safety

Respondents’ level of concern with statements about their community regarding ECONOMIC ISSUES
• Respondents are most concerned about:• Availability of
employment opportunities
• Economic disparities between higher and lower classes
• Homelessness• Poverty
• Respondents are least concerned about:• Cost of living (although
still moderately concerned)
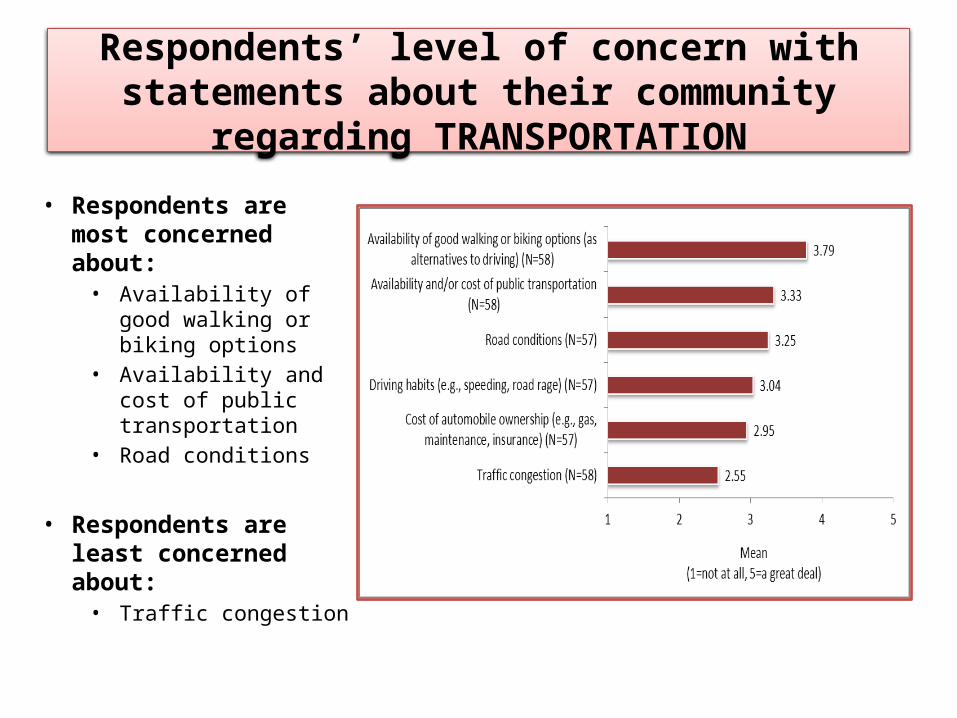
Respondents’ level of concern with statements about their community regarding TRANSPORTATION
• Respondents are most concerned about:• Availability of good
walking or biking options• Availability and cost of
public transportation• Road conditions
• Respondents are least concerned about:• Traffic congestion

Respondents’ level of concern with statements about their community regarding the ENVIRONMENT
• Overall, respondents are not that concerned with environmental issues
• Respondents have a higher level of concern with garbage and litter than with water quality, noise level, and air quality issues

Respondents’ level of concern with statements about their community regarding CHILDREN AND YOUTH
• Respondents are most concerned about:• Availability or cost of
quality child care• Bullying• Availability and cost of
services for at-risk youth
• Respondents are least concerned about: • Youth crime (although
still moderately concerned)

Respondents’ level of concern with statements about their community regarding THE AGING POPULATION
• Respondents are most concerned about:• Availability and cost of
long-term care• Availability of resources to
help the elderly stay in their homes
• Availability of resources for family and friends caring for elders
• Respondents are least concerned about:• The availability and cost of
activities for seniors (although still moderately concerned)

Respondents’ level of concern with statements about their community regarding SAFETY
• Respondents are most concerned about:• Domestic violence• Child abuse and neglect• Presence and influence
of drug dealers
• Respondents are least concerned about: • Violent crimes (although
still moderately concerned)

Survey Results
Health and Wellness Concerns About Their Community
• Access to health care• Physical and mental health• Substance use and abuse

Respondents’ level of concern with statements about their community regarding ACCESS TO HEALTH CARE
• Respondents are most concerned about:• Cost of health insurance• Cost of health care• Cost of prescription drugs• Adequacy of health insurance (e.g.,
amount of copays, deductibles)
• Respondents have moderately high levels of concern about:• Access to health insurance coverage
(e.g., preexisting conditions)• Availability of prevention programs or
services• Availability and/or cost of dental
and/or vision care• Coordination of care• Availability and/or cost of dental
and/or vision insurance coverage• Availability of mental health services
and providers
• Respondents are least concerned about:• Distance to health care services• Patient confidentiality

Respondents’ level of concern with statements about their community regarding PHYSICAL AND MENTAL HEALTH
• Respondents are most concerned about:• Obesity• Poor nutrition and
eating habits• Inactivity and/or lack
of exercise• Chronic disease
• Respondents are least concerned about:• Communicable
disease (although still a moderate level of concern)

Respondents’ level of concern with statements about their community regarding SUBSTANCE USE AND ABUSE
• Respondents’ have similarly high levels of concern regarding substance use and abuse issues
• Respondents are most concerned about:• Alcohol use and abuse• Drug use and abuse
• Respondents are least concerned about: • Exposure to second-hand
smoke (although still a fairly high level of concern)

Survey Results
Personal Health Care Information

Respondents’ primary health care provider
Primary health care provider Percent of respondents*Sanford Health 62.1Essentia Health 27.6Independent Family Doctors 15.5Family HealthCare Center 3.4Did not access health care in last 12 months 1.7Use emergency room/urgent care for primary care services 0.0Other: 3.4St. Alexius Medical Center in Bismarck (2) Trinity Medical Center in Minot (1)
• Three in five respondents use Sanford Health• One in four use Essentia Health
N=58*Percentages do not equal 100.0 due to multiple responses.

Respondents’ reasons for choosing primary health care provider
Reasons for choice of primary health care provider Percent of respondents*Quality of services 39.7Influenced by health insurance 29.3Location 27.6Availability of services 25.9Sense of being valued as a patient 25.9
Cost 5.2Other: 15.5Followed physician (2) Referral/recommendation (2) Keep medical records in one place (2) Provider relationships (2) Have been there many years (1) Employed there (1)
• Top three reasons:• Quality of services• Influenced by health insurance• Location
N=58*Percentages do not equal 100.0 due to multiple responses.

Whether respondents have had a cancer screening or cancer care in the past year
Cancer screening/cancer carePercent of respondents
(N=58)Yes 82.8No 17.2Total 100.0
• Less than one in five have not had a cancer screening or cancer care in the past year

Among respondents who have not had a cancer screening or cancer care in the past year, reasons for not having done so
Reason for not having a cancer screening/care Percent of respondents*Not necessary 60.0Fear 10.0Cost 0.0Unfamiliar with recommendations 10.0Doctor hasn’t suggested 0.0Unable to access care 0.0I don’t know who to see 10.0Other: 30.0
Time constraints: need after work hours (2)Personal reasons (1)
• 60% because it was not necessary• 10% because of fear• 10% because of unfamiliarity with recommendations• 10% because of not knowing who to see
N=10*Percentages do not equal 100.0 due to multiple responses.

Methods respondents have used to pay for health care costs over the past 12 months
Paying for health care costs Percent of respondents* Health insurance through an employer 91.4Personal income (e.g., cash, check, credit) 43.1Private health insurance 5.2Medicare 1.7Medicaid 1.7Did not access health care in last 12 months 0.0Other 0.0
• Vast majority paid with health insurance through an employer (91.4%)
• Second highest method was using personal income (43.1%)
N=58*Percentages do not equal 100.0 due to multiple responses.

Survey Results
Demographic Information

Respondents’ age
• Two out of three respondents are 45 to 64 years of age
• One in four are 30 to 44 years of age
AgePercent of respondents
(N=58)18 to 29 years 1.730 to 44 years 25.945 to 64 years 67.265 to 74 years 5.275 years or older 0.0Prefer not to answer 0.0Total 100.0

Respondents’ highest level of education
• Nine in 10 have a Bachelor’s degree or higher, including 58.6% who have a graduate or professional degree
Highest level of education Percent of respondents (N=58)
Some high school 0.0
High school diploma or GED 3.4
Some college/no degree 3.4
Associate’s degree 3.4
Bachelor’s degree 31.0
Graduate or professional degree 58.6
Prefer not to answer 0.0
Total 99.8

Respondents’ gender
• Two in three respondents are female
GenderPercent of respondents
(N=58)
Male 34.5
Female 65.5
Prefer not to answer 0.0
Total 100.0

Whether respondents work/volunteer outside the home
• Nearly all work or volunteer outside the home
Work/volunteerPercent of respondents
(N=58)
Yes 98.3
No 1.7
Prefer not to answer 0.0
Total 100.0

Respondents’ annual household income before taxes
• Two in five have an annual income of $70,000 to $119,999• One in three have an annual income of $120,000 or more
Annual household income before taxesPercent of respondents
(N=57)Less than $20,000 0.0$20,000 to $39,999 1.8$40,000 to $69,999 19.3$70,000 to $119,999 38.6$120,000 or more 35.1Do not know/prefer not to answer 5.3Total 100.1

Whether respondents own or rent their home
• The vast majority of respondents own their home
TenurePercent of respondents
(N=58)
Own 94.8
Rent 3.4
Prefer not to answer 1.7
Other 0.0
Total 99.9

Respondents’ race or ethnicity
• The vast majority of respondents are white
Race/ethnicity Percent of respondents*White 96.6Black/African American 0.0Native American/Alaska Native 0.0Asian/Pacific Islander 0.0Hispanic 3.4Other 0.0*Percentages do not equal 100.0 due to multiple responses.

Whether respondents are the parent or primary caregiver of a child or children
18 years of age or younger• One in three respondents are the parent or primary caregiver of a
child or children 18 years of age or younger
Parent or primary caregiverPercent of respondents
(N=58)
Yes 34.5
No 65.5
Prefer not to answer 0.0
Total 100.0

Respondents’ area of employment
Area of employment Percent of respondents*Health care 37.9Government 29.3Educational services 25.9Retail trade 1.7Arts/entertainment 0.0Agriculture 0.0Construction 0.0Manufacturing 0.0Not applicable 0.0Other: 24.1Social services (4) Non-profit (4) Financial services (2) Law (1) Retired (1) Higher education (1) Faith-based community (1)
• Most respondents are employed in health care, followed by government, and educational services
N=58*Percentages do not equal 100.0 due to multiple responses.

If respondents’ area of employment is health care, respondents’ health care position
Health care position Percent of respondents*Administrator 40.9I work in Public Health 27.3Clerical 4.5Nurse 4.5Physician’s Assistant/Nurse Practitioner 0.0CNA/Other assistant 0.0Other: 22.7Medical doctor (2) Finance (1) Public education (1) Development and health promotion (1)
• 40.9% of those in health care are an administrator• 27.3% of those in health care work in public health
N=22*Percentages do not equal 100.0 due to multiple responses.

Companion Report Comparisons
2012 Greater Fargo-Moorhead Community Health Needs Assessment of Residents & 2012 Greater
Fargo-Moorhead Community Health Needs Assessment of Community Leaders

Comparisons(caution should be used when interpreting the comparisons as findings from the community leaders’
survey are not generalizable to the community)
Residents
• Overall lower levels of agreement and concern than leaders
Community Leaders
• Overall higher levels of agreement and concern than residents

Community Assets
Residents
• Agree most that– There are quality higher education
opportunities, institutions, school systems, and programs for youth
– There is quality health care– It is a good place to raise kids
• Agree less (than leaders) that– There is an engaged government– There is a sense you can make a
difference• Agree the least that
– There is tolerance, inclusion, and open-mindedness
Community Leaders
• Agree most that– There are quality higher education
opportunities, institutions, school systems, and programs for youth
– There is quality health care– It is a good place to raise kids
• Agree more (than residents) that– There is an engaged government– There is a sense you can make a
difference• Agree the least that
– There is effective transportation

General Concerns
Residents
• Top concerns directed at aging population
• Also among top concerns– Availability of employment
opportunities– Presence and influence of drug
dealers• Least concerned about
– Garbage and litter– Water and air quality– Noise levels
Community Leaders
• Top concerns directed at aging population
• Most concerned about domestic violence
• Also among top concerns– Availability of quality child care– Bullying
• Least concerned about– Garbage and litter– Water and air quality– Noise levels

Health and Wellness Concerns
Residents
• Top concerns are access-related issues– Cost of health insurance and health care– Cost of prescription drugs
• Physical and mental health top concerns– Cancer– Chronic disease– Obesity
• Least concerned about– Communicable disease– Suicide
Community Leaders
• Top concerns are access-related issues– Cost of health insurance and health care– Cost of prescription drugs
• Physical and mental health top concerns– Obesity– Poor nutrition and eating habits– Inactivity or lack of exercise
• Least concerned about– Communicable disease– Suicide