application of statistical quality control to improve
TRANSCRIPT

Application of Statistical Quality Control to Improve Yields andRationalize Testing in a Low Volume Manufacturing Facility
by
David Charles Knudsen
Bachelor of Science in Civil and Environmental Engineering, Stanford University, 1994Bachelor of Arts in Economics, Stanford University, 1994
Submitted to the Sloan School of Management and the Department of Civil andEnvironmental Engineering in Partial Fulfillment of the Requirements for the Degrees of
Master of Science in Managementand
Master of Science in Civil and Environmental Engineering BARKERin conjunction with the MASSAHUETTS1NS ITU-h
Leaders for Manufacturing Program OF TECHNOLOGY
at theMassachusetts Institute of Technology JUL 0 9 2001
June 2001 1F -LIBRARIES
© 2001 Massachusetts Institute of Technology. All rights reserved.
Signature of AuthorSloan School of Management
5 May 2001
Certified byRO Welsch, Thesis Advisor
Professor of Statistics and Management ScienceSloan School of Management
Certified byKevinAar atiga, Thesis Advisor
Rockwell International Career Development Assist nt ProfessorDepartment..0"l agd4-Environmen1 Engineering
Approved by_________ ___________________Oratuyukozturk, dla5irman" of Committee,4 Graduate Studies
Denartment of Civil and Environmental Engineering
Approved byMargaret t. Anorews, txecutive Director Master's Program
Sloan School of Management

This page is intentionally left blank.
2

Application of Statistical Quality Control to Improve Yields andRationalize Testing in a Low Volume Manufacturing Facility
by
David Charles Knudsen
Submitted to the Sloan School of Management and the Department of Civil andEnvironmental Engineering on May 5, 2001 in Partial Fulfillment of the Requirements
for the Degrees of Master of Science in Management and Master of Science in Civil andEnvironmental Engineering
Abstract
Qualcomm's Wireless Business Solutions group manufacturers two-way satellitecommunications systems for the commercial trucking industry at its facilities in SanDiego. The testing process for this family of products, called OmniTRACS, is sub-optimal. First-pass yields for the entire test process average 60%, but most of the failedunits pass upon retest. Tens of thousands of dollars are wasted each year on additionaltesting and debug efforts for these units that are ultimately shipped without any rework.This thesis describes the efforts of a yield improvement team chartered to increase first-pass yields dramatically throughout the test process.
The yield improvement team utilized statistical control charts and Gage Repeatability andReliability studies to better understand the nature of process failures at the final test stepand the capability of the test process itself. This knowledge enabled the team to eliminatenon-value added tests and increase some arbitrary specification limits. Yields at the finaltest step increased from 88% to 97%, generating a projected annual savings of more than$45,000.
Increased visibility of process performance at the final test step was a necessaryprerequisite to the process change, so the team developed a decision support tool thatenables continuous monitoring of process performance at any test step in theOmniTRACS manufacturing process. The tool should enable future processimprovements at other test steps by providing the statistical data necessary to guideprocess changes.
Thesis Supervisor: Roy WelschProfessor of Statistics and Management ScienceSloan School of Management
Thesis Supervisor: Kevin AmaratungaRockwell International Career Development Assistant ProfessorDepartment of Civil and Environmental Engineering
3

This page is intentionally left blank.
4
Acknowledgements
I wish to acknowledge the faculty and staff of the Leaders for Manufacturing Program for
its support of this work and for the outstanding education it has offered me.
The project would not have gotten off of the ground but for the efforts of Alison
McCaffree. Thank you for providing so much support both before and during my
internship.
Qualcomm offered me everything I could have hoped for in an internship. John Lloyd
and the quality team accepted me as a colleague and supported me in every aspect of the
project. Tom Rainwater and the Test Engineering organization were instrumental to the
success of the project. The yield improvement team's willingness to explore new ideas
and challenge the status quo was exciting and rewarding. Thank you.
My advisors, Roy Welsch and Kevin Amaratunga, provided me insight and support as I
worked through the challenges of the project. Thank you for your time and effort.
My LFM classmates are a fantastic group of men and women. I have learned more from
them than from any other aspect of the LFM program. Thanks for a great two years.
Finally, thanks to my wife for enduring a difficult time in San Diego. The challenges of
work and school are insignificant compared to the challenges of life, but your support
over the last two years of me and my work never wavered.
5

This page is intentionally left blank.
6

Table of Contents
Abstract...........................................................................................................................31.0 INTRODU CTION ............................................................................................ 11
1.1 Project Description ....................................................................................... 111.2 Project Approach and M ethodology................................................................ 12
2.0 PROJECT SETTING AND BACKGROUND .................................................. 152.1 Company Background, Position, and Outlook ............................................... 152.2 Organizational Skills ..................................................................................... 162.3 Inform ation Technology ................................................................................. 17
3.0 THE OM NI TEST PROCESS........................................................................... 193.1 Satellite Com munications Overview ............................................................. 193.2 Product Overview .......................................................................................... 203.3 M anufacturing Flow and Test Description .................................................... 20
3.3.1 Centerplate Functional ............................................................................ 213.3.2 V ibe ......................................................................................................... 223.3.3 Environm ental........................................................................................ 223.3.4 Burn-in .................................................................................................. 223.3.5 Acceptance Test Procedure .................................................................... 23
4.0 Improving How Existing Tests Are Performed................................................ 244.1 Yield Improvem ent Team ............................................................................. 244.2 Characterizing the Current State of the Process.............................................. 25
4.2.1 Pareto D iagram s of Failure M odes ........................................................ 264.2.2 Understanding Process Capability at ATP .............................................. 274.2.3 Gage Repeatability and Reliability Study on ATP ................................... 30
4.3 Changes Implem ented ................................................................................... 324.4 Monitoring Process Performance Over Time - Run Charts and Control Charts. 334.5 Test Alarm Response Team .............................................................................. 364.6 Results ............................................................................................................. 38
5.0 Software Tools to Support Continuous Process Monitoring .............................. 405.1 Initial State of IT Tools ................................................................................ 40
5.1.1 Shop Floor Control ................................................................................. 405.1.2 QualityLink............................................................................................ 415.1.3 Com m on Test Software (CTS)............................................................... 42
5.2 Om ni SPC A nalysis D atabase........................................................................ 425.2.1 Selecting a Development Environment.................................................. 435.2.2 Key Design Features ............................................................................... 445.2.3 Resulting Application............................................................................. 48
5.3 Recom mended IT Vision ............................................................................... 506.0 Organizational Observations............................................................................. 52
6.1 Three Lenses Analysis................................................................................... 526.1.1 Project Setting........................................................................................ 526.1.2 Strategic Design Lens ............................................................................ 546.1 .3 Political Lens .......................................................................................... 576.1.4 Cultural Lens ......................................................................................... 616.1.5 Putting the 3 Lenses Together ................................................................. 63
6.2 M anaging the Change Process ...................................................................... 64
7
6.2.1 Kotter's Eight Steps ................................................................................ 656.2.2 The Yield Improvement Team - Internal Process Assessment.........66
6.3 Evaluation and Recommendations ................................................................. 677.0 Summary ............................................................................................................. 69R eferences.....................................................................................................................7 1Appendix 1 Estimating Expected Process Fallout For a Given Cpk ........................... 72
8
List of Figures
Figure 1 Satellite Communications Overview........................................................... 19Figure 2 OmniTRACS Product Overview.................................................................20Figure 3 OmniTRACS Test Process Flow ................................................................. 21Figure 4 Weekly Yield Summary Report ................................................................... 26Figure 5 ATP Failure Mode Pareto............................................................................26Figure 6 ATP CND Failure Pareto............................................................................27Figure 7 ATP Process Capability for Signal-to-noise Ratios ..................................... 29Figure 8 Gage R&R Data Collection Sheet............................................................... 31Figure 9 CND Reduction Due to Expanded ATP Limits...........................................33Figure 10 A utocorrelation Chart ............................................................................... 35Figure 11 Pre-Change ATP Failure Pareto.................................................................38Figure 12 Post-Change ATP Failure Pareto ............................................................... 39Figure 13 IT Environment Supporting the OmniTRACS Process................................40Figure 14 OmniSPC Analysis Table Structure ........................................................... 46Figure 15 Subgroup Average Run Chart Example .................................................... 49
Figure 16 Nominal Subgroup Average Run Chart Example ....................................... 50Figure 17 Recommended IT Environment ................................................................. 51Figure 18 QWBS Organizational Design................................................................. 54Figure 19 Stakeholder D iagram ................................................................................. 59
List of Tables
T able I C N D R ate by Test Step....................................................................................24Table 2 ATP Gage R&R Results .............................................................................. 31Table 3 Omni SPC Analysis Database Design Alternative Ranking .......................... 44Table 4 Stakeholder Interests................................................................................... 58
Table 5 Kotter's Eight Steps to Transforming the Organization ................................ 65
9

This page is intentionally left blank.
10

1.0 INTRODUCTION
The testing process for OmniTRACS Antenna Communications Units (ACU's) at
Qualcomm's manufacturing facility in San Diego was sub-optimal. First-pass yields for
the entire test process averaged 60%, but most of the failed units pass upon retest. Tens
of thousands of dollars were wasted each year on additional testing and debug efforts for
these units that were ultimately shipped without any rework.
Statistical Process Control (SPC) has been used effectively in the manufacturing industry
to improve quality and reduce costs. But SPC is not a silver bullet. It is not a tool that
you buy off the shelf, turn on, and magically generate improvement in your
manufacturing process. Rather, implementing SPC is a process of discovery and
experimentation. It requires the proper resources, including tools and training, to be used
effectively within an organization.
This thesis describes the effort undertaken by a process improvement team within
Qualcomm's Wireless Business Solutions (QWBS) division to begin using statistical
process control tools to improve manufacturing yields. Over a period of six months, the
team was able to improve yields from 88% to 97% at the final test step in the process,
resulting in an annual savings of approximately $45,000. The knowledge the team
gained through the effort and the tools it developed to support the change should enable
future improvements, as well.
1.1 Project Description
QWBS management recognized the need to improve its test procedures in order to
increase factory yields and reduce manufacturing costs. An internship proposal was
submitted to the Leaders for Manufacturing Program that contained three related, yet
distinct potential projects:
1. Reduce/eliminate non-value added testing
* Use statistical analysis to predict field performance of units based on factory
parametric test results.
11
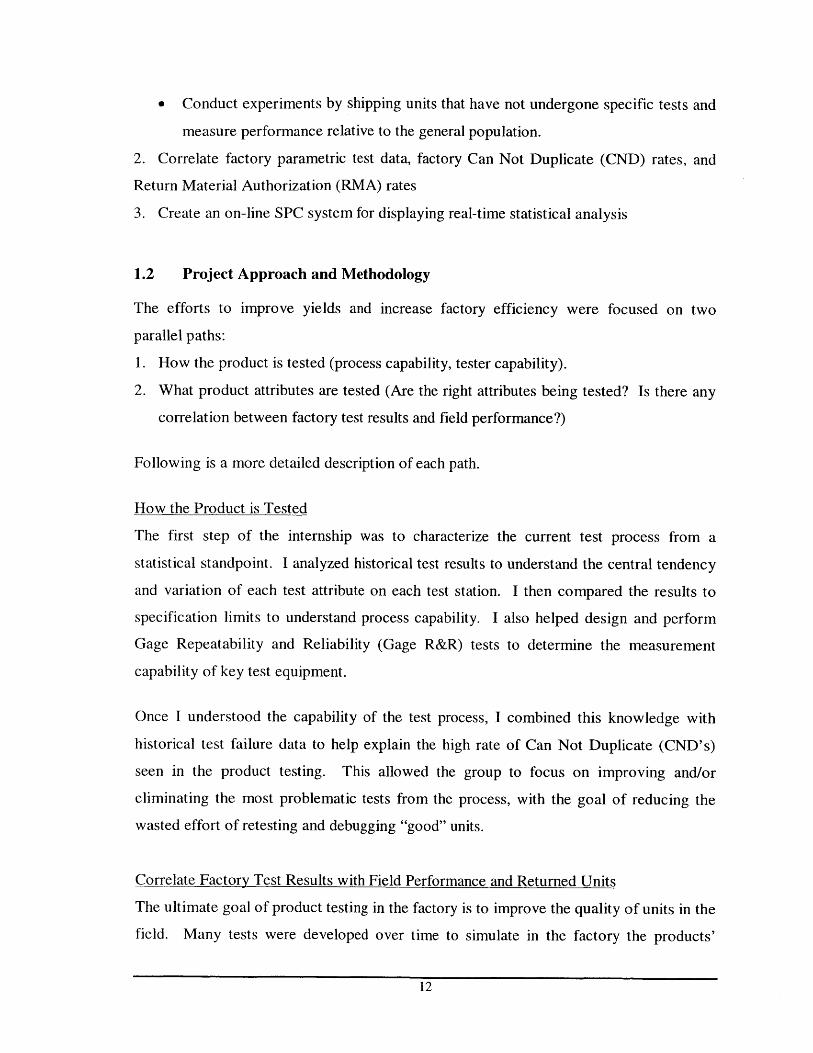
* Conduct experiments by shipping units that have not undergone specific tests and
measure performance relative to the general population.
2. Correlate factory parametric test data, factory Can Not Duplicate (CND) rates, and
Return Material Authorization (RMA) rates
3. Create an on-line SPC system for displaying real-time statistical analysis
1.2 Project Approach and Methodology
The efforts to improve yields and increase factory efficiency were focused on two
parallel paths:
1. How the product is tested (process capability, tester capability).
2. What product attributes are tested (Are the right attributes being tested? Is there any
correlation between factory test results and field performance?)
Following is a more detailed description of each path.
How the Product is Tested
The first step of the internship was to characterize the current test process from a
statistical standpoint. I analyzed historical test results to understand the central tendency
and variation of each test attribute on each test station. I then compared the results to
specification limits to understand process capability. I also helped design and perform
Gage Repeatability and Reliability (Gage R&R) tests to determine the measurement
capability of key test equipment.
Once I understood the capability of the test process, I combined this knowledge with
historical test failure data to help explain the high rate of Can Not Duplicate (CND's)
seen in the product testing. This allowed the group to focus on improving and/or
eliminating the most problematic tests from the process, with the goal of reducing the
wasted effort of retesting and debugging "good" units.
Correlate Factory Test Results with Field Performance and Returned Units
The ultimate goal of product testing in the factory is to improve the quality of units in the
field. Many tests were developed over time to simulate in the factory the products'
12
operational environment, but there were no data indicating whether the unit performance
in factory tests correlated in any way with unit performance in the field. The goal of this
effort was to collect and analyze field performance data to help make the determination
whether the current suite of factory tests are useful indicators of field quality.
A wealth of over-the-air field performance data is collected at Qualcomm's Network
Management Centers (NMC's) in San Diego and Las Vegas. All messages sent to and
received by the OmniTRACS units in the field are routed through one of the two NMC's,
and performance metrics are available for each transmission. However, utilizing this data
proved more difficult than anticipated. The data is spread across thousands of text files,
making it difficult to aggregate for analysis. Qualcomm also has a policy in effect and
contractual agreements with its customers that address how long data may be store by
Qualcomm.
An NMC operator developed a batch routine to pull the desired data from the different
text files, but the process was not completed until the end of the internship. We were
therefore unable to collect enough data to perform a meaningful analysis.
Developing a Software Tool to Support Process Analysis
In addition to a set of analyses and recommendations, a further goal of the internship was
to develop a set of software tools to enable future analysis and monitoring of the health of
the manufacturing process. The organization had no clear vision of what the tool should
look like or the capabilities it should possess. So I worked on my own to recognize the
latent requirements for statistical data within the organization and then to develop a tool
that would address those needs.
Yield Improvement Team
A cross-organizational and cross-functional Yield Improvement Team had been created
prior to the internship to drive improvements in the OmniTRACS test process. The
internship was proposed in part to provide the team a dedicated resource to collect and
analyze test data and to introduce the team to statistical process control concepts and
13

practices. All decisions regarding resource allocation and process changes associated
with the project were made by the team.
14
2.0 PROJECT SETTING AND BACKGROUND
2.1 Company Background, Position, and Outlook
Qualcomm's Wireless Business Systems (QWBS) is a division of Qualcomm,
Incorporated that manufactures two-way satellite communications systems for the
commercial trucking industry. QWBS is the largest player in the market with more than
350,000 OmniTRACS units in the field. More than 1,200 U.S. fleets utilize
OmniTRACS, including 37 of the top 40 truckload fleets in the country. QWBS also has
a strong presence in Mexico, Brazil, Argentina, Canada and Europe, and it is actively
trying to penetrate the potentially vast Chinese market.
Despite its strong position in the market, QWBS has set an aggressive growth target
known as the 2 x 4 plan: to double both revenue and profitability in four years. But a
softening of the commercial trucking market and increased competition have amplified
the cost pressures on QWBS. Historically, reductions in product cost were achieved
through material price reductions from suppliers. However, suppliers can only be
squeezed so far, and additional cost reductions need to be generated through
improvements in manufacturing efficiency in order to meet the 2 x 4 plan.
QWBS competes in its market primarily based on quality and technology. It offers
customers immediate replacement of units that fail in the field; sometimes new units are
shipped to customers before the failed units are received.
As a result, an attitude exists within the division that no product should ship without
complete confidence in its ability to perform. Unfortunately, the product was designed
more than ten years ago, and many aspects of the design have very little margin. Quality
has become an attribute that is tested into the product, as opposed to being designed into
the product.
A potential conflict between product quality and manufacturing efficiency was thus
exposed, as efforts to reduce test times and improve test effectiveness became more
15
critical. Two camps developed. One argued that the test process was inefficient and used
historical data on failure modes to show the wastefulness of some test steps (the primary
failure mode was CND). The other camp replied that low product return rates showed
that the test process was effective, and that any efforts to experiment with changes to the
test process risked alienating the customer base. No progress was made because no
proposals were developed that addressed the needs of both groups.
But there was incentive to change. Coincident with the push to improve manufacturing
efficiencies in QWBS's San Diego facility was a move toward outsourcing newer
products to contract manufacturers in Mexico. There were no stated plans to ultimately
outsource the Omni product, but employees in the San Diego facility recognized that
future potential. This added to the support for change.
2.2 Organizational Skills
The two key groups involved in the project, the Quality group and the Test Engineering
group, had completely different sets of skills. The Quality group consisted primarily of
mechanical engineers, some of whom were familiar with the general concepts of
statistics. But they used their knowledge to monitor and improve the process only on an
ad-hoc basis. One engineer analyzed process data every two to three months to
understand the process capability. Another engineer developed a set of Gage R & R
experiments to understand the measurement capabilities of some new test equipment.
The engineers spent most of their time fighting fires, and the engineers who understood
statistics used their knowledge to help them fight fires more effectively.
The Test Engineering group consisted primarily of software programmers. They
developed the hardware and software used to test the products. According to the group
manager, the group lacked even basic knowledge of statistics and the concept of
variability.
16
2.3 Information Technology
QWBS utilized a variety of software applications to run its manufacturing operation.
Production control was managed through a home grown system called Shop Floor Contro
(SFC), which is based on an unsupported version of an Oracle database. The
organization was evaluating options for upgrading the system, which included upgrading
to Peoplesoft, upgrading to a supported Oracle database, or continuing to support the
existing database. Development on the platform had been restricted to maintenance until
a decision on the future of the application was made.
Finished goods inventory, customer shipments, and product returns data were maintained
on a Peoplesoft database. There was no automated interface between Shop Floor Control
(SFC) and Peoplesoft.
Parametric test results were stored in a Microsoft Access database called QualityLink.
Each tester generated text files containing the results of the most recent test. A routine
ran continuously that pulled those text files into an Access database where they could be
analyzed off-line. There were no interfaces between QualityLink and SFC, nor between
QualityLink and Peoplesoft.
This led to some inconsistencies in reports used to evaluate quality metrics. Quality data
in SFC were entered manually by operators on the floor at the conclusion of each test.
Error codes were selected from dropdown boxes, but there was no safeguard against the
selection of an incorrect code. Yield reports were generally generated from SFC.
Quality data in QualityLink were generated automatically by the test software, so it was
generally guaranteed to be accurate. However, the part number of the unit under test was
manually input by the operator before each test, and there were no safeguards against the
input of an incorrect part number. Part numbers were input before each successive test,
so it was possible to have the part number of a unit change from one test to the next.
QualityLink data was used primarily for ad-hoc analysis. Canned quality reports using
QualityLink data had not been developed.
17

I believed it feasible to develop new functionality for the QualityLink system. The
database was managed by an engineer in the Test Engineering organization, and he was
willing to grant me administrative access to the database.
Development of a new suite of software (called Common Test Software, or CTS) to
manage the test systems was almost complete when I arrived. Since it was still under
development, I could have focused my efforts on adding a statistical process control
module to the system. However, implementation of CTS was scheduled on only the new
product lines QWBS was developing. Converting the existing OmniTRACS test process
code to CTS would basically require a complete rewrite (a significant effort on the behalf
of the Test Engineering group) and the possibility that OmniTRACS manufacturing could
be outsourced within two years led QWBS management to de-prioritize the investment.
Since virtually 100% of manufacturing's volume consisted of OmniTRACS products, it
didn't make sense to pursue CTS.
18
3.0 THE OMNI TEST PROCESS
3.1 Satellite Communications Overview
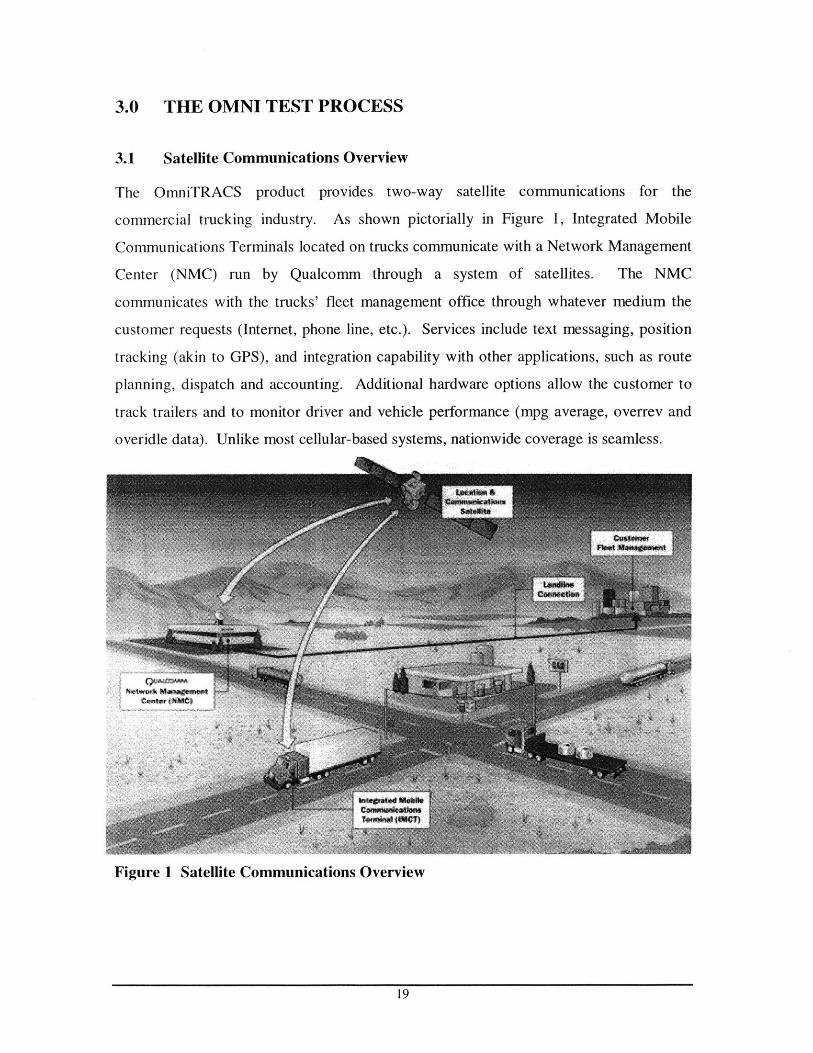
The OmniTRACS product provides two-way satellite communications for the
commercial trucking industry. As shown pictorially in Figure 1, Integrated Mobile
Communications Terminals located on trucks communicate with a Network Management
Center (NMC) run by Qualcomm through a system of satellites. The NMC
communicates with the trucks' fleet management office through whatever medium the
customer requests (Internet, phone line, etc.). Services include text messaging, position
tracking (akin to GPS), and integration capability with other applications, such as route
planning, dispatch and accounting. Additional hardware options allow the customer to
track trailers and to monitor driver and vehicle performance (mpg average, overrev and
overidle data). Unlike most cellular-based systems, nationwide coverage is seamless.
Figure 1 Satellite Communications Overview
19
3.2 Product Overview
QWBS manufactures several products at its San Diego facility. Its most mature product,
the OmniTRACS, comprises most of the plant's volume and was the focus of the yield
improvement efforts.
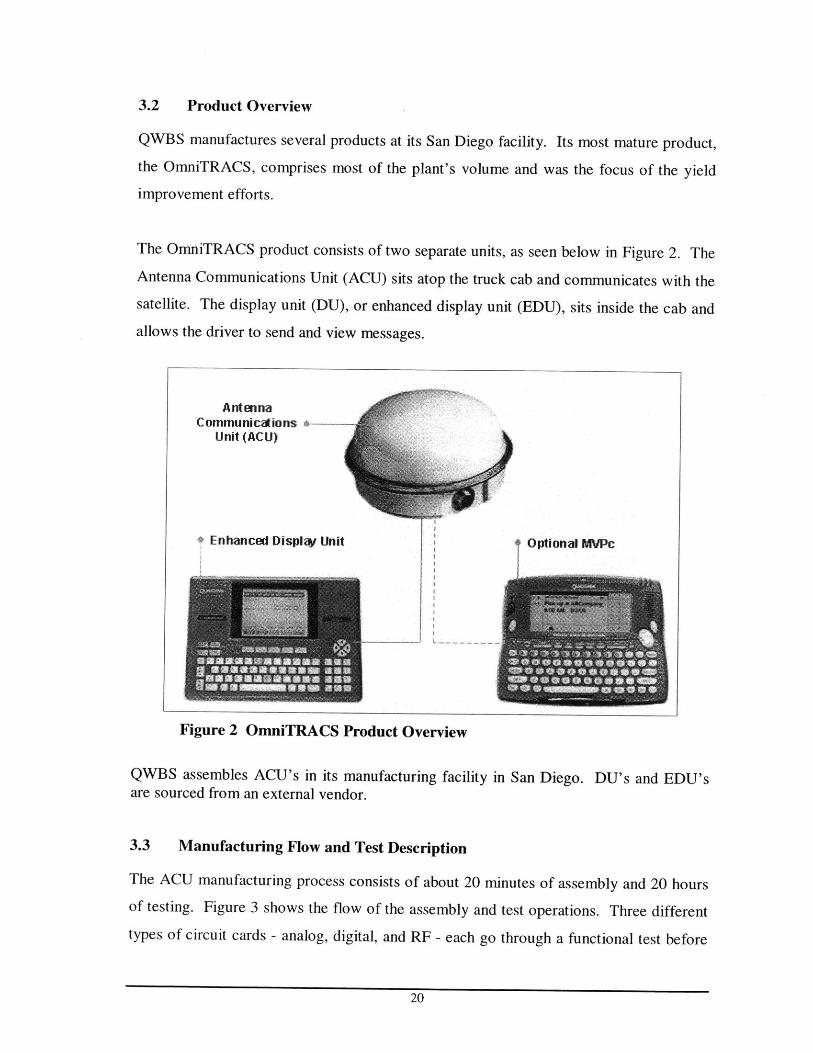
The OmniTRACS product consists of two separate units, as seen below in Figure 2. The
Antenna Communications Unit (ACU) sits atop the truck cab and communicates with the
satellite. The display unit (DU), or enhanced display unit (EDU), sits inside the cab and
allows the driver to send and view messages.
Figure 2 OmniTRACS Product Overview
QWBS assembles ACU's in its manufacturing facility in San Diego. DU's and EDU'sare sourced from an external vendor.
3.3 Manufacturing Flow and Test Description
The ACU manufacturing process consists of about 20 minutes of assembly and 20 hours
of testing. Figure 3 shows the flow of the assembly and test operations. Three different
types of circuit cards - analog, digital, and RF - each go through a functional test before
20
AntennaCommunicaions k--
Unit (ACU)
?Enhanced Display Unit Optional MVPc
4 4-sw--
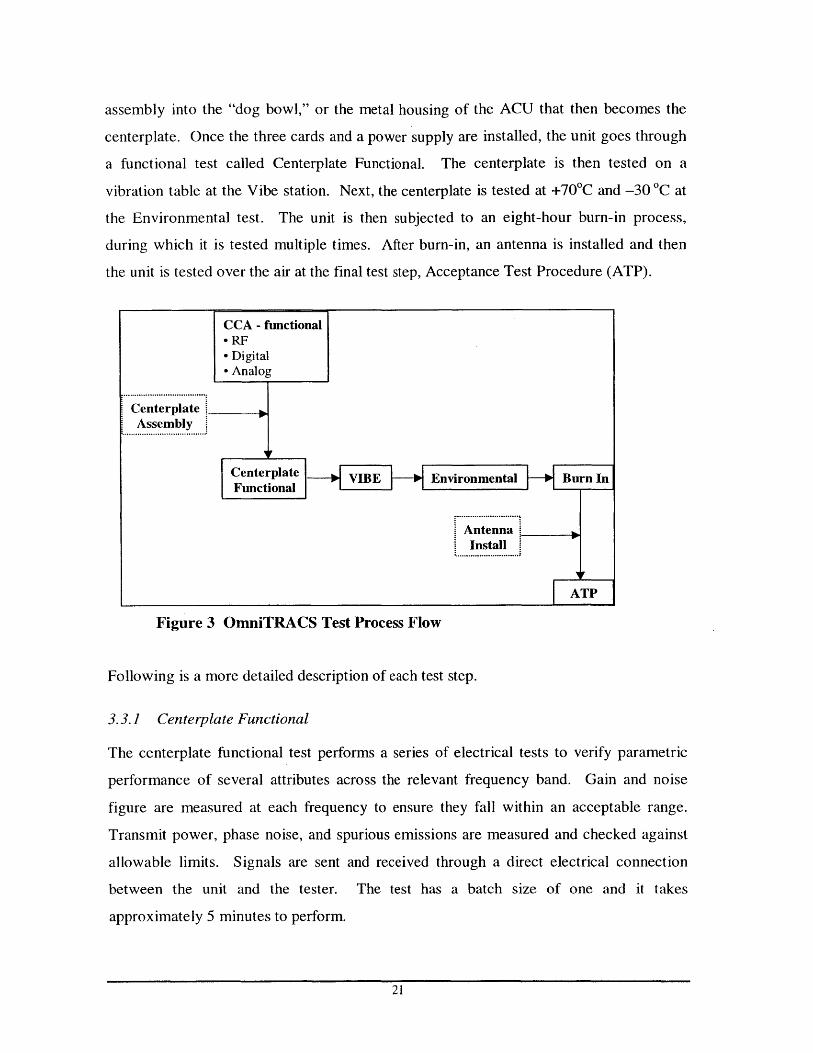
assembly into the "dog bowl," or the metal housing of the ACU that then becomes the
centerplate. Once the three cards and a power supply are installed, the unit goes through
a functional test called Centerplate Functional. The centerplate is then tested on a
vibration table at the Vibe station. Next, the centerplate is tested at +70 0C and -30 0C at
the Environmental test. The unit is then subjected to an eight-hour burn-in process,
during which it is tested multiple times. After burn-in, an antenna is installed and then
the unit is tested over the air at the final test step, Acceptance Test Procedure (ATP).
CCA - functional- RF- Digital" Analog
CenterplateAssembly
Centerplate VIBE Enironmenta Burn InFunctional
AntennaInstall
ATP
Figure 3 OmniTRACS Test Process Flow
Following is a more detailed description of each test step.
3.3.1 Centerplate Functional
The centerplate functional test performs a series of electrical tests to verify parametric
performance of several attributes across the relevant frequency band. Gain and noise
figure are measured at each frequency to ensure they fall within an acceptable range.
Transmit power, phase noise, and spurious emissions are measured and checked against
allowable limits. Signals are sent and received through a direct electrical connection
between the unit and the tester. The test has a batch size of one and it takes
approximately 5 minutes to perform.
21
Failure rates at centerplate functional are fairly low (First-pass Yield = 93%), and the
failures that are found are typically repeatable and real. The highest rate of CND failures
for any single test attribute was only 0.14%.
3.3.2 Vibe
The vibe test is designed to simulate the vibrational conditions the unit may experience in
the field while attached to a moving truck. During the test, the unit sends and receives
messages directly through an electrical connection to the test station while undergoing
acceleration on a vibration table. Signal-to-noise ratios (forward link, return link, and
ranger, or positioning link) are measured and checked against the specification limits. A
host of additional metrics are evaluated, as well. The test has a batch size of I and it
takes approximately 8 minutes to perform.
Failure rates at Vibe are relatively low (FPY = 92%), but the rate of CND's is high.
Nearly 94.5% of the failures recorded for the top five failure modes were not repeatable.
3.3.3 Environmental
The environmental test performs the same electrical tests that are performed at
centerplate functional, except the tests are performed at temperature extremes. The test
has a batch size of 40 and it takes 6 hours to complete (so the processing time per unit is
about 15 minutes).
Failure rates at environmental are high (FPY=82%), but for the most part the test is
catching real failures. Of the four failure modes with the highest CND rates, only 35% of
the total failures are CND's.
3.3.4 Burn-in
The burn-in test (generally called Ransco, after the manufacturer of the test chamber)
performs messaging tests while cycling the units through a series of temperature swings.
While the message test itself is the same as the one performed at vibe, there are some
22

technical differences in how the unit communicates with the test station that make the test
more complex. The batch size of a Ransco chamber is 250 units and the test takes 12
hours to complete. Note that the test time is not reduced if fewer units are run. Each unit
is just tested more frequently over the 12-hour bum-in cycle.
There is some debate within the organization over the purpose of the Ransco test. The
original intent of the test was three-fold:
1. Screen for infant mortality
2. Screen for intermittent failures
3. Perform some tests that aren't performed anywhere else in the test process
The quality group believed that Ransco did not effectively perform any of the above
functions and it wanted to eliminate the test entirely. Unfortunately, no tests had been
designed to measure Ransco's effectiveness at meeting the three aforementioned
objectives.
The available data - failure data - showed that Ransco had a reasonably low failure rate
(FPY = 92%), but that the CND rate was high. Of the four failure modes with the highest
CND rates, 77% of the failures were not repeatable.
3.3.5 Acceptance Test Procedure
The Acceptance Test Procedure (ATP) performs the same basic messaging test that is
performed at vibe and Ransco, except the test is performed over the air. Just before ATP,
the antenna is installed, so the ATP test checks to see if the unit can acquire a signal and
send and receive messages from a simulated satellite within the factory. Signal-to-noise
ratios are again the primary metrics of interest. The batch size of the ATP test is 1 and
the test takes approximately 8 minutes.
Failure rates at ATP are high (FPY = 88%), and nearly 100% of the units that fail
ultimately pass without rework.
23

4.0 Improving How Existing Tests Are Performed
4.1 Yield Improvement Team
Before the internship began a yield improvement team with four goals was created:
" Improve yields (95% First-pass Yield at each test step)
" Lowe product cycle time
* Improve quality
" Understand CND failures
The team had collected yield information for each test step in the process and determined
that improving the ATP step would provide the most benefit for the effort. While first-
pass yields at ATP were not the lowest of all of the tests, the rate of CND failures was
extremely high. Eliminating most of the CND's would reduce the wasted effort that went
into multiple retests of product that ultimately was shipped without any rework. Table I
summarizes the first-pass yield and CND rates for each test step.
Test Step First-pass CND as % CND as % of
Yield of Failures Total Tests
ATP 88% 99% 11.9%
Vibe 92% 94% 7.5%
Environmental 82% 35% 6.3%
Ransco 92% 77% 6.2%
Centerplate Functional 93% 0.14% 1%
Table 1 CND Rate by Test Step
The data in Table I actually underestimate the true impact of CND's on process
efficiency. Units that fail at Centerplate Functional, Vibe, and ATP are immediately
retested. Units that fail upon retest are sent to a debug station where a technician
evaluates them. If the failure can not be duplicated by the technician, then the unit is sent
back to the test station. Some units are tested and retested up to eight times before
ultimately passing (a unit passes a test if it successfully completes one test cycle without
failure, irrespective of the number of prior failures). These retests are not completely
24
captured in the above table. Over one two-month time frame, the CND rate as a function
of total tests equaled 21%.
Sorting the data by cost of each CND or by greatest pain to the organization would have
been useful in assessing the areas of greatest impact, but we were unable to collect the
data necessary to perform these rankings.
During my internship I became the primary resource dedicated to collecting and
analyzing data for presentation to the yield improvement team. Building on the work
done by the team, I chose to focus first on the ATP process.
4.2 Characterizing the Current State of the Process
The first step in improving a process is to determine the current state, or the baseline.
Many different types of analyses are useful in characterizing process performance.
Perhaps the most common analysis, and the one predominantly used within QWBS, is the
pareto chart.
While pareto charts are useful in focusing attention on the most frequently occurring or
most costly failure modes, they don't provide any insight into why failures might be
occurring. They contain no information on the statistical distributions of the test results.
Two additional tools that are helpful in understanding process performance are control
charts and Gage R&R studies. Control charts capture the dynamic nature of the process,
and they include a measure of variability. Gage R&R studies provide insight into the
sources of variability.
Following is a discussion of how we used each tool to better understand the performance
of the OmniTRACS test systems.
25
4.2.1 Pareto Diagrams of Failure Modes
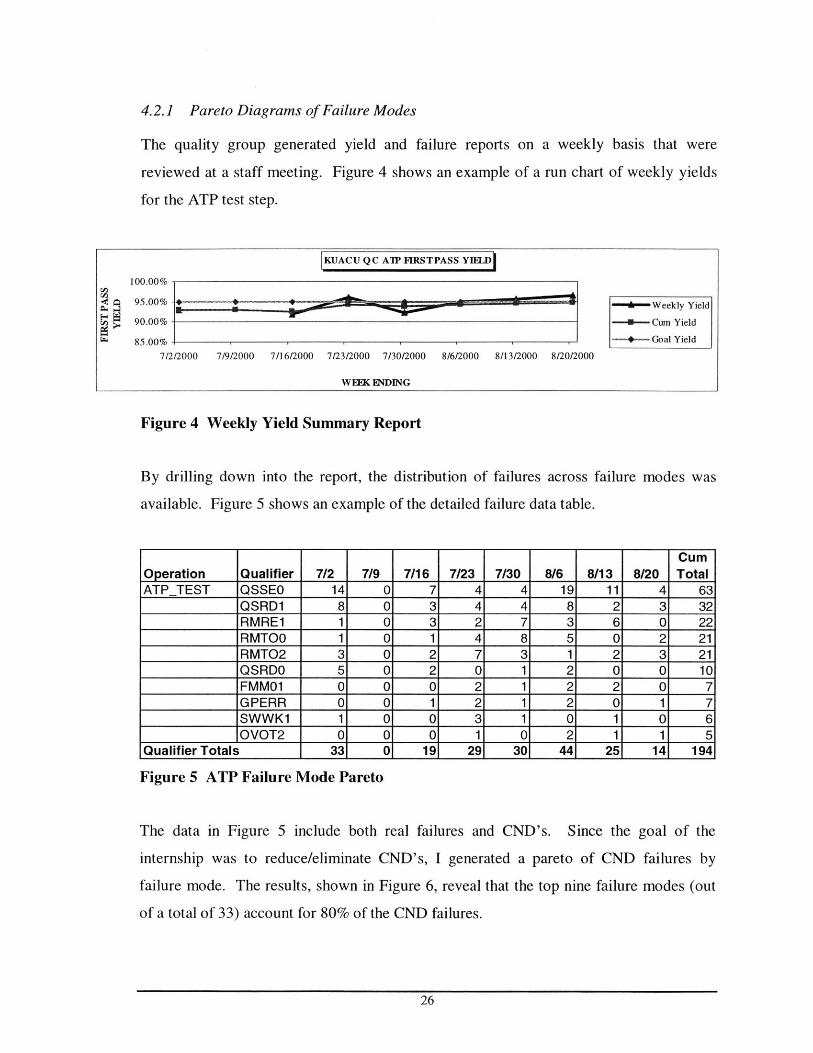
The quality group generated yield and failure reports on a weekly basis that were
reviewed at a staff meeting. Figure 4 shows an example of a run chart of weekly yields
for the ATP test step.
KUACU QC A'P FIRSTPASS YIELD
100.00%
95.00% - ~Weekly Yield
90.00% - Cum Yield
85.00% ---- Goal Yield
7/2/2000 7/9/2000 7/16/2000 7/23/2000 7/30/2000 8/6/2000 8/13/2000 8/20/2000
WEx ENDING
Figure 4 Weekly Yield Summary Report
By drilling down into the report, the distribution of failures across failure modes was
available. Figure 5 shows an example of the detailed failure data table.
CumOperation Qualifier 7/2 7/9 7/16 7/23 7/30 8/6 8/13 8/20 TotalATPTEST QSSEO 14 0 7 4 4 19 11 4 63
QSRD1 8 0 3 4 4 8 2 3 32RMRE1 1 0 3 2 7 3 6 0 22RMTOO 1 0 1 4 8 5 0 2 21RMT02 3 01 2 7 3 11 2 3 21QSRDO 5 0 2 0 1 2 0 01 10FMM01 0 0 0 2 1 2 2 0 7GPERR 0 0 1 2 1 2 0 1 7
_______SWWK1 1 0 0 3 1 0 1 0 6_______OVOT2 0 0 0 1 0 2 1 1 5
Qualifier Totals 33 0 19 29 30 44 25 14 194
Figure 5 ATP Failure Mode Pareto
The data in Figure 5 include both real failures and CND's. Since the goal of the
internship was to reduce/eliminate CND's, I generated a pareto of CND failures by
failure mode. The results, shown in Figure 6, reveal that the top nine failure modes (out
of a total of 33) account for 80% of the CND failures.
26

Lft:
200-
150
100-
Single Failure Units by Failure Type at ATP8/1/00 to 9/30/00
100.0%
80.0%
60.0%
40.0%
20.0%
0.0%0F G H IA B C D E
Failure Mode
50 -
Figure 6 ATP CND Failure Pareto
With the CND problem distilled down to a manageable set of test attributes, the focus
was then to identify the source of those failures.
4.2.2 Understanding Process Capability atATP
The goal of statistical quality control is to understand the sources of variation in a
process. Variation can come from one of two sources: assignable causes; and natural
variation. If a process is operating without the presence of assignable causes, then it is in
a state of statistical control.
However, whether a process is in control or not does not determine how many failed units
the process might generate. The relationship between the process mean and variability,
and the product or test specification limits determines the expected rate of failures. This
relationship is usually expressed as a process capability index, or Cpk.
27
[j-iI H' n- ,
... -.- ...... ..... ...
I iFl FIA 1-1

Cpk= minUSL-P p-LSL)
where USL = Upper Specification Limit and LSL = Lower Specification Limit
As the capability ratio decreases, the number of failures you expect to see in the absence
of assignable causes increases. This reveals several areas of inquiry necessary to
determine why units might be failing a process.
1. Is the process centered? If the process mean is close to either the lower or
upper specification limit, the capability ratio may become unacceptably small,
even if the process is in a state of statistical control.
2. Is the process variability large?
3. Is their significant variability in the measurement process?
To answer the question of why seemingly good units were failing at ATP, we wanted to
answer the three questions above. We also needed to determine whether the process was
operating in a state of statistical control (without assignable causes).
Data collection was not an issue. All test results are automatically logged into a database
to which I had access. In fact, the volume of available data presented more of a challenge
than anything else. More than 50 attributes were tested on each product at ATP, and five
different product variations were consistently produced. To make the analysis feasible,
we chose to focus first on the highest volume part number. We also leveraged our
findings from the pareto analysis of CND defect rates by attribute to limit our study to the
top five test attributes of concern.
In order to get meaningful results, we also had to segment the data further. ATP tests
were performed on four different tools, each with potentially different performance
characteristics. Thus we had to perform the analysis on each tool separately. Also, the
selected part number could contain one of two centerplates, one produced by QWBS or
one purchased from an outside vendor. We broke the data into these two sub populations
so we could see any performance differences between the two.
28
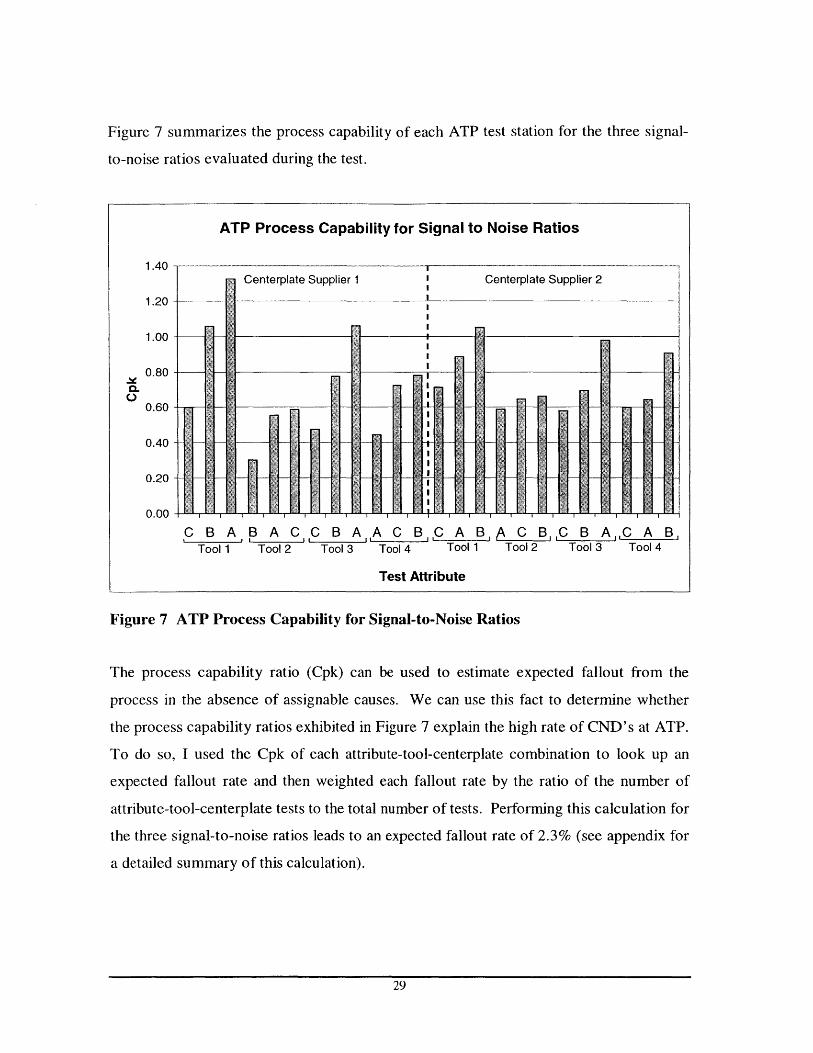
Figure 7 summarizes the process capability of each ATP test station for the three signal-
to-noise ratios evaluated during the test.
Centerplate Supplier 1 Centerplate Supplier 2
~Hi'
ATP Process Capability for Signal to Noise Ratios
1.40 -
1.20
1.00
0.80 -
H0.60
0.40-
0.20 - 4kU.UU -
C B A B A C C B A A C B C A B ,k C B C B A C A BTool 1 Tool 2 Tool 3 Tool 4 Tool 1 Tool 2 Tool 3 Tool 4
Test Attribute
M, 1-
-I
Figure 7 ATP Process Capability for Signal-to-Noise Ratios
The process capability ratio (Cpk) can be used to estimate expected fallout from the
process in the absence of assignable causes. We can use this fact to determine whether
the process capability ratios exhibited in Figure 7 explain the high rate of CND's at ATP.
To do so, I used the Cpk of each attribute-tool-centerplate combination to look up an
expected fallout rate and then weighted each fallout rate by the ratio of the number of
attribute-tool-centerplate tests to the total number of tests. Performing this calculation for
the three signal-to-noise ratios leads to an expected fallout rate of 2.3% (see appendix for
a detailed summary of this calculation).
29
.0L
The process capability analysis reveals that the ATP process will have relatively high
fallout rates, even when the incoming product may have nothing wrong with it. There are
then four levers that can be used to improve process capability and reduce the fallout rate:
1. Center the process mean.
2. Reduce process variability.
3. Increase the specification limits.
4. Reduce the variability in the measurement process.
If the mean were exactly centered between the existing specification limits without
changing the variability, expected fallout for the three signal-to-noise ratios would fall
from approximately 2.3% to 1.5%. Changing the specification limits from +3dB and -
2dB to +5dB and -5dB leads to an expected fallout of only 0.6%. Reducing variability
would have a similar affect, depending on the magnitude of the change.
4.2.3 Gage Repeatability and Reliability Study on ATP
Gage R&R studies are designed experiments that measure the variability of a
measurement process, including both operator variability and gage (or test equipment)
variability. Characterizing how much of the total variation in the ATP test measurements
was due to the test process itself (as opposed to the product) was essential to the
improvement process.
The standard Gage R&R study involves the measurement of a group of parts (typically
around 10) multiple times (two or three) by multiple operators. Measuring 10 different
parts allows you to calculate variation across parts. Measuring the same part multiple
times allows you to calculate variation in the measurement. Measuring the same part by
different operators allows you to calculate the variation introduced by the test operators.
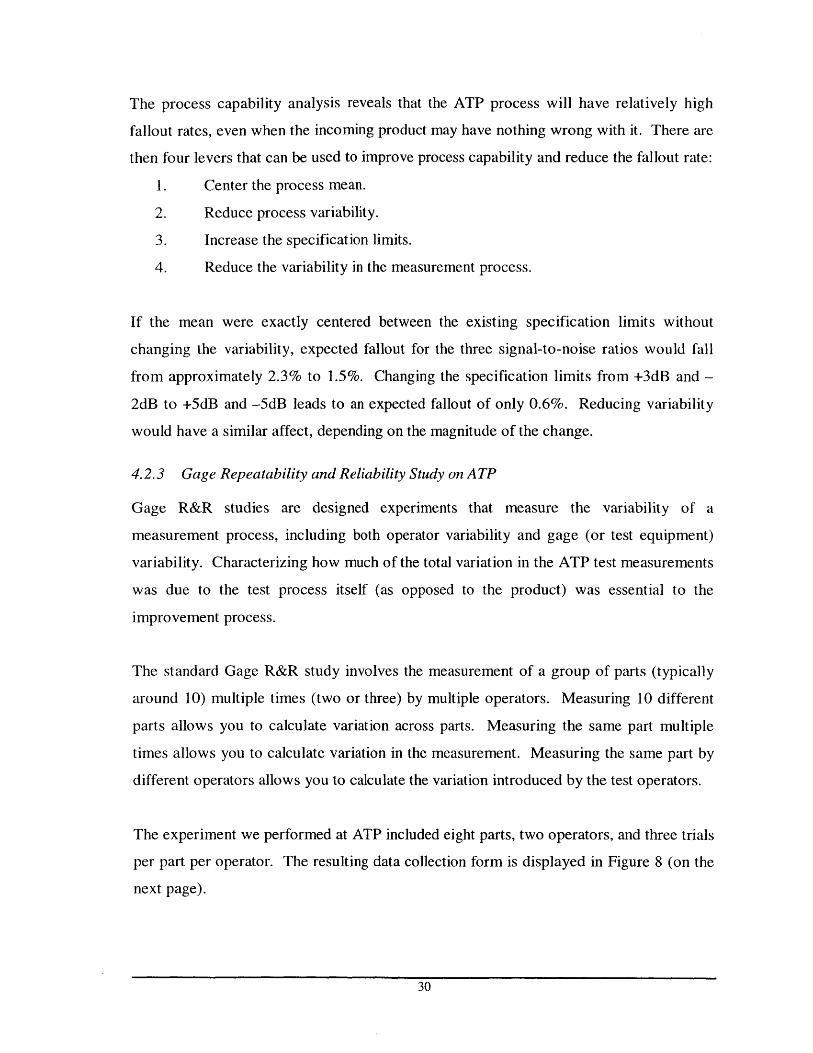
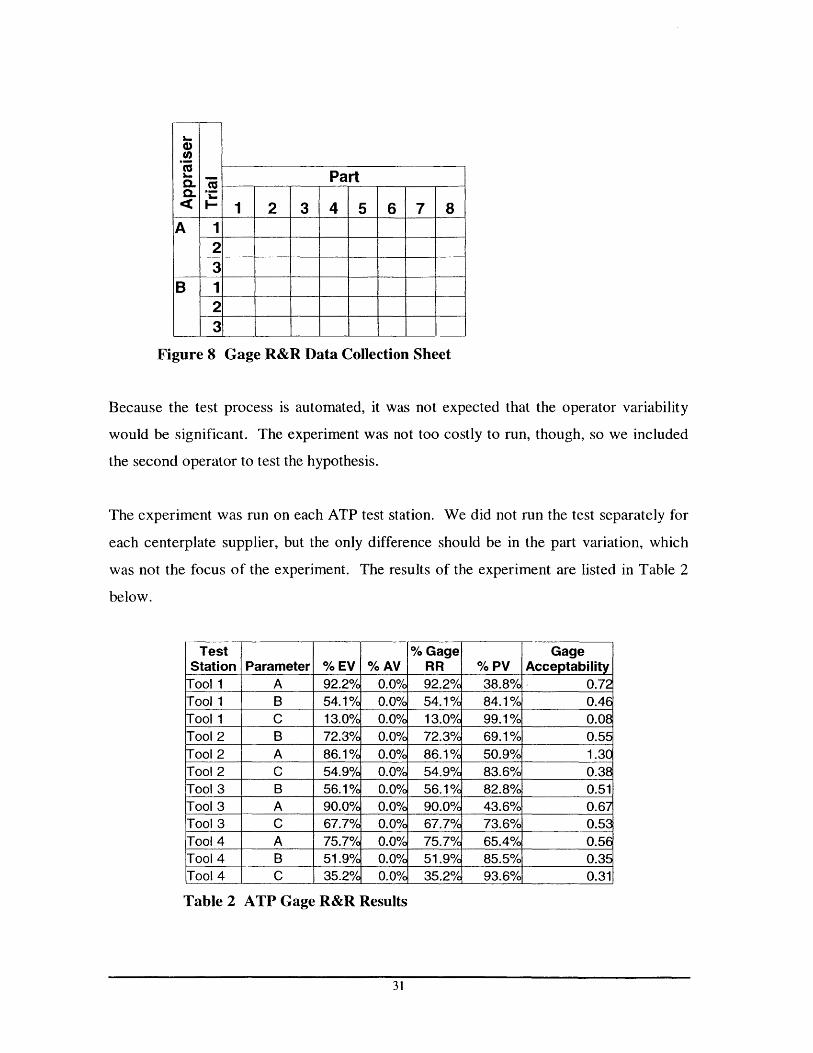
The experiment we performed at ATP included eight parts, two operators, and three trials
per part per operator. The resulting data collection form is displayed in Figure 8 (on the
next page).
30
L-4)
Lm
1
Part
2 3 4 5 61718A 1
23
B 123
Figure 8 Gage R&R Data Collection Sheet
Because the test process is automated, it was not expected that the operator variability
would be significant. The experiment was not too costly to run, though, so we included
the second operator to test the hypothesis.
The experiment was run on each ATP test station. We did not run the test separately for
each centerplate supplier, but the only difference should be in the part variation, which
was not the focus of the experiment. The results of the experiment are listed in Table 2
below.
Test % Gage GageStation Parameter % EV % AV RR % PV Acceptability
Tool 1 A 92.2% 0.0% 92.2% 38.8%, 0.72Tool 1 B 54.10/ 0.0% 54.1% 84.1% 0.46Tool 1 C 13.0% 0.0% 13.0% 99.1% 0.08Tool 2 B 72.3% 0.0% 72.3% 69.1% 0.55Tool 2 A 86.1% 0.0% 86.1% 50.9% 1.30Tool 2 C 54.90 0.0% 54.9% 83.6% 0.38Tool 3 B 56.10/ 0.0% 56.1% 82.8% 0.51Tool 3 A 90.0% 0.0% 90.0% 43.6% 0.6Tool 3 C 67.7% 0.0% 67.7% 73.6% 0.53Tool 4 A 75.7% 0.0% 75.7% 65.4% 0.56Tool 4 B 51.90 0.00/ 51.90/ 85.5% 0.3Tool 4 C 35.20/ 0.00/ 35.20/ 93.6% 0.31
Table 2 ATP Gage R&R Results
31
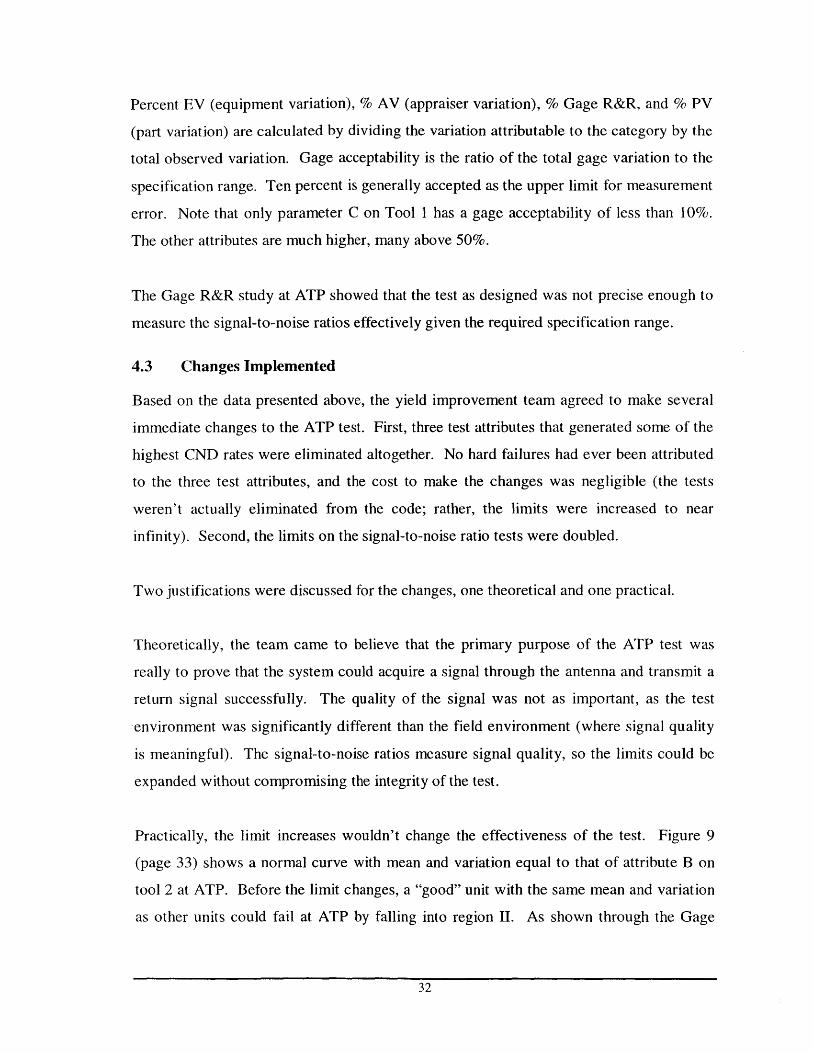
Percent EV (equipment variation), % AV (appraiser variation), % Gage R&R, and % PV
(part variation) are calculated by dividing the variation attributable to the category by the
total observed variation. Gage acceptability is the ratio of the total gage variation to the
specification range. Ten percent is generally accepted as the upper limit for measurement
error. Note that only parameter C on Tool I has a gage acceptability of less than 10%.
The other attributes are much higher, many above 50%.
The Gage R&R study at ATP showed that the test as designed was not precise enough to
measure the signal-to-noise ratios effectively given the required specification range.
4.3 Changes Implemented
Based on the data presented above, the yield improvement team agreed to make several
immediate changes to the ATP test. First, three test attributes that generated some of the
highest CND rates were eliminated altogether. No hard failures had ever been attributed
to the three test attributes, and the cost to make the changes was negligible (the tests
weren't actually eliminated from the code; rather, the limits were increased to near
infinity). Second, the limits on the signal-to-noise ratio tests were doubled.
Two justifications were discussed for the changes, one theoretical and one practical.
Theoretically, the team came to believe that the primary purpose of the ATP test was
really to prove that the system could acquire a signal through the antenna and transmit a
return signal successfully. The quality of the signal was not as important, as the test
environment was significantly different than the field environment (where signal quality
is meaningful). The signal-to-noise ratios measure signal quality, so the limits could be
expanded without compromising the integrity of the test.
Practically, the limit increases wouldn't change the effectiveness of the test. Figure 9
(page 33) shows a normal curve with mean and variation equal to that of attribute B on
tool 2 at ATP. Before the limit changes, a "good" unit with the same mean and variation
as other units could fail at ATP by falling into region 1I. As shown through the Gage
32
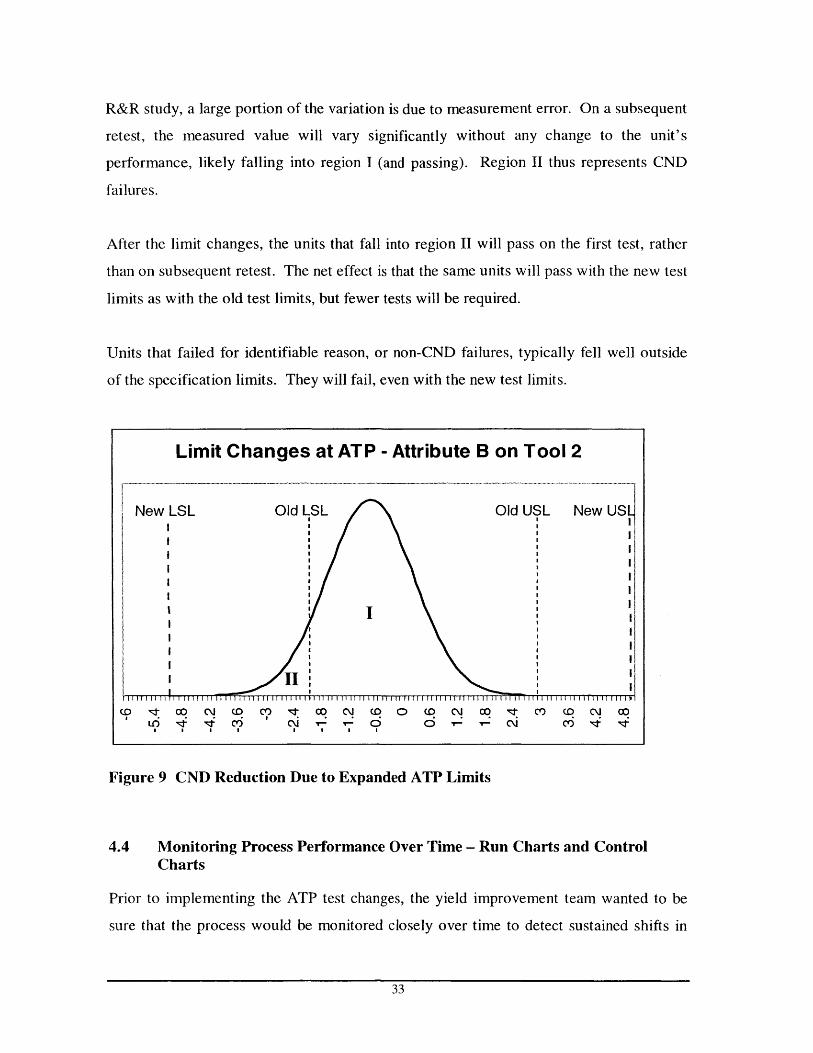
R&R study, a large portion of the variation is due to measurement error. On a subsequent
retest, the measured value will vary significantly without any change to the unit's
performance, likely falling into region I (and passing). Region II thus represents CND
failures.
After the limit changes, the units that fall into region II will pass on the first test, rather
than on subsequent retest. The net effect is that the same units will pass with the new test
limits as with the old test limits, but fewer tests will be required.
Units that failed for identifiable reason, or non-CND failures, typically fell well outside
of the specification limits. They will fail, even with the new test limits.
Limit Changes at ATP - Attribute B on Tool 2
New LSL
(0 ;1 10o4 C6 '~
C\j (D 0 (06 05
c' 1c: C C16 4 o
Figure 9 CND Reduction Due to Expanded ATP Limits
4.4 Monitoring Process Performance Over Time - Run Charts and ControlCharts
Prior to implementing the ATP test changes, the yield improvement team wanted to be
sure that the process would be monitored closely over time to detect sustained shifts in
33
Old LSL Old USL* NewUSL~I I
I I* I
I I
I *
* I
* II I
I I
II I

performance. Historically, process monitoring consisted of failure reports. The team did
not feel comfortable relying on yield data alone to monitor the changed process, because
it would take a significant shift in the process mean or a dramatic increase in process
variability in order for significant numbers of failures to occur.
The ideal solution would have been to develop control charts to monitor the process. I
had already calculated process means and variation, so all I needed to do was plot
subgroup data on a run chart with control limits at ±3c-.
Unfortunately, and perhaps predictably, it did not turn out to be so simple. The control
limits rely on the assumption of normality. I checked the assumption using normal
probability plots and found that it did not hold for many of the attributes. The primary
reason was that the signal-to-noise ratios were constrained to be integer values by the
limited bandwidth of the over-the-air transmission. Creating subgroups of five
consecutive tests solved the problem satisfactorily.
Autocorrelation in the data was not so easily solved. Every unit manufactured is tested,
so inertial elements in the process lead to correlated data. Traditional Shewhart control
charts are very sensitive to the assumption of independence in the underlying dataset.
Correlation amongst the data can lead to false alarms. Figure 10 (page 35) shows an
autocorrelation diagram for one of the test attributes on test station 2.
34

Estimated Autocorrelations for MeasuredValue
p~0.6
0.2
-0.2 -~~ ~--0.6 i mm ..
-4-, -0 .- . . . . . . . . . .
0 5 10 15 20 25
lag
Figure 10 Autocorrelation Chart
Literature suggests several ways to deal with correlated data. One is to model the
correlative structure explicitly with a time series model, use that model to remove the
autocorrelation, and then apply control charts to the residuals. Montgomery, Johnson,
and Gardiner (1990) and Box, Jenkins ,and Reinsel (1994) propose a set of models called
autoregressive integrated moving average models that can be used to develop control
charts for correlated data.
The processes described in literature to deal with correlated data require a significant
level of statistical knowledge to prove useful. Run charts of test measurements are
intuitive. Operators and engineers alike can relate to the data, because it is in a form they
see every day. Run charts of residuals of a time series model or exponentially weighted
moving averages are more abstract. They require some understanding of the statistical
models used to derive the chart data from the original test results in order to interpret
signals in the chart.
Montgomery suggests coupling an Arima chart with a standard run chart of test results.
This allows users to visually translate changes in test performance they are familiar with
into changes in performance on the statistical control chart. This is a good solution to the
35
problem, but it still assumes a basic comfort with the method of charting process data and
interpreting the results.
Yet QWBS had no experience with the use of run charts to analyze process performance.
Presenting the group with a complex set of statistical charts before they were comfortable
with the concept in general would have been counterproductive. If the charts weren't
easy to interpret, and somehow grounded in the reality they understood, then they
wouldn't be used.
So the tool we chose to develop used the old specification limits as "alarm" limits on a
run chart of test measurements. Subgroups were used to make the data more normal.
The charts allowed the engineers to begin understanding the dynamic nature of the
process. It also enabled the team to be warned of potential failures before they began to
occur. We created a software routine that checked for subgroup measurements that
exceeded the alarm limits (the old specification limits). This gave the group visibility to
changes in process performance before yields were impacted.
As the engineers in QWBS begin to feel more comfortable with the use of run charts to
monitor process performance, they may find it useful to increase the complexity of the
charts by adding the appropriate statistical control limits. This will become especially
important if they choose to try to reduce the variability of the ATP test. Until then, the
run charts will continue to provide a bridge between the new process data and the
knowledge they had developed prior to the change in the specification limits.
4.5 Test Alarm Response Team
The run charts described in the previous section were generated using an Access database
application I developed called the Omni SPC Analysis Database. The database, which
will be discussed in greater detail in chapter 5, included a set of reports that highlight
units that exceeded the alarm limits. The yield improvement team wanted a group of
36

engineers to respond immediately to these alarm conditions to understand the source of
the failures.
The Test Alarm Response team was created to perform this function. The team consisted
of the test engineer responsible for the ATP testers, the quality engineer responsible for
the Omni test process, the supervisor of the test equipment maintenance and repair group,
and myself. My role was to run the database function to check for alarms on a daily basis
and to call the team together whenever any alarms occurred. I typically would perform
some different analysis before calling the team together to see if I first could determine a
potential cause for the alarms.
The team met on two or three different occasions to review alarm conditions. The
primary source of alarms came from a group of products that was known to perform right
on the edge of the old specification limits due to design issues. The group agreed to
ignore alarms for these products unless they deviated significantly from the historical
average (as determined by a visual assessment of the run chart).
The team did gain some valuable insight into the process when a set of measurements
dropped dramatically on one day. The test measurements for each unit are evaluated in
comparison to a reference unit run at the beginning of each shift. The dramatic drop in
test measurements was due not to a drop in unit performance, but on one occasion to an
increase in the signal-to-noise ratio of the reference unit. This forced the team to
reevaluate the purpose and effectiveness of the reference units. Without the alarm
response team, that discussion would not have occurred, and the process would not have
been as well understood.
The test alarm response team was considered a success because it provided a cross-
functional forum for the analysis of operational test data. The Test Engineering and
quality groups did not typically work together on anything more than an ad-hoc basis to
improve the test process, so the synergy was beneficial.
37

4.6 Results
The effects of the changes to the ATP test were immediate. First-pass yield improved
from 88% to 97%, leading to a projected annual savings of over $45,000. Figure 11
shows the pareto of failures at ATP in the two months before the test changes. Figure 12
(on the following page) shows the same pareto for the two months following the limit
changes.
Single Failure Units by Failure Type at ATP8/1/00 to 9/30/00
200 -- ---- ---- --- 100.0%
80.0%150
60.0%
100LL
40.0%
50
20.0%
A B C D E F G H I J K L M N 0 P 0 R S T U V W X Y Z AA AB AC AD AE AF AG
Figure 11 Pre-Change ATP Failure Pareto
38

200
150
100LL
50
0
Single Failure Units by Failure Type at ATP10/1/00 to 11/30/00
100.0%
80.0%
60.0%
40.0%
20.0%
0.0%J D K M N I B C S X 0 Q F E T K
Figure 12 Post-Change ATP Failure Pareto
The total number of failures over a two-month period fell dramatically after the change,
from 549 to 72. The number of failure modes also decreased from 33 to 16. By all
accounts, the change was a success.
39
---

5.0 Software Tools to Support Continuous Process Monitoring
5.1 Initial State of IT Tools
One of the three goals of the internship was to develop an on-line statistical process
control tool. The tool would need to fit into the existing IT infrastructure in order to be
supported after the completion of the internship. Figure 13 shows a diagram of the
software tools supporting the OmniTRACS process. Following is a discussion of each
component of the existing system.
TesterA
TesterB A es
Tester
C
!estorD]
QualityLinkAccess
Database
Shop FloorControl
SC---------------IOmniSPCAnalysisAccess Database
Some user interaction, but mostly cannedIreports.
-- - - - - - - - - - - - - - - - - -
40
Figure 13 IT Environment Supporting the OmniTRACS Process
5.1.1 Shop Floor Control
Shop Floor Control (SFC) is used to control the flow of materials through the
manufacturing line. It was developed in-house, and it utilizes an Oracle database with a
Powerbuilder front-end. SFC contains the official as-build configuration that identifies
the part number and supplier of each component in a product. It also has a set of quality
reports, including yield reports, which are used by the Quality group to monitor test
system performance.

As stated in Chapter 2, SFC has no interface to the testers or the QualityLink database.
This poses two problems. First, test results must be entered manually into the SFC
database by operators on the floor. Parametric test results are not input, only pass/fail
attributes with the associated failure code. Dropdown menus of failure codes are
available, but users are allowed to enter data not included in the dropdown list. This
leads to the potential for discrepancies between the data in QualityLink and SFC.
Second, operators must enter the product identifier at each successive test station. Again,
no safeguards exist to ensure that the correct part number is input at each test station.
This led to cases where a product was identified in QualityLink as coming from supplier
A at centerplate functional, but then from supplier B at Vibe.
Ideally, an interface would be developed between QualityLink and SFC. However, the
Oracle database on which SFC is based is no longer supported by Oracle. The IT
department was evaluating options for upgrading the system, so all development of new
functionality was put on hold.
5.1.2 QualityLink
QualityLink is a Microsoft Access database developed by the Test Engineering group to
store parametric test results from the OmniTRACS process. Data is transferred to the
database from the test equipment at the end of each test (nearly real-time). The front-end
of the application provides only a simple query tool that allows data to be extracted from
the database and exported to Excel. Consequently, the data in QualityLink is used only
on an ad-hoc basis by a limited group of engineers in the Quality group who are familiar
with the application.
The design of the database underlying the QualityLink application mirrors the physical
test process. A master table identifies all tests performed (date, tool, product tested), and
test results are distributed across multiple tables. Some data for like tests are stored
together (Vibe and ATP, for example) but each test step basically has one or more tables
to store its results. Generic queries to extract test results are difficult to create due to this
database design.
41
5.1.3 Common Test Software (CTS)
The Test Engineering group recognized the limitations of the software controlling the
OmniTRACS testers. The code is a mixture of C and C++. The testers are DOS-based
and have no room for additional drivers. Maintaining and upgrading the software and
hardware is time-consuming and expensive.
CTS was developed to support the next generation product line under development within
QWBS. It utilizes a more consistent object-oriented design and it is built on the
Windows NT platform. Each tester is controlled by a workstation that could feasibly
support additional functionality, such as a web server and/or a local statistical process
control application.
Data storage and retrieval were also factored into the CTS design. Data from each tester
is stored locally, and then dumped into a data warehouse on a periodic basis. The table
structure within the data warehouse is generic, meaning test results from any tester will
reside in one of two tables, depending on the type of data. Generic queries and reports
could be created easily off of the data warehouse.
5.2 Omni SPC Analysis Database
The Omni SPC Analysis database was developed to support continuous monitoring and
improvement of the OmniTRACS product line. The choices of software and system
design were constrained by the existing IT infrastructure, the skills of the individuals
available to support the system, and the limited development time. Following is a
discussion of the design alternatives that were evaluated and a description of the
application that eventually was implemented.
42

5.2.1 Selecting a Development Environment
The goal of the SPC Analysis database was to provide a set of on-line tools to help
evaluate the performance of the OmniTRACS manufacturing process. Ultimately, the
system would offer the capability to perform real-time statistical process control.
The CTS environment was clearly the ideal place to integrate statistical process control
tools. It was the future of test software in QWBS, and it had a robust infrastructure that
could support different application design alternatives. Unfortunately, the manufacturing
and Test Engineering organizations were not sure if and when CTS would be
implemented for the OmniTRACS process. The cost of rewriting the code was
significant and the benefit difficult to quantify. Also, virtually no product was being
manufactured on the lines supported by CTS (the products were in their infancy and had
not gained market acceptance). Thus development efforts in the CTS environment would
not provide any short-term benefit to QWBS.
QWBS had multiple data warehousing efforts underway, so another possible alternative
was to dump QualityLink data into the data warehouse, and then use a standard OLAP
tool like Cognos Impromptu to develop reports and data analysis tools. The engineer
within the quality group who was going to support the tool over time had experience
developing in the Cognos environment, so this alternative could be supported. But the
data warehousing group was over-committed already, and the benefits of adding quality
data to the data warehouse were not deemed significant enough to displace an existing
project.
The tool would then have to interface with the existing QualityLink database on the back
end. Two alternative front-end tools were considered: a Java applet and a Microsoft
Access application.
The Java applet would allow access to the application through a web browser on any PC
and it would eliminate the need for users to install a program. But the tool would not be
supportable initially, as no one in the organization had any experience programming in
43
the Java environment. The functionality would also be more limited due to the greater
complexity of Java development over Access.
The Access application would seamlessly integrate with the QualityLink database, and
forms could be developed rapidly. The organization was familiar with Access
applications, so the system could be supported relatively easily. Users would be required
to run an installation procedure in order to access the data, but the initial user group was
expected to be small.
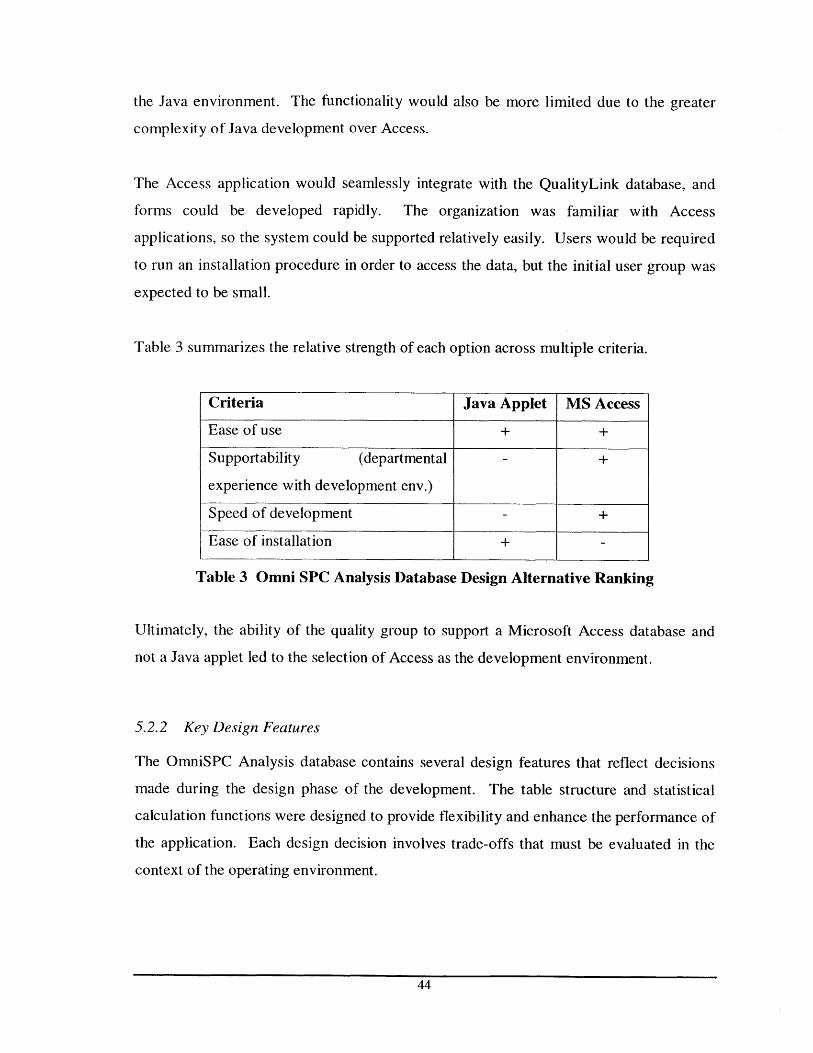
Table 3 summarizes the relative strength of each option across multiple criteria.
Criteria Java Applet MS Access
Ease of use + +
Supportability (departmental - +
experience with development env.)
Speed of development +
Ease of installation +
Table 3 Omni SPC Analysis Database Design Alternative Ranking
Ultimately, the ability of the quality group to support a Microsoft Access database and
not a Java applet led to the selection of Access as the development environment.
5.2.2 Key Design Features
The OmniSPC Analysis database contains several design features that reflect decisions
made during the design phase of the development. The table structure and statistical
calculation functions were designed to provide flexibility and enhance the performance of
the application. Each design decision involves trade-offs that must be evaluated in the
context of the operating environment.
44

Extensible Table Structure
The overriding philosophy that guided the development of the OmniSPC Analysis
database was to provide the user flexibility to perform statistical analysis on every test
attribute measured in the Omni test process, without having to write any additional code
or understand how to write SQL queries. This required changes to the table structure of
the QualityLink database. Data is stored in QualityLink in tables that loosely reflect the
physical collection of data in the process. A separate set of tables store the test results for
each test step (Centerplate Functional, Vibe, etc.). There is some overlap; Vibe and ATP
share a table. Centerplate Functional and Environmental also have data spread across
multiple tables.
StationNameStatonTypeLocation
Figure 14 QualityLink Table Structure
I was unable to determine if the QualityLink table structure was consciously designed to
support specific needs or if it just evolved to its existing state. Either way, the dispersion
45
of test result data amongst several tables made it difficult to develop a generic query tool
that would easily expand to support future analysis without the need for additional
programming.
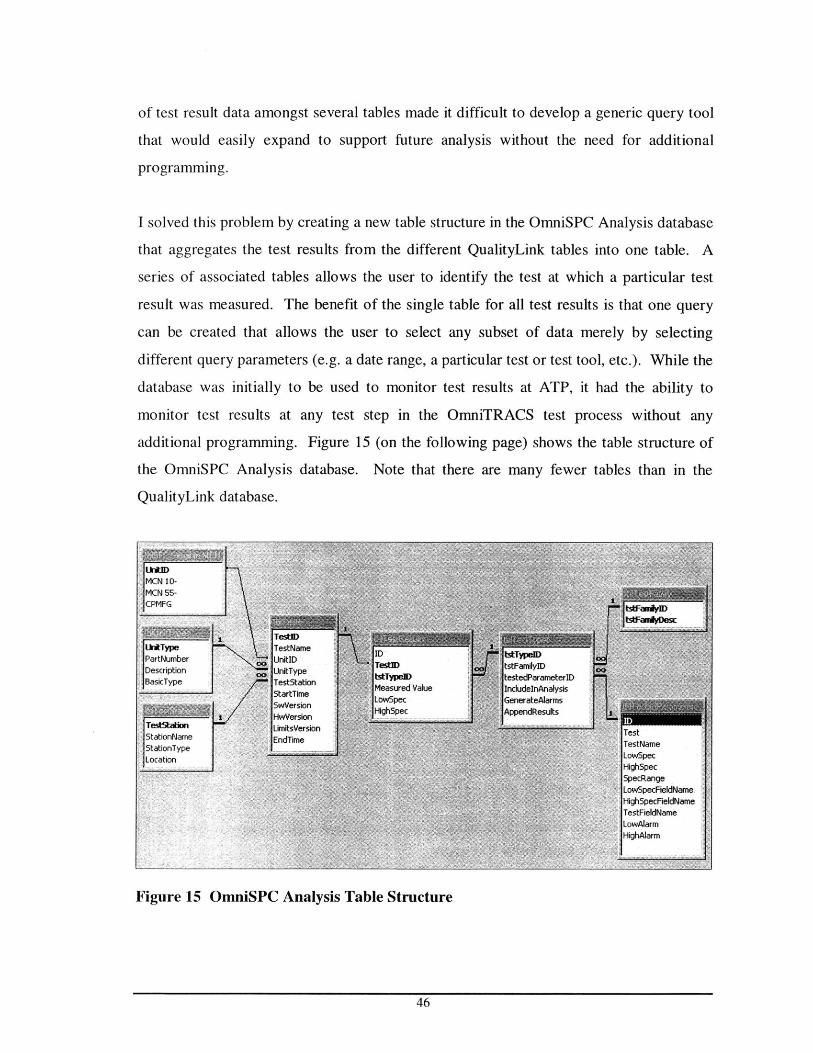
I solved this problem by creating a new table structure in the OmniSPC Analysis database
that aggregates the test results from the different QualityLink tables into one table. A
series of associated tables allows the user to identify the test at which a particular test
result was measured. The benefit of the single table for all test results is that one query
can be created that allows the user to select any subset of data merely by selecting
different query parameters (e.g. a date range, a particular test or test tool, etc.). While the
database was initially to be used to monitor test results at ATP, it had the ability to
monitor test results at any test step in the OmniTRACS test process without any
additional programming. Figure 15 (on the following page) shows the table structure of
the OmniSPC Analysis database. Note that there are many fewer tables than in the
QualityLink database.
Figure 15 OmniSPC Analysis Table Structure
46

Changing the table structure had one key drawback. A batch routine is required to insert
data into the new tables. The test software automatically logs data into the distributed
tables in the QualityLink database on what amounts to a real-time basis. Microsoft
Access 97 doesn't contain triggers, so a manual batch update routine is required to copy
new test results from the old tables into the new tables. This process could be set up to
run on a periodic basis, but initially the user must click a button to run the data upload
routine. This means that the OmniSPC Analysis database may not contain the most
current information when a user views a run chart or runs a report.
Batch Statistical Calculations
The primary feature provided by the OmniSPC Analysis database is run charting
capability for any test attribute on any test station in the Omni test process. The user can
select a test parameter, part number, centerplate manufacturer, and test station, and then
input a desired date range over which they want to see the run chart of test results. The
run chart plots subgroup averages and an additional run chart of subgroup ranges is
provided, too. During the design phase, the question was when and where to perform the
statistical calculations underlying the data in the charts.
One option was to have the client perform all statistical calculations only when requested.
This option reduces the load on the server and may be more efficient, as only the desired
calculations are performed. However, performance was unacceptable, especially when a
user generated multiple run charts consecutively. The wait between each report
generation was too long for the tool to be useful.
Another option was to mimick a data warehousing environment by performing all
statistical calculations in the main database and allow users to run reports off of the
centralized data. This option reduces the load on the clients and reduces network traffic,
as only the desired subset of pre-calculated data is sent over the network to the client. It
also reduces flexibility, as all users are limited to the same analysis. If one user wants to
view the results in subgroups of 10 and another in subgroups of five, they wouldn't be
able to do so simultaneously.
47
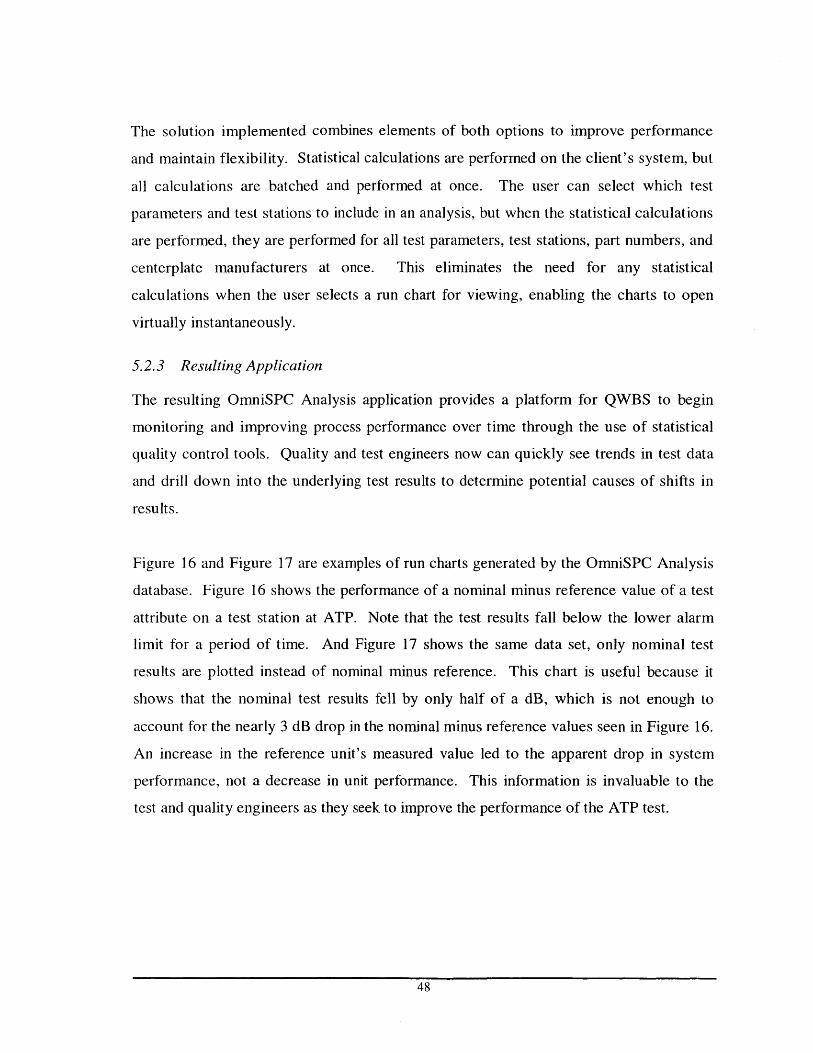
The solution implemented combines elements of both options to improve performance
and maintain flexibility. Statistical calculations are performed on the client's system, but
all calculations are batched and performed at once. The user can select which test
parameters and test stations to include in an analysis, but when the statistical calculations
are performed, they are performed for all test parameters, test stations, part numbers, and
centerplate manufacturers at once. This eliminates the need for any statistical
calculations when the user selects a run chart for viewing, enabling the charts to open
virtually instantaneously.
5.2.3 Resulting Application
The resulting OmniSPC Analysis application provides a platform for QWBS to begin
monitoring and improving process performance over time through the use of statistical
quality control tools. Quality and test engineers now can quickly see trends in test data
and drill down into the underlying test results to determine potential causes of shifts in
results.
Figure 16 and Figure 17 are examples of run charts generated by the OmniSPC Analysis
database. Figure 16 shows the performance of a nominal minus reference value of a test
attribute on a test station at ATP. Note that the test results fall below the lower alarm
limit for a period of time. And Figure 17 shows the same data set, only nominal test
results are plotted instead of nominal minus reference. This chart is useful because it
shows that the nominal test results fell by only half of a dB, which is not enough to
account for the nearly 3 dB drop in the nominal minus reference values seen in Figure 16.
An increase in the reference unit's measured value led to the apparent drop in system
performance, not a decrease in unit performance. This information is invaluable to the
test and quality engineers as they seek to improve the performance of the ATP test.
48
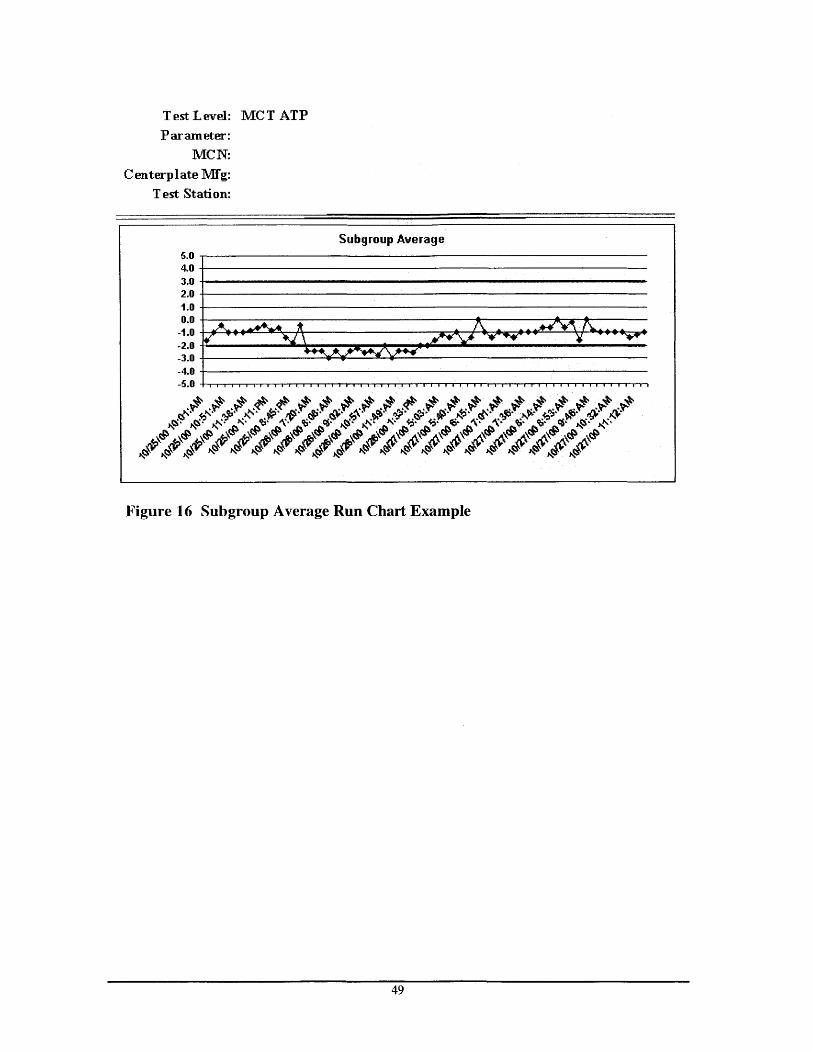
Test Level: MC T ATP
Parameter:
MCN:
Centerplate Mfg:
T est Station:
Figure 16 Subgroup Average Run Chart Example
49
Subgroup Average5.04.03.02.01.00.0 -
-1.0-2.0-3.0-4.*0-6.0.. . . . . . . . .
41 41 4

Test Level: MCT A TPParameter:
MCN:Centerplate Mfg:
Test Station:
Subgroup Average20.0
19.018.0
17.0
16.0
16.0
14.0- 009
13.0
Figure 17 Nominal Subgroup Average Run Chart Example
5.3 Recommended IT Vision
The OmniSPC Analysis database is an effective tool to help QWBS begin using
statistical quality control to understand and improve the performance of the OmniTRACS
test process. However, it is not a robust, enterprise application. Nor is it the most
efficient tool to provide the functionality it delivers. If QWBS finds the tool useful and
wants to expand upon the capabilities offered by the OmniSPC Analysis database (by
developing real-time SPC, for example), then it needs to integrate the capabilities into its
enterprise IT environment.
Figure 18 (page 51) outlines a vision for the IT environment that would support both real-
time statistical process control and on-line analytical processing of test data. In this
scenario, each tester runs a local application that monitors the state of the tool. Ideally,
each tester would run a web server, enabling engineers to monitor tool performance
remotely over the web. Data from each tester is uploaded into a data warehouse
50
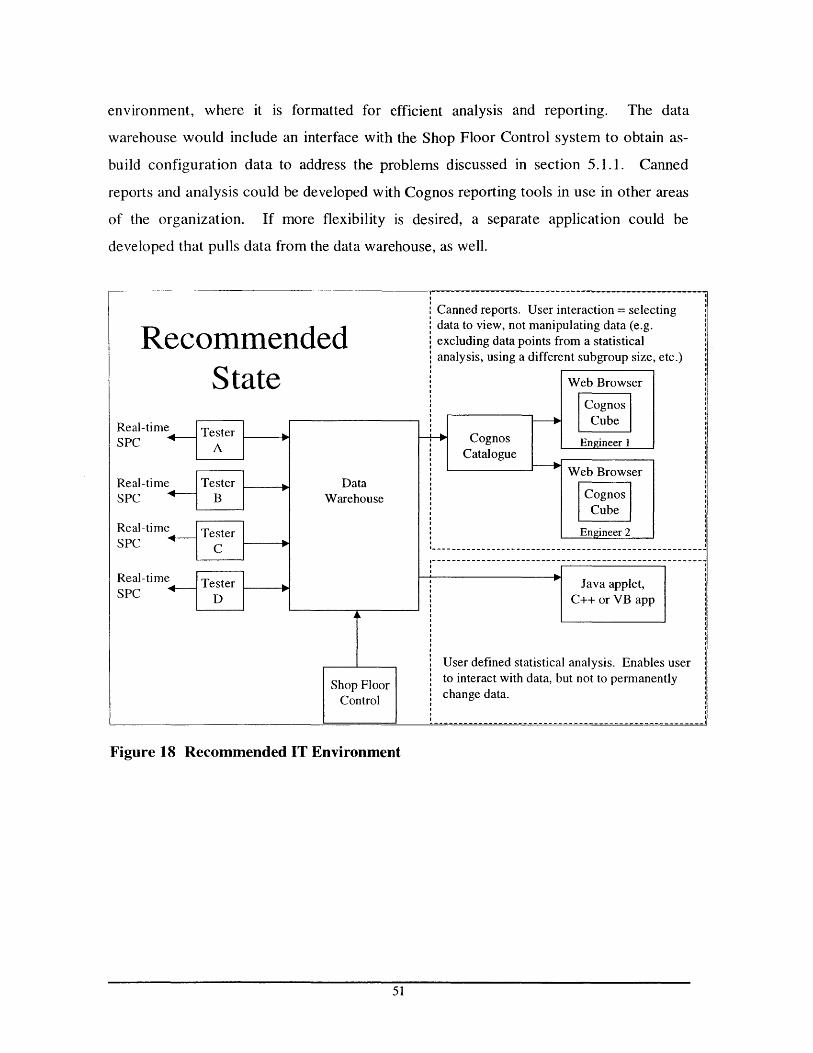
environment, where it is formatted for efficient analysis and reporting. The data
warehouse would include an interface with the Shop Floor Control system to obtain as-
build configuration data to address the problems discussed in section 5.1.1. Canned
reports and analysis could be developed with Cognos reporting tools in use in other areas
of the organization. If more flexibility is desired, a separate application could be
developed that pulls data from the data warehouse, as well.
RecommendedState
Real-time TesterSPC A
Real-time TesterSPC B
Real-time TesterSPC C
Real-time TesterSPC D
DataWarehouse
Shop FloorControl
Canned reports. User interaction = selectingdata to view, not manipulating data (e.g.excluding data points from a statisticalanalysis, using a different subgroup size, etc.)
Web Browser
- srfCognos Engineer ICatalogue
Web Browser
Engineer 2
--------------------- ---------------------------------
Java applet,C++ or VB app
User defined statistical analysis. Enables userto interact with data, but not to permnanentlychange data.
Figure 18 Recommended IT Environment
51
-------------------- ---------------------------------

6.0 Organizational Observations
Ideally, the internship process consists of more than just performing a specific task or
analysis for a company. The goal is to facilitate a sustainable improvement in the
organization. Analysis of the organizational setting and the context in which the
internship/project is operating is essential to achieve this goal. This chapter uses several
tools to analyze the QWBS organization. Section 6.1 uses the three lenses approach
developed by Ancona, Kochan, Scully, Can Maanen, and Westney to evaluate the project
from the strategic design, political, and cultural perspectives. Section 6.2 discusses how
the change process was managed during the internship. And section 6.3 evaluates the
overall effectiveness of the internship as an organizational change initiative and offers
some recommendations for future efforts.
6.1 Three Lenses Analysis
The three lenses provide a useful framework for analyzing the internal forces that
affected the effort to improve QWBS's manufacturing test processes. Without explicitly
using the 3 Lenses framework, the organization had already recognized some of the
political issues that the framework reveals before the internship began, and they instituted
some changes in an attempt to fix those issues. However, the analysis provides some
additional insight into the factors working against successful implementation of process
improvements.
6.1.1 Project Setting
Before the internship began a yield improvement team was created that had four goals:
" Improve yields (95% First-pass Yield at each test step)
" Lower product cycle time
" Improve quality
" Understand CND failures
Team membership included the head of the Test Engineering department (the developers
of the test hardware and software), the head of the Quality department (part of
52

manufacturing), and representatives from engineering (the product designers) and
operations. The team made little progress. Team members didn't have or make the time
to gather the data necessary to make informed decisions. Political clashes between the
head of the Test Engineering group and the manufacturing organization interfered with
meaningful discussion.
The internship was proposed to help the team achieve its goals. The manufacturing
group recognized that it lacked a dedicated resource to collect and analyze process data,
and an intern would be able to provide the singular focus the project needed to make
progress. Also, the organization recognized its inexperience with the use of statistics to
evaluate process performance. The hope was for an intern to bring those skills into the
team to be used both to help improve the test process and to teach the organization how
to use statistics more effectively to improve the manufacturing operations.
As the intern, I reported to the manager of the Quality group and I participated on the
existing yield improvement team. Most of the analysis I was to perform could be done so
individually, but members of the quality and Test Engineering groups and operators on
the factory floor were all available to provide assistance when needed.
53
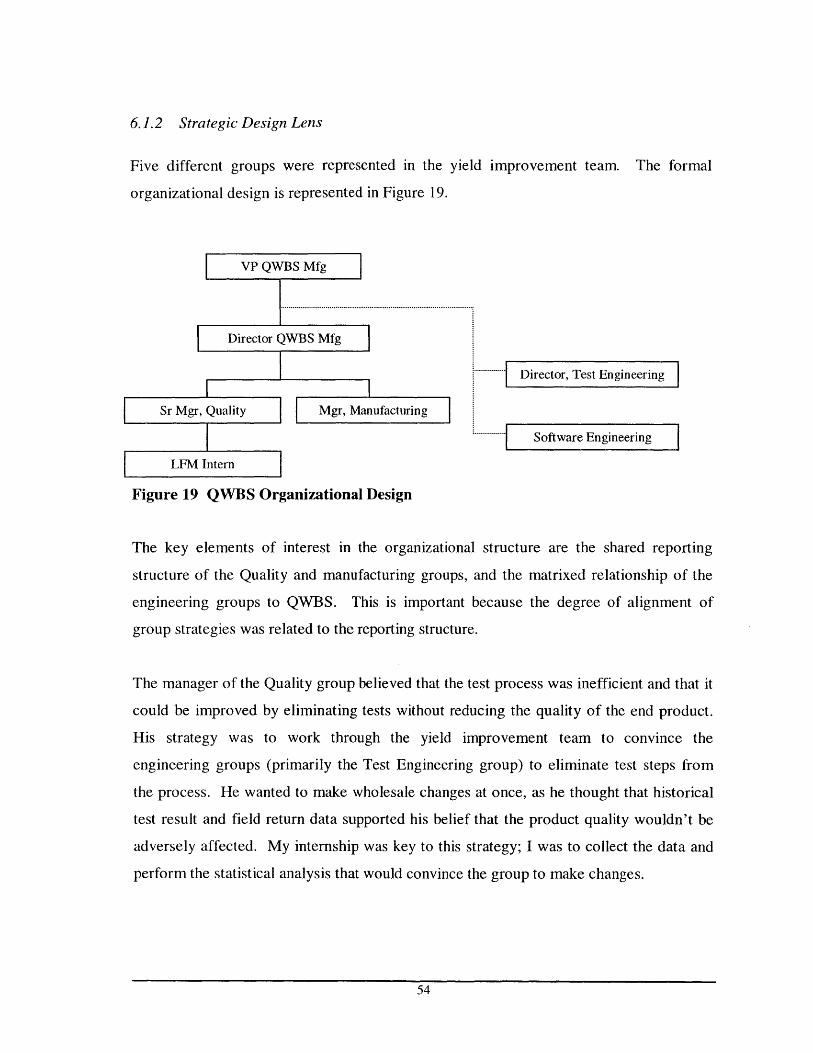
6.1.2 Strategic Design Lens
Five different groups were represented in the yield improvement team. The formal
organizational design is represented in Figure 19.
VP QWBS Mfg I
Director QWBS Mfg
Director, Test Engineering
Sr Mgr, Quality Mgr, Manufacturing
Software Engineering I
LFM Intern
Figure 19 QWBS Organizational Design
The key elements of interest in the organizational structure are the shared reporting
structure of the Quality and manufacturing groups, and the matrixed relationship of the
engineering groups to QWBS. This is important because the degree of alignment of
group strategies was related to the reporting structure.
The manager of the Quality group believed that the test process was inefficient and that it
could be improved by eliminating tests without reducing the quality of the end product.
His strategy was to work through the yield improvement team to convince the
engineering groups (primarily the Test Engineering group) to eliminate test steps from
the process. He wanted to make wholesale changes at once, as he thought that historical
test result and field return data supported his belief that the product quality wouldn't be
adversely affected. My internship was key to this strategy; I was to collect the data and
perform the statistical analysis that would convince the group to make changes.
54

The manufacturing group was closely aligned with the Quality group. Its primary
strategy was to reduce manufacturing costs, so it supported the Quality group in its
efforts to eliminate test steps. Its key goal was to eliminate the Burn-In test; the two
burn-in tools consume a lot of power and they account for a significant portion of the test
time, and they take up a lot of floor space.
The Test Engineering group agreed with the strategy to improve the efficiency and
effectiveness of the test process, only it wanted to be more deliberate with the change
process. A new director came into the position just before my arrival, and he wanted to
change the focus of his organization. Historically, the Test Engineering group owned the
test process. It developed the test software, selected and or built the test hardware, and
acted as the "defenders of product quality" (which translated into "don't change the test
process because it works"). The new direction with the new director was to focus on the
development of robust test systems (hardware and software), but to let the quality group
choose which tests it wanted to perform on its product.
To support this strategy, the Test Engineering manager wanted to lay out the entire test
process and look for overlaps in test functionality. He was extremely interested in my
project, as he recognized the value of statistical analysis, but his organization didn't have
any expertise in that area. He hoped that I would be able to develop some tools that
would enable his group to utilize statistical quality control to improve the repeatability
and reliability of the test processes they developed.
The strategies of the other engineering groups (both hardware and software) involved in
the project were somewhat in conflict with the efforts of the yield improvement team.
The primary goal of these groups was to ensure that the changes to the test systems
proposed by the team wouldn't inhibit their ability to test the effects of product changes
under design. This goal reflects these groups' view that one role of the manufacturing
line was to be a test ground for the engineering organization. They were comfortable
with the existing test process, because they understood its capabilities. Convincing the
55
engineers in these groups to make changes in the process would require a different set of
criteria than that required for the rest of the team.
Since the different stakeholders involved in the project didn't report to a single manager
with decision-making authority, the yield improvement team had been created to
facilitate interaction amongst the different groups. Team membership included the heads
of each group, so the group had sufficient decision-making authority. Resources could
also be committed, so no additional structure was required to obtain approval for
implementation efforts.
The distribution of skills and knowledge amongst the various organizations made it
necessary for me to work closely with both the Quality group and the Test Engineering
group throughout the project. The Quality group continuously analyzed test results, so it
understood which tests were problematic. The Test Engineering group didn't spend
much time looking at process or product performance, but it knew the tasks performed at
each test did, and how they are performed. Additionally, the group had control over the
data collection systems for test results. Gaining an understanding of how the tests
worked was essential to the development of meaningful statistical tests. Accessing the
source data allowed me to both run the statistical tests and create an application to
automate data analysis in the future.
Based on my recommendations, the yield improvement team agreed to eliminate some
tests and to expand specification limits on some others. The Test Engineering group was
concerned that expanding the test limits would allow the process to drift off target
without warning, so I developed an application that checked test results against the older
specification limits and generated alarms whenever the test results exceeded those limits.
An alarm response team was created to respond to these conditions as they occurred. The
team was unique because it included staff engineers from the Quality group, the Test
Engineering group, and the manufacturing operations group. Bringing representatives
from all three groups together allowed the team to better diagnose the cause of an alarm
condition and to develop solutions. The test alarm team was the first cross-functional
56
implementation team of its kind in QWBS; it created a learning environment where
product and process knowledge were combined to improve the manufacturing process. It
was successful because the formation of the team was a consensus decision amongst the
various members of the yield improvement team.
At the end of the internship I recommended that each test step be assigned to a specific
engineer who would have total responsibility for the tool's performance, including yield
and maintenance. The existing organizational structure distributes ownership of the tester
performance across three groups, which makes accountability for the tester performance
more difficult to assign. Intel Corp., for example, successfully utilizes the concept of
module owners in its factories to ensure each tool has a resource dedicated to maintaining
and continuously improving its performance, and I believe that a similar focus would
facilitate process improvement efforts within QWBS.
6.1.3 Political Lens
While the structure of QWBS and its relationships to the engineering groups posed some
challenges to implementing changes to the test process, politics played the biggest role in
determining the success of the project. Multiple stakeholders participated on the yield
improvement team, each from organizations with different strategies and each with
different interests and sources of power. By understanding the different stakeholder
needs, I was able to forge relationships that enabled me to transcend the politics that had
hindered change in the past.
57
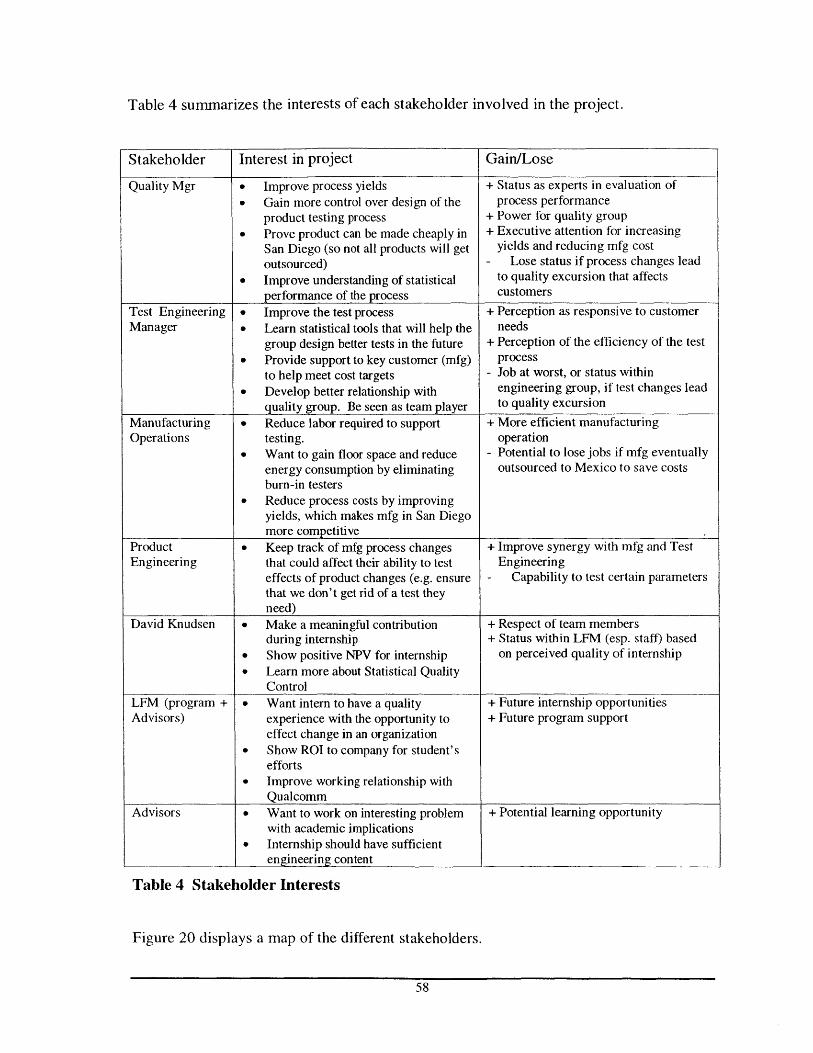
Table 4 summarizes the interests of each stakeholder involved in the project.
Stakeholder Interest in project Gain/Lose
Quality Mgr 0 Improve process yields + Status as experts in evaluation of0 Gain more control over design of the process performance
product testing process + Power for quality group0 Prove product can be made cheaply in + Executive attention for increasing
San Diego (so not all products will get yields and reducing mfg costoutsourced) - Lose status if process changes lead
0 Improve understanding of statistical to quality excursion that affects
performance of the process customers
Test Engineering 9 Improve the test process + Perception as responsive to customerManager 0 Learn statistical tools that will help the needs
group design better tests in the future + Perception of the efficiency of the test0 Provide support to key customer (mfg) process
to help meet cost targets - Job at worst, or status within0 Develop better relationship with engineering group, if test changes lead
quality group. Be seen as team player to quality excursion
Manufacturing 0 Reduce labor required to support + More efficient manufacturingOperations testing. operation
* Want to gain floor space and reduce - Potential to lose jobs if mfg eventuallyenergy consumption by eliminating outsourced to Mexico to save costsburn-in testers
0 Reduce process costs by improvingyields, which makes mfg in San Diegomore competitive
Product 0 Keep track of mfg process changes + Improve synergy with mfg and TestEngineering that could affect their ability to test Engineering
effects of product changes (e.g. ensure - Capability to test certain parametersthat we don't get rid of a test theyneed)
David Knudsen 0 Make a meaningful contribution + Respect of team membersduring internship + Status within LFM (esp. staff) based
0 Show positive NPV for internship on perceived quality of internship0 Learn more about Statistical Quality
ControlLFM (program + 9 Want intern to have a quality + Future internship opportunitiesAdvisors) experience with the opportunity to + Future program support
effect change in an organization0 Show ROI to company for student's
efforts0 Improve working relationship with
QualcommAdvisors 0 Want to work on interesting problem + Potential learning opportunity
with academic implications* Internship should have sufficient
engineering content
Table 4 Stakeholder Interests
Figure 20 displays a map of the different stakeholders.
58

Advisors
Quality Manager
David Knudsen
LFM
+/a b Yield ImprovementTest Engineering Project
Manager OmniSPC
SpAnalysis DB
+ +/-Customers
Former Test nrgierEngineering Mfg Operations Engineering
Manager
Figure 20 Stakeholder Diagram
In general, the interests of each stakeholder were fairly well aligned. This was due
primarily to a change that had been made in the Test Engineering management. Up until
the time the internship started, the same Test Engineering manager had been running the
group for years. He believed that the test suite that had been developed worked well, as
evidenced by QWBS's reputation for high-quality products. He resisted suggestions on
how to improve the process, even when they were based on data. Some members of the
organization believed that he didn't want to give up the power that he had developed in
his position.
The former manager of the group was replaced by a member of the Test Engineering
organization with the expressed goal of improving teamwork between Test Engineering
and manufacturing. Thus the new manager's interests were aligned with those of
manufacturing at a high level.
59

However, the new Test Engineering manager recognized that he was ultimately
responsible to the engineering management, not manufacturing, and any foul-ups caused
by changes to the test process could mean his job. Thus he was more cautious, wanting
to create a convincing case based on good data and sound analysis before instituting
change.
As stated previously, the product engineering groups represented on the project were
primarily concerned about their ability to test changes to the product they designed. They
understood the capabilities of the existing test process, and they were generally wary of
change.
While the interests of each stakeholder involved in the project were reasonably aligned,
the distribution of power amongst the stakeholders was very unequal. The Test
Engineering group historically had controlled the test process. They defined the content
of the tests, the tools used to perform the tests, and they established their own list of
priorities for maintaining and improving the process. Manufacturing had little input.
They made suggestions on where to focus resources, but had little influence over the Test
Engineering group.
The Test Engineering group also established the specification limits of the tests, which
meant that it basically controlled the determination of what product could be shipped to
customers. The Quality group had some strong feelings about the validity of some of the
test limits, but they had been unsuccessful in getting them changed.
If the project was successful, the manufacturing (and Quality) groups stood to gain power
from the Test Engineering organization. They would wrest some control over the
establishment of test limits, and they would gain influence over the allocation of Test
Engineering resources.
The real power within the organization seemed to reside in the product engineering
group. Qualcomm was founded by engineers focused on technology, not manufacturing,
60
and ultimate power remained in the hands of the developers of technology. My project
wasn't going to change that dynamic. The product engineers participating on the team
could derail the process if it affected them adversely, so it was important to ensure they
understood the nature of any proposed changes and the justification for making the
changes.
The biggest challenge facing the yield improvement team was overcoming past norms of
decision making. Historically, the Quality group would present data to the team
summarizing the frequency of each type of test failure, trying to justify the elimination or
change to a test. The team would then either argue about the validity or interpretation of
the data. The arguments were typically based on personal beliefs that weren't stated
expressly. These conflicts were "resolved" by inaction and frustration and no changes
were made. Fortunately, the management change within the Test Engineering
organization eliminated a key source of these personal differences, enabling the group to
better focus on collecting and analyzing data to make informed decisions.
6.1.4 Cultural Lens
The yield improvement project had symbolic meaning on several different levels. An
unspoken concern in the group was that all manufacturing would eventually be
outsourced to lower cost contract manufacturers in Mexico. The drive to improve yields
represented on some level an effort to save manufacturing in San Diego. The project also
symbolized the effort to improve working relations between the Test Engineering and
quality groups. Finally, the internship reflected the desire to incorporate more rigorous
statistical analysis tools into the manufacturing process.
The project focused on the collection and presentation of unbiased, statistical data that
helped explain why products were failing, not just stating that they were. This provided a
different focus on data than was the norm. I also tried to follow a more rigorous process
for problem solving - identifying the issue, proposing an experiment to collect data,
developing evaluation/decision criteria, collecting and analyzing data, presenting results,
61

and making a decision. This challenged the team to work outside of its typical methods
of making decisions. Hopefully, the example of a more rigorous approach to problem
solving and decision making will influence the team processes used in the future.
As an outsider, I was also unaware of and/or unconcerned about some of the cultural
symbols that restrained some other members of the organization. Badge number played a
large role in the amount of influence wielded by team members. For instance, one
typically outspoken team member was hesitant to defend his ideas when questioned by a
senior member of the product engineering organization. Unconstrained by a fear of
badge number, I confidently justified my use of statistics in a particular experiment we
had designed. As it turned out, respect for technical competence won out over any
political issues, and my behavior was positively reinforced. This dynamic may have been
different had I been looking for a long-term position within the organization, but my
status as an employee of another company enabled me to avoid any socialization that may
have occurred otherwise.
Formal communication of my project consisted of an email introduction saying I was
working on a project to help improve yields. The yield improvement goals were
reviewed in the Quality team meeting once or twice during the six months I was there,
but basically the project visibility was limited to those participating on the yield
improvement team and to those who were assigned tasks by the team. Updates were
provided on a monthly basis to senior staff by the quality manager, but I was not invited
to the meeting where this took place, so I don't know how much emphasis senior
management placed on weekly progress toward the team goals.
My role on the project was communicated primarily in the introductory email, which
played on the fact that I was an outside "expert" from MIT. Since technical skills are
valued in the organization, the MIT brand name gave me instant credibility, both within
the engineering ranks and down on the factory floor.
62

As my skills became evident to the organization, some engineers saw my presence as an
opportunity to get their own projects moving (utilizing my statistical knowledge to
perform some experimental data analysis, for example). I became a technical resource to
complete tasks they either didn't know how to do or didn't have the time to do.
Operators on the floor saw me as a person to tell their problems too, expecting that I had
the power somehow to fix them. Irrespective of how I was perceived by different
members of the organization, I was uniformly treated as a colleague and employee, not as
an outsider. I think that is reflective of the open, congenial culture of Qualcomm (and
perhaps San Diego, more generally).
6.1.5 Putting the 3 Lenses Together
Each lens on its own provides useful insight into the organization. However, when the
three are used simultaneously, you begin to notice causal relationships that can help guide
change efforts. The political lens tells me that the engineering organizations have a lot of
power, and the cultural lens reveals that low badge numbers, primarily belonging to the
founding engineers, carry prestige and respect. The strategic design lens tells me that the
Quality group should have the authority to make changes to the test process, but the
political lens shows that it didn't have the influence to do so.
These observations are useful tools in planning the change process. They help identify
the key players and how they can be influenced most effectively. They also point out
potential potholes that should be avoided.
While general lessons can be drawn from the process of the Three Lenses analysis of the
QWBS organization, the findings are specific to the organization. Symbols of power in
an organization (low badge number, in this case) are different across companies. The key
lesson is to recognize the value of understanding the organization in which you are trying
to implement change and to use that knowledge to achieve results.
63
6.2 Managing the Change Process
The yield improvement process was not embedded in a larger organizational change
initiative. The Quality group was working to implement HALT (highly accelerated life
testing) and HASA (highly accelerated stress auditing), but its efforts focused on the
newer products under development, not the OmniTRACS product. The project related to
the 2 x 4 plan described in the introduction (double revenue and double profitability in
four years) in that future cost reductions would need to come from improved
manufacturing efficiency. The 2 x 4 initiative was not publicized visibly, though; the
average employee would likely not even know of its existence.
The change model our project implicitly embraced was bottoms-up, incremental, and
continuous. We were forging a new relationship between Test Engineering and Quality
that would help facilitate future process improvements. Our plan was to make changes to
the test process one step at a time, focusing on the end of the process first. The
incremental process would allow the team to learn from each change, allowing it to
improve the change process and minimize the risk to product quality. The statistical
software tools I developed would allow the team to continue evaluating the statistical
state of the process and make additional improvements. The change process was
emergent in that we weren't really sure what skills and/or structures would be required to
support the changes until we had determined the nature of the changes.
64

6.2.1 Kotter's Eight Steps
Table 5 summarizes the change process in terms of Kotter's eight steps.
Step Action taken
1. Establishing a sense of urgency. * 2 x 4 plan necessitated cost reductions in the
manufacturing operations. Process efficiency
improvements required to meet the goal.
* Market demand decreasing and competition increasing.
QWBS beginning to outsource mfg of newer products, and
headcount had been reduced in San Diego facility, so need
to improve efficiency to save jobs.
2. Forming a powerful guiding 0 Yield improvement team created with head of Testcoalition. Engineering, head of quality, head of mfg operations, and
primary designer of the OmnitTracs product.3. Creating a vision. 0 Yield improvement team established a goal of 95% first-
pass yield at each test station.+ I used statistical analysis of process data at the last test step
to show the potential yield improvements and cost savingsof eliminating some tests and increasing spec limits onothers at the final test step.
4. Communicating the vision. 0 Quality manager presented yield targets to seniormanagement in mfg, Test Engineering, and productengineering. Communication to shop floor done primarilyas an FYI, since the process changes primarily involvedsoftware changes, not operational changes.
+ Presented ATP change plan and potential cost savings toyield improvement team.
5. Empowering others to act on the 0 Eliminated primary barrier to change by replacing thevision. manager of the Test Engineering organization.
* Funded the.internship to bring in a dedicated resource tofocus on the project.
6. Planning for and creating short-term + Yield improvement team started with easy-to-implementwins. changes to the last test step (ATP) that immediately
improved ATP yields from 88% to 98%.+ Developed database application that enabled quality
engineers and test engineers to monitor processperformance graphically. The tool enabled theimplementation of the ATP changes.
7. Consolidate Improvements andProduce More Change
8. Institutionalize the New Approaches
Table 5 Kotter's Eight Steps to Transforming the Organization
65
Table 5 includes actions taken on the part of the QWBS organization to facilitate the
yield improvement efforts (round bullets), and actions taken on my behalf as a part of my
internship (diamond bullets).
By the end of my internship the project reached a stage where we had achieved a short-
term win with the ATP changes, but did not progress to the next step of consolidating the
improvements. My final presentation to the QWBS management recommended that
some engineers be dedicated to process improvement efforts and that all of the staff
engineers be offered training in statistical quality control tools, but no action was taken
on those recommended actions before the conclusion of the internship. Had I been a
permanent member of the organization, I would have continued to advocate for the
institutionalization of SPC practices to consolidate the changes we had made already.
6.2.2 The Yield Improvement Team - Internal Process Assessment
The internal processes used by the yield improvement team, and at QWBS in general,
were inadequate. Team meetings generally consisted of a group of engineers arriving 10
minutes late, grabbing their requisite drink provided by the meeting coordinator, and then
updating each other on any progress made since the previous meeting. Agendas were
few and far between. Discussions tended to wander off topic, and team members seldom
stepped in to bring everyone back on track. Quiet team members were rarely engaged in
discussion. Decisions were rarely documented.
Early in my internship I brought up this observation with my supervisor, who was leading
the yield improvement team. He agreed with my assessment and proceeded to show me
the work the team had done when it was first formed - team charter, roles and
responsibilities, expectations, metrics, and success criteria. He had clearly taken a class
on high-performing teams, but he had not translated the learnings into his daily
management techniques.
I suggested a template for documenting decisions made, and even presented it to the team
at one meeting, but the response was underwhelming. It would have been inappropriate
66
for me to try too hard to force change on the team. Norms had been established, and my
supervisor was the team lead. Instead, I coached team members whenever opportunities
presented themselves.
I'm convinced that one of the primary reasons for the team's inability to accomplish its
goals prior to the internship was due to the lack of team processes. A "team" was never
truly created. Decisions were not made, because a process to make them was never
established. Strong team processes may have been able to overcome the political and
organizational barriers to implementing change. Weak team processes amplified the
barriers, making change nearly impossible.
In retrospect, I should have spent more time trying to better implement team processes
characteristic of high performing teams. This would have contributed more to
organizational learning than to a specific technical analysis. My lack of positional
authority made it difficult, but I could have pushed harder on team processes like
agendas, decision tracking, decision criteria, and performance measures.
6.3 Evaluation and Recommendations
Recall the yield improvement team's four primary goals:
0 Improve yields (95% First-pass Yield at each test step)
0 Lower product cycle time
0 Improve quality
0 Understand CND failures
As stated in Chapter 4, first-pass yields at the final test step had improved from 88% to
97% by the end of the internship. The average test time per unit had fallen from -10
minutes to -6 minutes at ATP. Product quality remained unchanged, subject to
inspection of future data on field returns. And the team could explain why CND's
occurred at ATP. The changes resulted in anticipated annual savings of over $45,000,
and the OmniSPC database I developed would help tackle the next round of
improvements.
67
Excitement with the results was apparent at all levels of the organization. The VP of
Manufacturing (the internship sponsor) was appreciative of my contributions, but more
importantly, she wanted to know who was assigned to carry on with the data analysis in
my absence. She valued the results enough to focus on sustaining the momentum the
team had gathered.
Unfortunately, I don't believe that the learning diffused sufficiently throughout the
organization to be sustained without the addition of resources dedicated to process
improvement. The engineers with the skills to lead process improvement efforts are
over-committed just fighting fires, and the incentive system of the organization rewards
that behavior. Some eyes had been opened, but not enough inertia had been generated to
sustain the effort without a strong leader guiding the process.
The key reason I was able to be successful in my internship was my ability to forge a
strong working relationship with the decision-makers in different stakeholder groups.
The director of the manufacturing organization commented to me in an exit interview that
I was the first person to bridge the Test Engineering and Quality groups. The reason I
was able to bridge the gap was that I offered myself as a resource to both groups. I tried
to be perceived as an unbiased participant in the project, not a member of any political
faction.
I also believe I was successful because I was confident enough to be myself. That meant
I avoided falling into the "negative" norms I perceived in QWBS. I created agendas for
my meetings and followed up with meeting minutes. I documented proposed
experiments, decision criteria, data, and results, and distributed the information to all
interested parties. I was willing to behave differently and be noticed for it. You need to
operate within the cultural and managerial boundaries of the organization, but as a change
agent, you sometimes need to avoid conformity.
68
7.0 Summary
Statistical process control tools, if leveraged effectively, can help manufacturing
companies improve quality and reduce cost. To some, though, SPC sounds too
complicated to implement. If you read journal articles on the topic, for example, you'll
find that a wealth of research goes into determining the most appropriate methods for
reducing the affects of autocorrelation on control chart performance. Time series
modeling, autoregressive integrated moving average models, and other important aspects
of SPC can make SPC seem too daunting to tackle.
But automated control charts with feedback to automatically adjust process tool
parameters is not required to derive benefit from a statistical quality control program.
Sometimes, just the process of developing control charts can yield positive benefits. At
Qualcomm, analyzing and understanding the distribution of measurements in the
OmniTRACS test process provided a wealth of information that wasn't evident in failure
paretos. This information alone enabled the team to dramatically improve yields with
little effort. As the organization becomes more comfortable and adept with the use of
SPC, it may then find that more complicated statistical process control tools will add to
its understanding of the process and enable it to monitor the process more effectively.
But starting with a set of tools that can be understood and implemented by the
organization is essential to the long-term success of a statistical quality control program.
The success of this project benefited from the existence of low-hanging fruit in the test
process. The issues uncovered at ATP were relatively easy to address by changing some
specification limits and eliminating some non-value added tests. And there is definitely
more room for improvement. The question facing the QWBS organization is whether it
wants to commit to the process of reducing variation until, as Deming (1986, p. 49)
stated, "specifications are lost beyond the horizon." This requires more than a short-term
project. It requires a change in the culture of the organization. Engineers need to be
equipped with the tools to succeed, including training and software. And management
must create incentives and provide sufficient resources to focus the organization on
process improvement, rather than firefighting.
69
The success of the yield improvement team was a good first step in creating sustainable
change within QWBS. Improving yields at ATP from 88% to 97% generated excitement
and enthusiasm within the organization. The benefits of a stronger synergy between the
Test Engineering and quality groups were tangible. And the OmniSPC Analysis
application provides a tool to facilitate future process improvement projects.
But the ATP improvements are just the beginning. The yield improvement team now has
the opportunity to extend the analysis performed at ATP to all other tests in the Omni
manufacturing process. It should also continue the analysis correlating unit field
performance to unit factory test performance to understand if the metrics used to evaluate
product quality in the manufacturing process are useful. The annual savings generated by
the project are commendable, but the potential long-term savings achievable through a
commitment to continuous improvement make continued emphasis on the process a
necessity.
70
References
1. Woodhall, William H. (2000). "Controversies and Contradictions in Statistical ProcessControl." Journal of Quality Technology, Vol. 32.
2. Boyles, Russell A. (2000). "Phase I Analysis for Autocorrelated Processes." Journal ofQuality Technology, Vol. 32, No. 4.
3. Montgomery, Douglas C., Introduction to Statistical Quality Control. John Wiley & Sons,Inc, 1997.
4. Montgomery, Douglas C. and Christina M. Mastrangelo (1991). "Some Statistical ProcessControl Methods for Autocorrelated Data." Journal of Quality Technology, Vol. 23, No. 3.
5. Faltin, Frederick W., Woodall, William H., MacGregor, John F., Ryan, Thomas P. (1991)"Discussion." Journal of Quality Technology, Vol. 23, No. 3.
6. Montgomery, Douglas C. and Christina M. Mastrangelo (1991). "Response." Journal ofQuality Technology, Vol. 23, No. 3.
7. Always, L.C. (1992). "Effects of Autocorrelation on Control Chart Performance, "Communications in Statistics - Theory and Methods, Vol. 21.
8. Ancona, Kochan, Scully, Van Maanen, and Westney, Organizational Behavior and Processes.South-Western College Publishing, 1999.
71
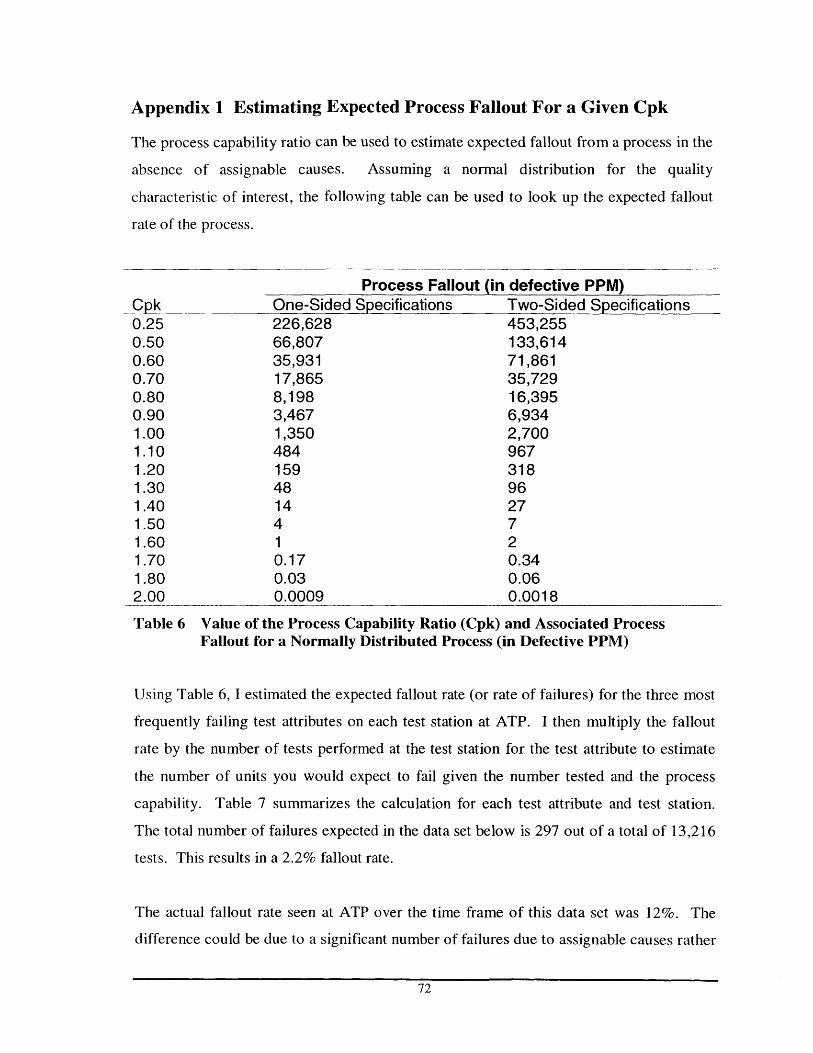
Appendix 1 Estimating Expected Process Fallout For a Given Cpk
The process capability ratio can be used to estimate expected fallout from a process in the
absence of assignable causes. Assuming a normal distribution for the quality
characteristic of interest, the following table can be used to look up the expected fallout
rate of the process.
Process Fallout (in defective PPM)Cpk One-Sided Specifications Two-Sided Specifications0.25 226,628 453,2550.50 66,807 133,6140.60 35,931 71,8610.70 17,865 35,7290.80 8,198 16,3950.90 3,467 6,9341.00 1,350 2,7001.10 484 9671.20 159 3181.30 48 961.40 14 271.50 4 71.60 1 21.70 0.17 0.341.80 0.03 0.062.00 0.0009 0.0018
Table 6 Value of the Process Capability Ratio (Cpk) and Associated ProcessFallout for a Normally Distributed Process (in Defective PPM)
Using Table 6, I estimated the expected fallout rate (or rate of failures) for the three most
frequently failing test attributes on each test station at ATP. I then multiply the fallout
rate by the number of tests performed at the test station for the test attribute to estimate
the number of units you would expect to fail given the number tested and the process
capability. Table 7 summarizes the calculation for each test attribute and test station.
The total number of failures expected in the data set below is 297 out of a total of 13,216
tests. This results in a 2.2% fallout rate.
The actual fallout rate seen at ATP over the time frame of this data set was 12%. The
difference could be due to a significant number of failures due to assignable causes rather
72

than natural variation (though the assignable causes would need to be due to factors other
than unit failures, as most of the 12% of failed units eventually pass on retest). More
likely, the discrepancy is due to violations of the normality assumption underlying this
analysis. Test attributes B and C are limited to integer values due to data transmission
limitations, so the assumption of normality in the underlying data is not perfect. Several
transformations were applied to the data in an attempt to better meet the normality
criteria, but none were successful.
Test Centerplate Test Expected Fallout EstimatedAttribute Supplier Station Cpk # Tests (ppm) Fallout
C 1 Tool 1 0.60 51 35931 2
B I Tooll 1.06 47 750 0A 1 Tool 1 1.32 47 38 0B I Tool 2 0.30 105 180000 19A 1 Tool 2 0.55 92 53000 5C 1 Tool 2 0.59 110 37000 4C 1 Tool 3 0.47 37 95000 4B 1 Tool 3 0.78 33 10000 0A I Tool 3 1.06 28 750 0A 1 Tool 4 0.44 277 100000 28C 1 Tool 4 0.72 295 13500 4B 1 Tool 4 0.78 280 10000 3C 2 Tool 1 0.71 861 12000 10A 2 Tool 1 0.89 793 3800 3B 2 Tool 1 1.05 816 900 1A 2 Tool 2 0.59 1060 37000 39C 2 Tool 2 0.64 1161 23000 27B 2 Tool 2 0.66 1114 21000 23C 2 Tool 3 0.58 667 40000 27B 2 Tool 3 0.70 612 17865 11A 2 Tool 3 0.98 586 1650 1C 2 Tool 4 0.60 1447 35931 52A 2 Tool 4 0.64 1324 23000 30B 2 Tool 4 0.91 1373 3100 4
Total Tests 13216 Total Estimated Fallout 297Resulting Fallout Rate 2.2%
Table 7 Estimated Fallout From ATP For Three Test Attributes
73

One way to reduce the expected fallout from a process is to center the process. If the
mean is centered between the upper and lower specification limits, the process capability
ratio increases. Table 8 calculates the fallout
Test Centerplate Test # Expected EstimatedAttribute Supplier Station Cpk Tests Fallout (ppm) Fallout
C 1 Tool 1 0.75 51 23000 1B I Tool 1 1.69 47 0.5 0A 1 Tool 1 1.38 47 40 0B I Tool2 1.20 105 318 0A 1 Tool 2 0.61 92 67000 6C 1 Tool 2 0.70 110 35729 4C I Tool 3 0.72 37 30000 1B 1 Tool 3 0.94 33 5200 0A 1 Tool 3 1.22 28 280 0A 1 Tool 4 0.70 277 35729 10C 1 Tool 4 0.89 295 7200 2B 1 Tool 4 1.36 280 55 0C 2 Tool 1 0.75 861 23000 20A 2 Tool 1 1.05 793 1400 1B 2 Tool 1 1.11 816 850 1A 2 Tool 2 0.80 1060 16395 17C 2 Tool 2 0.78 1161 20000 23B 2 Tool2 1.12 1114 775 1C 2 Tool 3 0.66 667 50000 33B 2 Tool 3 0.73 612 27000 17A 2 Tool 3 1.09 586 1200 1C 2 Tool 4 0.71 1447 32000 46A 2 Tool 4 0.85 1324 10000 13
,B 2 Tool 4 0.97 1373 3200 4
Table 8 EstimatedMean
Total Tests 13216
Fallout From ATP For Three Test
Total Estimated FalloutResulting Fallout Rate
Attributes With Centered
2021.5%
Process capability can also be improved by increasing the specification range for each
test attribute. Table 9 calculates the fallout from ATP that would be expected if the upper
specification limit for each test attribute were increased from +3dB to +5dB and the
74

lower specification limit increased from
specification range for each test attribute)
-2dB to -5dB (effectively doubling the
Test Centerplate Test # Expected EstimatedAttribute Supplier Station Cpk Tests Fallout (ppm) FalloutC I Tooll 1.20 51 159 4B 1 Tool 1 3.09 47 0 0A 1 Tool 1 2.43 47 0 0B I Tool 2 1.74 105 0.09 0A 1 Tool 2 1.15 92 240 16C I Tool2 1.36 110 30 1C 1 Tool 3 1.05 37 - 900 27B I Tool 3 1.87 33 0.001 0A I Tool 3 2.03 28 0.0005 0A I Tool 4 1.28 277 60 2C I Tool 4 1.78 295 0.08 0B I Tool 4 2.41 280 0.00005 0C 2 Tool1 1.39 861 18 0A 2 Tool 1 2.06 793 0.00008 0B 2 Tool 1 2.05 816 0.00006 0A 2 Tool 2 1.55 1060 2.3 0C 2 Tool2 1.53 1161 3 0B 2 Tool 2 2.00 1114 0.0009 0C 2 Tool3 1.10 667 484 24B 2 Tool 3 1.28 612 60 2A 2 Tool 3 2.08 586 0.00004 0C 2 Tool4 1.38 1447 24 1A 2 Tool 4 1.66 1324 0.5 0B 2 Tool 4 1.81 1373 0.01 0
Total Tests 13216 Total Estimated Fallout 77Resulting Fallout Rate 0.6%
Table 9 Estimated Fallout From ATP For Three Test Attributes With SpecificationRange Doubled
The above analysis shows that the expected fallout rate at ATP could be reduced by 32%
by centering the process for each attribute on each tool or it could be reduced by 74% by
expanding the specification limits. Centering a process can be a difficult and expensive
task. Expanding the limits is a relatively simple task, but one that should not be
undertaken merely to improve test yields. The limits should be based on some set of
75
customer requirements or product performance requirements, not desired test yields. But
if the specification limits were defined arbitrarily, then reviewing the justifications for the
limits is certainly warranted.
76 1