creating profitable customer experiencesmedia.corporate-ir.net/media_files/irol/97/97027/incontact...
TRANSCRIPT

2011 Annual Report
CREATING PROFITABLE CUSTOMER EXPERIENCES
Dear Fellow Shareholders, This is a very exciting time for inContact, and 2011 was a strong year for the company. We are seeing a marked shift in the size, type and number of contact centers that are choosing inContact to power their business and, during the year, we achieved a record number of 220 contracts, with 158 new customers and 62 up sells to existing accounts. We are seeing meaningful ongoing growth in our two operating segments. In Q4 2011, we had our largest organic sequential quarterly software revenue increase, with 26% growth over the same quarter in 2010. Additionally, we achieved our goal of increasing cash from the telecom segment for the year; Q4 2011 marked the sixth consecutive quarterly increase in software-related telecom revenue. In short, our growth strategies are working. We are seeing some very positive trends in the adoption of the inContact software platform. We are closing more enterprise deals than a year ago and Q4 2011 represented our best quarter of software bookings in the Company’s history. Additionally, this year we forged strategic reseller partnerships with Siemens Enterprise Communications and Verizon Business. Both these companies selected inContact as their cloud contact center partner after evaluating many other players in the market, which further illustrates our leadership role. inContact is leading the move of contact center infrastructure to the cloud. In a recently published report by industry analyst firm DMG Consulting, inContact was named the market share leader in the hosted contact center market, based on agent seats. Our market share continued to accelerate in 2011, and we anticipate ongoing growth in 2012 as we distance ourselves from the competition. In 2012, we will continue to focus on strategic initiatives designed to foster further growth and increase our position as the market leader. We will continue to maintain product and customer service leadership through ongoing enhancements to our platform, people and processes. We will continue to accelerate our sales and marketing efforts while strengthening our technology partner ecosystem. And lastly, we will continue to expand our international reach by leveraging our infrastructure and reseller partners. We are excited to be at such a pivotal point in the history of our company with a year of strong growth behind us and an accelerating cloud contact center market ahead. We have a strong domestic and international infrastructure, favorable industry analyst rankings, significant market partnerships, and a committed customer base. This uniquely positions us to be the market's most relevant player. We will take advantage of this position to accelerate our software revenue growth, and create leverage in our financial model. We believe this will deliver strong shareholder value in 2012 and into the future. Thank you for your continued support. Sincerely,
Theodore Stern Paul Jarman Chairman Chief Executive Officer
UNITED STATESSECURITIES AND EXCHANGE COMMISSION
Washington, DC 20549
FORM 10-KÈ Annual report pursuant to section 13 or 15(d) of the Securities Exchange Act of 1934
For the fiscal year ended December 31, 2011Or
‘ Transition report pursuant to section 13 or 15(d) of the Securities Exchange Act of 1934For the transition period from to
Commission File No. 1-33762
inContact, Inc.(Exact name of registrant as specified in its charter)
Delaware 87-0528557(State or other jurisdiction ofincorporation or organization)
(IRS EmployerIdentification No.)
7730 S. Union Park Avenue, Suite 500, Salt Lake City, Utah 84047(Address of principal executive offices and Zip Code)
(801) 320-3200(Registrant’s telephone number, including area code)
Securities registered under Section 12(b) of the Act: Common Stock, Par Value $0.0001Securities registered under Section 12(g) of the Act:
None
Indicate by check mark if the registrant is a well-known seasoned issuer, as defined in Rule 405 of the Securities Act. Yes ‘ No È
Indicate by check mark if the registrant is not required to file reports pursuant to Section 13 or Section 15(d) of the Act. Yes ‘ No È
Indicate by check mark whether the registrant (1) has filed all reports required to be filed by Section 13 or 15(d) of the Securities ExchangeAct of 1934 during the preceding 12 months (or for such shorter period that the registrant was required to file such reports), and (2) has beensubject to such filing requirements for the past 90 days. Yes È No ‘
Indicate by check mark whether the registrant has submitted electronically and posted on its corporate Website, if any, every interactive DataFile required to be submitted and posted pursuant to Rule 405 of Regulation S-T(§232.405 of this chapter) during the preceding 12 months (or forsuch shorter period that the registrant was required to submit and post such files). Yes È No ‘
Indicate by check mark if disclosure of delinquent filers pursuant to Item 405 of Regulation S-K is not contained herein, and will not becontained, to the best of registrant’s knowledge, in definitive proxy or information statements incorporated by reference in Part III of thisForm 10-K or any amendment to the this Form 10-K. È
Indicate by check mark whether the registrant is a large accelerated filer, an accelerated filer, a non-accelerated filer, or a smaller reportingcompany.
Large Accelerated Filer ‘ Accelerated Filer È
Non-Accelerated Filer ‘ Smaller reporting company ‘
Indicate by check mark whether the registrant is a shell company (as defined in Rule 12b-2 of the Exchange Act). Yes ‘ No È
State the aggregate market value of the voting and non-voting common equity held by non-affiliates computed by reference to the price atwhich the common equity was last sold, or the average bid and asked price of such common equity, as of the last business day of the registrant’smost recently completed second fiscal quarter: $160,479,543.
The number of shares outstanding of the registrant’s class of $0.0001 par value common stock as of February 21, 2012 was 43,695,967.
DOCUMENTS INCORPORATED BY REFERENCE: Information required by Items 10 through 14 of Part III of this Form 10-K, to theextent not set forth herein, is incorporated herein by reference to portions of the registrant’s definitive proxy statement for the registrant’s 2012Annual Meeting of Stockholders, which will be filed with the Securities and Exchange Commission not later than 120 days after the end of thefiscal year ended December 31, 2011. Except with respect to the information specifically incorporated by reference in this Form 10-K, theregistrant’s definitive proxy statement is not deemed to be filed as a part of this Form 10-K.
TABLE OF CONTENTS
Item Number and Caption Page
PART I
Item 1. Business . . . . . . . . . . . . . . . . . . . . . . . . . . . . . . . . . . . . . . . . . . . . . . . . . . . . . . . . . . . . . . . . . . . . . 2Item 1A. Risk Factors . . . . . . . . . . . . . . . . . . . . . . . . . . . . . . . . . . . . . . . . . . . . . . . . . . . . . . . . . . . . . . . . . . 13Item 1B. Unresolved Staff Comments . . . . . . . . . . . . . . . . . . . . . . . . . . . . . . . . . . . . . . . . . . . . . . . . . . . . . 19Item 2. Properties . . . . . . . . . . . . . . . . . . . . . . . . . . . . . . . . . . . . . . . . . . . . . . . . . . . . . . . . . . . . . . . . . . . . 19Item 3. Legal Proceedings . . . . . . . . . . . . . . . . . . . . . . . . . . . . . . . . . . . . . . . . . . . . . . . . . . . . . . . . . . . . . 20Item 4. Mine Safety Disclosures . . . . . . . . . . . . . . . . . . . . . . . . . . . . . . . . . . . . . . . . . . . . . . . . . . . . . . . . 20
PART II
Item 5. Market for Registrant’s Common Equity, Related Stockholder Matters and Issuer Purchases ofEquity Securities . . . . . . . . . . . . . . . . . . . . . . . . . . . . . . . . . . . . . . . . . . . . . . . . . . . . . . . . . . . . 21
Item 6. Selected Financial Data . . . . . . . . . . . . . . . . . . . . . . . . . . . . . . . . . . . . . . . . . . . . . . . . . . . . . . . . . 23Item 7. Management’s Discussion and Analysis of Financial Condition and Results of Operations . . . . 24Item 7A. Quantitative and Qualitative Disclosures About Market Risk . . . . . . . . . . . . . . . . . . . . . . . . . . . 37Item 8. Financial Statements and Supplementary Data . . . . . . . . . . . . . . . . . . . . . . . . . . . . . . . . . . . . . . . 38Item 9. Changes in and Disagreements With Accountants on Accounting and Financial Disclosure . . . 39Item 9A. Controls and Procedures . . . . . . . . . . . . . . . . . . . . . . . . . . . . . . . . . . . . . . . . . . . . . . . . . . . . . . . . 39Item 9B. Other Information . . . . . . . . . . . . . . . . . . . . . . . . . . . . . . . . . . . . . . . . . . . . . . . . . . . . . . . . . . . . . 39
PART III
Item 10. Directors, Executive Officers and Corporate Governance . . . . . . . . . . . . . . . . . . . . . . . . . . . . . . 40Item 11. Executive Compensation . . . . . . . . . . . . . . . . . . . . . . . . . . . . . . . . . . . . . . . . . . . . . . . . . . . . . . . . 40Item 12. Security Ownership of Certain Beneficial Owners and Management and Related Stockholder
Matters . . . . . . . . . . . . . . . . . . . . . . . . . . . . . . . . . . . . . . . . . . . . . . . . . . . . . . . . . . . . . . . . . . . . 40Item 13. Certain Relationships and Related Transactions, and Director Independence . . . . . . . . . . . . . . . 40Item 14. Principal Accountant Fees and Services . . . . . . . . . . . . . . . . . . . . . . . . . . . . . . . . . . . . . . . . . . . . 40
PART IV
Item 15. Exhibits and Financial Statement Schedules . . . . . . . . . . . . . . . . . . . . . . . . . . . . . . . . . . . . . . . . . 41Signatures . . . . . . . . . . . . . . . . . . . . . . . . . . . . . . . . . . . . . . . . . . . . . . . . . . . . . . . . . . . . . . . . . . . 45

FORWARD-LOOKING STATEMENTS
In addition to historical information, this annual report on Form 10-K contains forward-looking statements.Forward-looking statements include all statements that do not relate solely to historical or current facts, and cangenerally be identified by the use of words such as “may,” “believe,” “will,” “expect,” “project,” “estimate,”“intend,” “anticipate,” “plan,” “continue” or similar expressions. In particular, information appearing under“Risk Factors,” “Management’s Discussion and Analysis of Financial Condition and Results of Operations” and“Business” includes forward-looking statements. Forward-looking statements inherently involve many risks anduncertainties that could cause actual results to differ materially from those projected in these statements. Where,in any forward-looking statement, we express an expectation or belief as to future results or events, suchexpectation or belief is based on the current plans and expectations of our management and expressed in goodfaith and believed to have a reasonable basis, but there can be no assurance that the expectation or belief willresult or be achieved or accomplished. The following include some, but not all, of the factors that could causeactual results or events to differ materially from those anticipated:
• The highly competitive and evolving nature of the industry in which we compete;
• Rapid technological changes;
• Failure by us to implement our strategies;
• Our ability to keep pace with changing customer needs;
• Financial difficulties experienced by any of our top customers;
• Our debt and debt service requirements that restrict our operating and financial flexibility, and imposeinterest and financing costs;
• Our ability to attract and retain key personnel;
• General economic conditions; and
• Possible terrorist attacks and ongoing military action throughout the world.
There may be other factors that may cause our actual results to differ materially from the forward-lookingstatements. Our actual results, performance or achievements could differ materially from those expressed in, orimplied by, the forward-looking statements. We can give no assurances that any of the events anticipated by theforward-looking statements will occur or, if any of them does, what impact they will have on our results ofoperations and financial condition. You should carefully read the factors described in the “Risk Factors” sectionof this Form 10-K for a description of certain risks that could, among other things, cause our actual results todiffer from these forward-looking statements.
All forward-looking statements speak only as of the date of this Form 10-K and are expressly qualified in theirentirety by the cautionary statements included in this Form 10-K. We undertake no obligation to update or reviseforward-looking statements that may be made to reflect events or circumstances that arise after the date made orto reflect the occurrence of unanticipated events, other than as required by law.
WHERE YOU CAN FIND MORE INFORMATION
We are subject to the informational requirements of the Securities Exchange Act of 1934. Accordingly, we fileperiodic reports and other information with the Securities and Exchange Commission (“SEC”). We make ourannual report on Form 10-K, quarterly reports on Form 10-Q, current reports on Form 8-K and amendments tothose reports available through our Internet site, www.inContact.com as soon as reasonably practicable afterelectronically filing such materials with the SEC. They may also be obtained by writing to inContact, Inc., 7730S. Union Park Avenue, Suite 500, Salt Lake City, Utah 84047. In addition, copies of these reports may beobtained through the Securities and Exchange Commission website at www.sec.gov or by visiting the SEC’sPublic Reference Room at 100 F Street, NE, Washington, DC 20549 or by calling the SEC at 800-SEC-0330.Our common stock trades on The NASDAQ Capital Market under the symbol “SAAS.”
1
PART I
ITEM 1. BUSINESS
Overview
What We Do
inContact, Inc. (“inContact,” “we,” “us,” “our,” or the “Company”) began in 1997 as a reseller oftelecommunications services and has evolved to become a leading provider of cloud-based contact centersolutions. “Cloud-based” is a term used to refer to on-demand computing, data storage and delivery oftechnology services through the Internet (“Cloud”), which includes software-as-a-service (“SaaS”). inContacthelps contact centers around the world create effective customer experiences through its powerful portfolio ofcloud-based contact center call routing, self-service and agent optimization solutions. The Company’s servicesand solutions enable contact centers to operate more efficiently, optimize the cost and quality of every customerinteraction, create new pathways to profit and ensure ongoing customer-centric business improvement andgrowth.
We began offering cloud-based contact center solutions to the contact center market in 2005. Our dynamictechnology platform provides our customers a solution without the costs and complexities of premise-basedsystems. Our proven delivery model provides compelling cost savings by removing the complexities ofdeploying and maintaining a premise-based solution, while providing flexibility to change with business needs.
Developments in 2011
Our primary financial objective is to generate recurring cloud-based software revenue from sustainable sourcesby investing in various cloud-based software growth initiatives, as we believe we are in the early stages of alarge, long-term market. In the past, we have grown that business through our direct sales initiatives and referralpartner arrangements. We added a new sales channel in 2011. In June 2011, we entered into our first reselleragreement for our cloud-based contact center solutions with Siemens Enterprise Communications(“Siemens”). Siemens is a world-wide distributor/reseller of our portfolio of cloud-based software solutions,which includes the exclusive right to sell our solutions in Europe (including Russia), Middle East, and Africa(“EMEA”). In November 2011, we entered into a North America reseller agreement with Verizon BusinessCommunications (“Verizon”). Our new opportunity in 2011 is to leverage the marketing and sales capacity ofthese large enterprises selling to call center owners and operators to substantially increase our business in NorthAmerica and establish our business overseas – all of which we believe will generate significant growth in ourrecurring cloud-based software revenue.
This new opportunity means we must invest in the infrastructure required to deliver our cloud-based software tonew enterprise and international customers and increase our customer service and support capacity. We beganmaking that investment in 2011, and were able to fund our expenditures in 2011, as well as expectedexpenditures in 2012, with the $23.6 million we raised from the sale of 7.2 million shares of common stock to aparent company of Siemens. Even so, the investment we made increased our cost of services and other operatingexpenses in 2011, which adversely affected our margins and results of operations. Our ability to recoup thatinvestment depends on how successful our reseller strategy is in 2012 and beyond, but we are able to mitigate therisk associated with future realization of sales by obtaining minimum purchase commitments from Siemens togenerate $5.0 million of net software revenue in 2012 and $10.0 million in 2013.
Products and Services
The inContact Cloud Portfolio
The inContact portfolio consists of the following integrated solutions:
• inContact ACD™: The goal of an Automatic Call Distributor (“ACD”) is to get callers to the rightagent as quickly as possible. inContact provides advanced contact handling and routing functionalityalong with the management services required for our customers to monitor and manage the
2
process. The inContact ACD includes skills-based routing, universal contact queues, automatic callback, and inbound/outbound call blending. Dynamic connections with the database enhance the callrouting even further by leveraging real-time data for routing decisions to improve the callerexperience. inContact ACD is also capable of aggregating multiple contact center sites into a singleentity for improved management and reporting of large, complex contact center operations.
• inContact CTI™: Computer Telephony Integration (“CTI”) leverages the customer database to delivera caller experience based on data relevant to the caller. inContact CTI integrates with customer dataservers to provide agents with pre-populated customer data that reduce contact handling times. TheinContact CTI can also link Interactive Voice Response applications with transaction databases,enabling caller self-service and reducing the need for agents where appropriate.
• inContact IVR™: inContact Interactive Voice Response (“IVR”) is a mature IVR that delivers atypical initial caller experience. IVR is the key to good self-service and assists the caller to get to theappropriate live-agent service. inContact IVR is unique because of the robust drag-and-drop utility thatis used to create specialized call flows that are unique to each customer. Customers can retain controland develop the call flows for themselves or engage our professional services team to create a tailormade solution to create unique workflows.
• inContact Integrations: inContact was designed from the ground up to be open and integrate withvarious hardware and software solutions already in place at our customers’ sites. inContact can overlayan existing private branch exchange (“PBX”), while communicating hand-in-hand with the customerrelationship management (“CRM”) solutions used by our customers.
• inContact ECHO®: inContact ECHO gathers the opinion of the user and presents the analysis of thefeedback directly to supervisors and agents to identify gaps in service and processes. Most companiestry to gather user feedback, but many find it difficult to translate user opinion into meaningful data thatpromotes better service delivery. inContact ECHO is an essential component of the portfolio to closethe loop between offering service and evaluating the results of the service for continuous improvement.
• inContact Workforce Management™: inContact Workforce Management (“WFM”) helps ourcustomers forecast demand, workforce scheduling, analyze and optimize staffing and report real-timeadherence in their contact centers. inContact WFM includes analysis to predict service levels, abandonrates and queue times as well as a break/lunch optimization wizard to improve staffing efficiency. Inaddition, agents can review their schedule, set up schedule preferences, request time off, and swapshifts with other agents on their own.
• inContact Quality Monitoring™: inContact’s Quality Management Software provides insights intoagent performance and customer satisfaction. It works by scoring agent performance against objectivesthat a customer can define and monitor. The Quality Management scorecard then provides specificdetails about each agent’s performance that can be used to guide training and coaching programs.
• InContact Screen Recording™: inContact Screen Recording provides compliance level screenrecording functionality for all voice channel interactions. It captures and stores recordings for quickplayback to meet legal and regulatory requirements. The inContact ACD communicates directly withthe screen recording gateway server located on the customer premise to initiate the start and stop ofscreen recording activity of the agent desktop.
• inContact eLearning™: inContact eLearning provides targeted, prioritized training, communicationsand testing directly to the agent’s desktop during dips in call volumes. Our customers experiencereduced call escalations and minimized cost per call with better trained agents.
• inContact Network Connectivity: inContact runs a national carrier-class telecommunications networkproviding both TDM and VoIP connectivity as well as toll-free and local-number services. Allincoming calls are handled on the inContact network that was designed from the ground up to support abroad range of software applications. Outgoing calls are routed through a portfolio of partners speciallyselected for call-quality as well as low-cost services to benefit our customers.
3
• Professional Services: We offer professional support services from contact center experts who helpcustomers establish, set up and optimize their contact centers for user satisfaction and revenueoptimization. Our contact center experts assist customers in customizing detailed call routing and calldistribution mapping to ensure calls are routed in the most effective and efficient manner possibleusing the inContact portfolio of services to their maximum potential needed by each unique contactcenter.
The Power of the Cloud Model
The cloud model enables subscribers to access a wide variety of application services that are developedspecifically for delivery over the Internet on an as-needed basis. Purchasing cloud-based applications offersadvantages to businesses over traditional software licensing and delivery models, including the following:
• Operational expense rather than a capital expense;
• Overlay existing infrastructure without additional investment;
• Low up-front expenditure reduces risk and is especially appealing in a challenging economic climate;
• Remove complexity of day-to-day management;
• Ability to use at-home agents or multi-site workforces because the software is delivered over theInternet and can be accessed from any location;
• Continued access to state-of-the-art technology and avoidance of technology lock-in with no need toinstall and manage third-party hardware and software in-house;
• Ability to scale as business needs change; and
• Instant built-in scalability, redundancy, security, hosting and IT expertise.
This type of lower cost subscription service is particularly attractive for start-up companies and medium-sizedbusinesses. However, the model also is becoming increasingly appealing to larger organizations as they seek toreduce significant hardware and software expenses, while maintaining or improving contact center functionalityand capacity.
For companies selling software application services under the cloud-based model, such as inContact, salesgenerally result in lower initial revenues than traditional software licensing and delivery models. However,because customers generally subscribe to this kind of product for a period of time, future revenues are morepredictable than traditional software sales models where license revenue may be recognized in the quarter whensigned. As a result of our use of the cloud model, we depend on monthly recurring revenues from our customers,which provide us with a much more predictable and stable revenue stream than if we sold our inContact platformas a premise-based product.
Telecom Products and Services
Our telecommunications network is the backbone of the inContact platform as our customers’ calls are routedacross our carrier-grade network. Our ability to provide telecommunications connectivity as well as cloudsoftware services create a strong competitive advantage for those customers who are looking for a single sourcesupplier for both these services.
As a domestic and international long distance reseller and aggregator, we contract with a number of third partylong distance service providers for the right to resell telecommunication services to our customers. Our primaryproviders are Qwest, Verizon and Global Crossing. The variety of traditional telecommunication services weoffer enables our customers to: (1) buy most of the telecommunications services they need from one source,(2) combine those services into a customized package including our all-in-one, contact center solution,
4
(3) receive one bill for those services, (4) call us at a single point of contact if service problems or billing issuesarise, and (5) depend on our professional team of employees to manage their network and contact center solution,end-to-end, so our customers can focus on their business operations.
The contracts with our third party long distance service providers are standard and customary in the industry anddesignate inContact as the point of contact for all customer service calls. These agreements stand for one to threeyears and are generally renewable at the end of each contract term, when rates are often renegotiated on the basisof prevailing rates in the industry.
We also acquire, from our third party long distance service providers, dedicated long distance service, toll-free800/888/877/866 services, dedicated data transmission service and calling cards. These services and fees arebilled to us as stated in our contracts with our providers and are payable on the same terms as switched longdistance service.
We maintain a contact center in Salt Lake City, Utah for receiving customer service and billing inquiries. Ourcustomer service personnel are available during extended business hours and also provide emergency service 24hours a day, seven days a week. We place a high priority on customer service since we believe it is a primaryfactor in acquiring and retaining customers.
Market Opportunity
Many businesses need to manage a large volume of telephone traffic with users and business contacts. With thetraditional premise-based hardware and software solutions, the business: (1) purchases a system from anequipment provider, (2) installs the system on site, (3) purchases long distance service from a provider and(4) attaches one to the other. This separation between call management and call delivery has resulted in afragmented market served by multiple vendors that offer either:
• High-end, onsite, hardware and software solutions, designed to improve worker productivity, for whichthe return on investment is lengthy and often hard to justify, except for contact center operations thatare large enough to afford the significant investment needed to purchase the costly equipment, softwareand technical expertise; or
• Less expensive hardware and software solutions that are more affordable to the small and mid-sizedcontact center market, which have few features, little flexibility and limit the business’s ability toimprove worker productivity.
Our strategy is to deploy an all-in-one contact management solution that is scalable to the business’s call traffic,enables a distributed workforce, improves worker productivity, offers the features found in the high-endhardware and software solutions, and is affordable to contact centers of all sizes.
In today’s challenging economy, the preferred practice of our prospective customers is to use outsourced servicespaid for as used over standard periods, rather than incurring large upfront capital expenditures that use workingcapital that is recovered over long periods of use.
We feel that the cloud delivery model is growing in acceptance, and the market is poised for ongoing growth. Webelieve inContact continues to be the only cloud-based provider to the contact center market that offers bothtelecommunications services with contact handling and workforce optimization solutions. We believe the trend inthe mid-size and enterprise contact center market is for companies to prefer purchasing all-in-one solutions overpurchasing multiple point solutions. These companies are looking for software available in a portfolio that theybelieve will save money, reduce implementation and integration complexity, and allow them to focus on dealingwith one vendor.
5
Sales and Marketing
Marketing continues to be a strategic growth engine for inContact. In 2011, we continued our targeted marketingactivities to accelerate sales growth. We are driving demand for our services through the following keystrategies:
• Build a strong consistent, recognizable brand across the contact center industry and consistentlypromote and communicate our value proposition;
• Develop customer references to support the story;
• Expand our PR presence and extend our relationships with key industry analysts;
• Leverage social media;
• Increase scale and impact of demand generation programs; and
• Nurture leads for more effective conversion to qualified opportunities.
The key audiences for our message include contact center operations management, IT management and C-levelexecutives. Our current marketing efforts are focused on: (1) elevating the inContact brand to a position ofindustry leadership in cloud-based platforms, (2) identifying, attracting and pre-qualifying prospective leads thatcan be converted to new sales opportunities, and (3) expanding partner support and integration offerings toenable joint marketing and selling with key partners.
We maintain a referral partner network comprised primarily of telecommunication agents and adjacent markettechnology and service providers. These relationships benefit inContact because they introduce us to new saleschannels and they add scalability to our sales, implementation, professional services and support operations.
In 2011 and prior years, inContact’s cloud-based software solutions have been sold predominately through ourdirect sales organization. In June 2011, we established a new sales channel by entering into a reseller agreementwith Siemens, whereby Siemens became a world-wide distributor/reseller of our portfolio of hosted solutions.Siemens was granted a non-exclusive right to resell inContact’s cloud-based software solutions and otherservices globally with an exclusive right to sell the inContact services in EMEA. The initial term of theagreement is between June 14, 2011 and December 31, 2013. Siemens agreed to the following minimumpurchase commitments during the term of the Agreement:
$5.0 million in net software revenue for calendar year 2012 with quarterly milestones of 15% for Quarter 1,20% for Quarter 2, 25% for Quarter 3 and 40% for Quarter 4; and
$10.0 million in net software revenue for calendar year 2013 with quarterly milestones of 15% for Quarter1, 20% for Quarter 2, 25% for Quarter 3 and 40% for Quarter 4.
If Siemens produces $4.0 million in net software revenue for the fourth quarter of 2013, the agreement can beextended at Siemens’ option for calendar year 2014 with a minimum purchase commitment of $4.0 million perquarter for a total commitment of $16.0 million for 2014.
Siemens has the right to brand or co-brand the portfolio of cloud-based software solutions with Siemens’ tradename or service mark. The relationship will begin with a co-branding solution and we agreed to pursue a fullbranding solution per a mutually agreeable timeline. inContact agreed to provide sales and marketing material,fund and manage the platform for the portfolio of software solutions in Europe, manage all operational functionsof delivering the software solutions, and to support Siemens’ customer and internal support training programs.We believe this reseller agreement will provide additional opportunities, especially in EMEA, for inContact byleveraging Siemens’ sales force to sell our portfolio of hosted solutions.
6
In October 2011, we entered into another reseller agreement with Verizon. The Verizon reseller agreement hasno minimum purchase commitments, but we believe it will allow us to increase market share in North Americaby leveraging their sales and distribution force to sell our portfolio of cloud-based software solutions.
International
In 2011, we completed the build out of our European network facilities. The European network is identical to ournetwork in the United States and features redundant data centers in Munich and Frankfurt. The new Europeannetwork facilities will enable inContact to provide multi-national customers with regional access to cloud-basedcontact center software applications to better serve local needs. These capabilities include regionally-stored callsand contacts, broader language support for speech applications and data handling to comply with European datasecurity regulations.
The Frankfurt and Munich network facilities further enable multi-national customers to take advantage of a true“Follow the Sun” model, where the appropriate contacts are delivered to properly skilled and available agentsregardless of geography or time zone. It offers a universal queue, combined with an intelligent contactdistribution platform with global reach, to ensure that the contact is always handled by the right agent, providinga consistent customer experience.
Additionally, we expanded our patent-pending voice gateway technology to Europe, the Philippines and HongKong. The voice gateway technology facilitates high quality interactions by routing both incoming and outgoingcontact center calls through the inContact system within the continent. It eliminates static and voice delayproblems frequently experienced by other providers who do not have infrastructure in the region and improvesservice to existing customers.
We also continued to prudently expand our operations in the Philippines, which provides us with a low costapproach to service mid-market customers.
Technology and Research and Development
Technology
We believe that our cloud-based technology platform enables us to develop functionality and deliver it tocustomers more efficiently than traditional premise or enterprise software vendors. We do not provide softwarethat must be written to different operating systems, database and hardware platforms, or that is dependent upon acustomer’s unique systems environment. Rather, we have optimized our inContact portfolio of cloud-basedsoftware solutions to run on a specific database and operating system using the tools and platforms best suited toserve our customers. Performance, usability and functionality of our inContact portfolio drive our technologydecisions and product direction.
We build our inContact portfolio as a highly scalable, multi-tenant application written in C#, Microsoft. Net andSQL server. We use commercially available hardware and a combination of proprietary and commerciallyavailable software to provide our inContact portfolio. Our core ACD server is commercially available hardwareand runs a proprietary software engine. We have other custom-built core services such as voice-stream sessionmanagement, database connection pooling and user session management tuned to our specific architecture andenvironment, allowing us to continue to scale our inContact portfolio.
Our inContact portfolio treats all customers as logically separate tenants in central applications and databases. Asa result, we are able to spread the cost of delivering our software services across our customer base. In addition,because we do not have to manage many distinct applications with their own custom business logic and databaseschemas, we believe we can scale our business faster than traditional software vendors, even those that havemodified their products to be accessible over the Internet. This allows us to focus the majority of our resourceson building new functionality to deliver to our entire customer base rather than on maintaining an infrastructureto support each of their distinct applications.
7

The infrastructure of our inContact portfolio and VoIP technologies has both system redundancy within theapplications as well as geographical redundancy with data centers in Los Angeles, California, Dallas, Texas andMunich and Frankfurt, Germany. Full backups of all our core customer data are performed weekly anddifferential backups are performed nightly. Transaction log backups take place every 30 minutes. We use securesockets layer (“SSL”) encryption to protect sensitive areas of our customer information and service-orientedwebsites. Remote access to our systems is made possible through a 168-bit encrypted Virtual Private Network.System passwords are changed on a periodic basis and stored in a secure folder with restricted access. All localcomputers are scanned for viruses on a real-time basis and report to a central server. We believe our backup,maintenance and security systems are adequate for preserving the delivery of service to our customers andoperation of our business without significant outages or interruptions. However, an unforeseen or catastrophicevent is always possible and could have a significant impact on our business.
Research and Development
We incurred research and development expenses of $6.4 million in 2011, $5.3 million in 2010 and $4.8 millionin 2009 primarily related to the development of our inContact portfolio of cloud-based software solutions. Wecontinue to invest a significant portion of our revenue in research and development to leverage our strategicposition as a technology provider. Our research and development efforts are focused on improving the features,functionality and security of our existing service offerings as well as developing new proprietary services. Inaddition, from time to time, we supplement our internal research and development activities with outsidedevelopment resources and acquired technology. Because of our common, multi-tenant application architecture,we are able to provide all of our customers with a service based upon a single version of our applications. We areable to upgrade all of our customers at the same time with each release. As a result, we do not have to maintainmultiple versions of our applications and are able to maintain relatively low research and development expensesas compared to enterprise or premises software vendors. Another contributor to our advantage is the diversetechnical and communications expertise in our research and development group as it is composed of numerousprofessionals with backgrounds in software, hardware and telecommunications. This group is structured asproduct-centric teams each of which follows formal development processes for enhancements, new featuredevelopments, release management and quality assurance.
Intellectual Property
We rely on a combination of trademark, copyright, trade secret and patent laws in the United States and otherjurisdictions as well as confidentiality procedures and contractual provisions to protect our proprietarytechnology and our brand. We also enter into confidentiality and proprietary rights agreements with ouremployees, consultants and other third parties and control access to software, documentation and otherproprietary information.
We have no issued patents and the majority of our patent applications concern our inContact portfolio platforminfrastructure. The following are our registered trademarks in the U.S. and elsewhere:
• inContact®
• inTouch®
• ECHO®
• inCloud
• Satisfaction as a Service
We have received in the past, and may receive in the future, communications from third parties claiming that wehave infringed on the intellectual property rights of others. The cost to defend or settle these claims can besignificant. Any intellectual property claims, regardless of merit, may also require us to seek licenses to that
8
technology. At present, we are not aware of any claims being pursued against us. In addition, we license third-party technologies that are incorporated into some elements of our services. Licenses from third-partytechnologies may not continue to be available to us at a reasonable cost or on reasonable commercial terms, or atall. Additionally, the steps we have taken to protect our intellectual property rights may not be adequate. Thirdparties may infringe or misappropriate our proprietary rights. Competitors may also independently developtechnologies that are substantially equivalent or superior to the technologies we employ in our services. If we failto protect our proprietary rights adequately, our competitors could offer similar services, potentially significantlyharming our competitive position and decreasing our revenues.
Competition
The majority of market share in the contact center infrastructure market and in the workforce optimizationsoftware market is still held by traditional premise-based equipment providers. The premise-based method ofselling solutions, via onsite equipment and software, is now being challenged by cloud-based providers.However, market share among the group of cloud-based providers is fragmented and remains small.
We believe that today there is no clear cloud-based contact center market leader. However, according to theDMG Hosted Contact Center Infrastructure Market Report, inContact is the market share leader, based on agentseats1. Because of our diligent efforts over the past several years and our experience with more than 1,000implementations, we believe we are in a position to capitalize on the market fragmentation and become the clearleader in the cloud-based market for contact center software.
Government Regulation
General
The Telecommunications Act of 1996 vests the Federal Communications Commission (“FCC”) with jurisdictionover interstate telecommunications services, while preserving state and local jurisdiction over many aspects ofthese services. As a result, telecommunications services are regulated at both the federal and state levels in theUnited States. In addition, a specific form of Internet-based telephony that interconnects with the PublicSwitched Telephone Network (“PSTN”) called “interconnected Voice over Internet Protocol” (“I-VoIP”) serviceis also subject to certain analogous regulations at the federal and, increasingly, state level. More recently,pursuant to statutory requirement, the FCC promulgated regulations extending narrow duties tonon-interconnected VoIP service. We believe we are in compliance with the laws and regulations applicable toour business.
The FCC regulates providers of interstate and international long distance services, interstate access, I-VoIP andnon-I-VoIP services. Most states exercise jurisdiction over intrastate long distance services and local exchangeservices. A small, but growing number of states also exercise jurisdiction over I-VoIP services for narrowpurposes, such as ensuring collection of state universal service contributions. Significant changes to applicablelaws or regulations imposed by the FCC or state regulatory agencies could negatively impact our business,operating results and financial condition.
The following summarizes important, but not all, present and proposed federal and state regulations that couldimpact our operations. Federal and state regulations are subject to judicial proceedings and to legislative andadministrative proposals that could materially affect how we and others in this industry operate. The specificimpact, however, cannot be predicted at this time.
Federal Regulation of Internet Telephony and other IP-Enabled Voice Services
VoIP telephony and other forms of IP-enabled communications are increasingly becoming subject to regulation.As a result, certain cost benefits of IP-based services, which we currently take advantage of, may erode.
1 2011/2012 Hosted Contact Center Infrastructure Market Report, DMG Consulting LLC, December 2011.
9
The FCC has not classified all IP-enabled or VoIP communications services as unregulated information servicesor as regulated telecommunications services. Instead, the FCC has imposed certain legacy telecommunicationsregulations on I-VoIP services in a piecemeal, ad hoc manner. These regulations include requirementsconcerning emergency communications (“E911”), telecommunications relay services for hearing-impairedindividuals (“TRS”), Customer Propriety Network Information (“CPNI”), and the facilitation of wiretaps andgovernment surveillance under the Communications Assistance for Law Enforcement Act (“CALEA”). Inaddition, the FCC ruled that I-VoIP providers must contribute to the Federal Universal Service Fund (“USF”)regime.
In October 2010, legislation was signed into law that for the first time subjects providers of non-interconnectedVoIP services to government regulation. Specifically, the Twenty-First Century Communications and VideoAccessibility Act of 2010 (“CVAA”) required the FCC to adopt various measures to ensure that people withdisabilities have access to emerging communications technologies, and to promulgate rules requiringnon-interconnected VoIP providers to contribute to the TRS Fund. To implement the CVAA, the FCC adoptedrules requiring non-interconnected VoIP service providers to contribute to the TRS Fund on the basis of theirinterstate end-user revenues. The contribution obligation is limited, and the rules do not affirmatively impose anyother regulatory responsibilities on non-interconnected VoIP providers. Because the new rules are narrow andfocused, we expect that they will have a minimal cost impact on the Company. But, the CVAA also signals atrend toward expansion of FCC regulations to a broader variety of enhanced communications services.
In addition, the regulatory treatment of IP-based conferencing services is currently under review. In a 2011decision, the FCC’s Wireline Competition Bureau (“WCB”) denied MeetingOne.com’s request for review of adecision of USF administrator, the Universal Service Administrative Company (“USAC”) concluding thatMeetingOne.com’s IP conferencing service is regulated telecommunications; MeetingOne appealed the decision.While the outcome of this appeal remains to be seen, it could have an impact on the regulatory treatment of IPconferencing services, and how our business treats these services.
Based on the nature of our IP-enabled services, we do not believe the FCC decisions to date will have asignificant impact on our business, operating results, financial condition or future prospects. Nonetheless, weacknowledge that the regulatory classification of many IP-enabled services remains uncertain, and changes to theregulatory treatment of IP-based communications services could significantly affect our business.
Federal Regulation of Broadband Internet Access Services
In the past, the FCC has maintained a “hands-off” policy with regard to the regulation of Internet access servicesand adopted a series of decisions that classified broadband Internet access services as unregulated informationservices. Recently, however, the FCC has relied on its ancillary jurisdiction to regulate broadband Internet accessservices. In 2010, the FCC adopted the “Open Internet” or “Network Neutrality” rules, which require providersof fixed broadband Internet access services to disclose information regarding their network managementpractices, performance, and commercial terms. Further, the rules prohibit fixed broadband providers fromunreasonably discriminating in their transmission of lawful network traffic and from blocking lawful content,applications, services or non-harmful devices unless such blocking is a part of a provider’s reasonable networkmanagement. The Open Internet rules are currently under appeal. We rely on third parties to provide or supplyInternet access services and do not operate a broadband network. At this time, we do not believe the OpenInternet rules will impact us.
Intercarrier Compensation and Universal Service Reform
As a long distance provider, we remit access fees directly to local exchange carriers or indirectly to ourunderlying long distance carriers for the origination and termination of our long distance telecommunicationstraffic pursuant to the FCC’s “intercarrier compensation” rules. In 2011, the FCC adopted reforms to the existingintercarrier compensation regime. The new rules subject VoIP traffic to the FCC’s intercarrier compensation
10
rules. The FCC set the default charge for toll traffic exchanged between a VoIP provider and a local carrier at theinterstate access rate. The charge for local traffic exchanged will be the reciprocal compensation rate. We are inthe process of undertaking an internal review and implementing measures to comply with the new intercarriercompensation rules. We cannot predict exactly how the new regime will impact our business but expect that itwill affect the cost of services provided to our customers, particularly long distance services.
In addition to undertaking intercarrier compensation reform, the FCC is considering comprehensive reforms to itsUSF regime. The FCC is seeking comment on proposals to expand the scope of USF contributors. For example,the FCC is considering requiring broadband Internet access providers to contribute to the USF. While USFcontribution reform is anticipated, no timetable for implementation has been set.
As a regulated service provider, we contribute to the USF. We believe that we are currently in compliance withthe FCC’s USF rules. We expect that reform may include an expansion of the range of contributors to include abroader scope of enhanced communications services. While any material changes to the USF contribution systemcould impact the company’s business, because the Company passes through USF fees on an equitable andnon-discriminatory basis to end users, either as a component part of the rate charged for telecommunicationsservices or as a separately invoiced line item, we do not anticipate any material financial impact.
In addition, some states are expanding the base of service providers required to contribute to state universalservice funds. Such expansions could impact our business, but we do not expect a material effect on theCompany.
Data Protection Regulations
Each company that collects, processes, shares, stores, or disposes of personal data must protect this data with theappropriate security measures. Numerous federal, state and international laws, regulations, and industry standardscreate requirements and restrictions that affect our corporate or commercial transactions, marketing and businessdevelopment activities, and interaction with our workforce. We have procedures in place to ensure that weproperly comply with all data protection and privacy regulations. To the extent that new regulations are adoptedthat significantly impact our business, our costs of providing service could increase.
Other General Regulations
The regulatory scheme for competitive telecommunications market will continue to evolve and can be expectedto change the competitive environment for communications in general. It is not possible to predict how suchevolution and changes will affect, if at all, our business or the industry in general.
Employees
As of December 31, 2011, we employed a total of 412 employees. Our employees are not represented by a laborunion. We have not experienced any work stoppages and believe relations with our employees are good.
Executive Officers of inContact
The executive officers of inContact are elected each year at the organizational meeting of the Board of Directors,which follows the annual meeting of the shareholders, and at other Board of Directors’ meetings, as appropriate.We have employed each of the executive officers in the position or positions indicated in the list and pertinentnotes below.
11
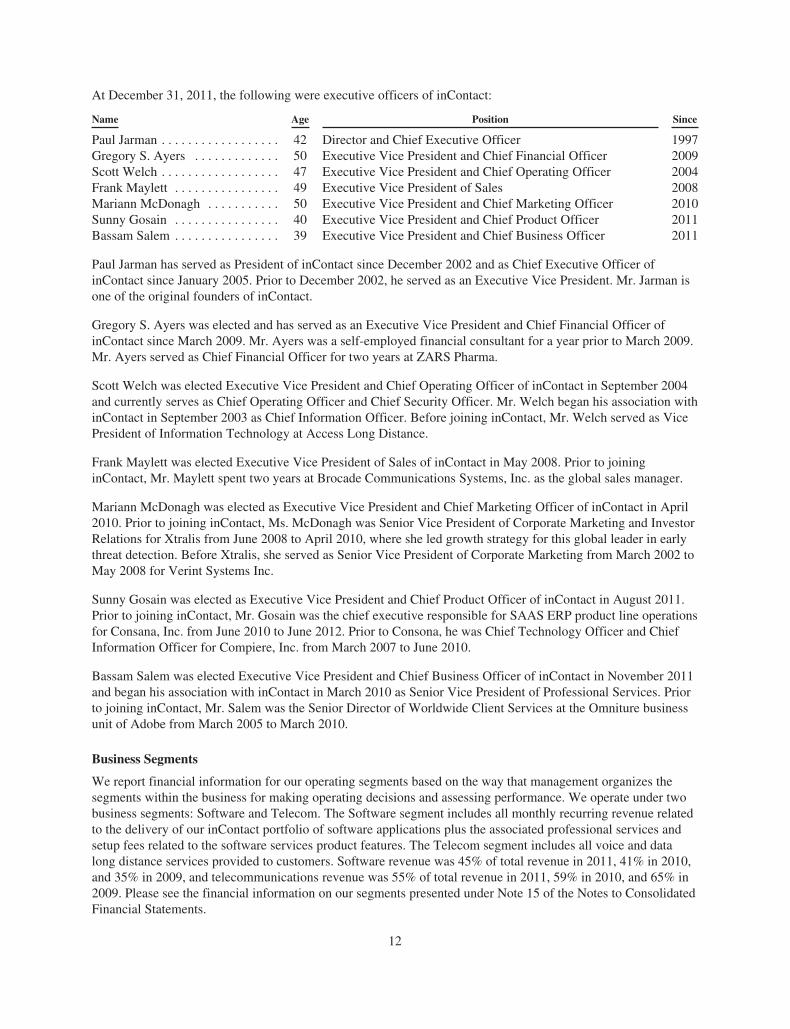
At December 31, 2011, the following were executive officers of inContact:
Name Age Position Since
Paul Jarman . . . . . . . . . . . . . . . . . . 42 Director and Chief Executive Officer 1997Gregory S. Ayers . . . . . . . . . . . . . 50 Executive Vice President and Chief Financial Officer 2009Scott Welch . . . . . . . . . . . . . . . . . . 47 Executive Vice President and Chief Operating Officer 2004Frank Maylett . . . . . . . . . . . . . . . . 49 Executive Vice President of Sales 2008Mariann McDonagh . . . . . . . . . . . 50 Executive Vice President and Chief Marketing Officer 2010Sunny Gosain . . . . . . . . . . . . . . . . 40 Executive Vice President and Chief Product Officer 2011Bassam Salem . . . . . . . . . . . . . . . . 39 Executive Vice President and Chief Business Officer 2011
Paul Jarman has served as President of inContact since December 2002 and as Chief Executive Officer ofinContact since January 2005. Prior to December 2002, he served as an Executive Vice President. Mr. Jarman isone of the original founders of inContact.
Gregory S. Ayers was elected and has served as an Executive Vice President and Chief Financial Officer ofinContact since March 2009. Mr. Ayers was a self-employed financial consultant for a year prior to March 2009.Mr. Ayers served as Chief Financial Officer for two years at ZARS Pharma.
Scott Welch was elected Executive Vice President and Chief Operating Officer of inContact in September 2004and currently serves as Chief Operating Officer and Chief Security Officer. Mr. Welch began his association withinContact in September 2003 as Chief Information Officer. Before joining inContact, Mr. Welch served as VicePresident of Information Technology at Access Long Distance.
Frank Maylett was elected Executive Vice President of Sales of inContact in May 2008. Prior to joininginContact, Mr. Maylett spent two years at Brocade Communications Systems, Inc. as the global sales manager.
Mariann McDonagh was elected as Executive Vice President and Chief Marketing Officer of inContact in April2010. Prior to joining inContact, Ms. McDonagh was Senior Vice President of Corporate Marketing and InvestorRelations for Xtralis from June 2008 to April 2010, where she led growth strategy for this global leader in earlythreat detection. Before Xtralis, she served as Senior Vice President of Corporate Marketing from March 2002 toMay 2008 for Verint Systems Inc.
Sunny Gosain was elected as Executive Vice President and Chief Product Officer of inContact in August 2011.Prior to joining inContact, Mr. Gosain was the chief executive responsible for SAAS ERP product line operationsfor Consana, Inc. from June 2010 to June 2012. Prior to Consona, he was Chief Technology Officer and ChiefInformation Officer for Compiere, Inc. from March 2007 to June 2010.
Bassam Salem was elected Executive Vice President and Chief Business Officer of inContact in November 2011and began his association with inContact in March 2010 as Senior Vice President of Professional Services. Priorto joining inContact, Mr. Salem was the Senior Director of Worldwide Client Services at the Omniture businessunit of Adobe from March 2005 to March 2010.
Business Segments
We report financial information for our operating segments based on the way that management organizes thesegments within the business for making operating decisions and assessing performance. We operate under twobusiness segments: Software and Telecom. The Software segment includes all monthly recurring revenue relatedto the delivery of our inContact portfolio of software applications plus the associated professional services andsetup fees related to the software services product features. The Telecom segment includes all voice and datalong distance services provided to customers. Software revenue was 45% of total revenue in 2011, 41% in 2010,and 35% in 2009, and telecommunications revenue was 55% of total revenue in 2011, 59% in 2010, and 65% in2009. Please see the financial information on our segments presented under Note 15 of the Notes to ConsolidatedFinancial Statements.
12
Management evaluates segment performance based on operating data (revenue, costs of revenue and otheroperating expenses). Management does not evaluate and manage segment performance based on assets.
For segment reporting, we classify operating expenses as either “direct” or “indirect.” Direct expense refers tocosts attributable solely to either selling and marketing efforts or research and development efforts. Indirectexpense refers to costs that management considers to be overhead in running the business. In evaluating segmentperformance, management evaluates expenditures for both selling and marketing and research and developmentefforts at the segment level without the allocation of overhead expenses, such as rent, utilities and depreciationon property and equipment.
ITEM 1A. RISK FACTORS
The following is a discussion of risks we believe to be significant with respect to our business, operations,financial condition, and other matters pertaining to our business and an investment in our common stock. Beforedeciding to purchase, hold or sell our common stock, you should carefully consider the risks described below, inaddition to the other cautionary statements and risks described elsewhere as well as the other informationcontained in this report and in our other filings with the SEC, including our reports on Forms 10-Q and 8-K. Therisks and uncertainties described below are not the only ones we face. If any of these known or unknown risks oruncertainties actually occurs with material adverse effects, our business, financial condition and results ofoperations could be seriously harmed. In that event, the market price for our common stock could decline andyou may lose all or part of your investment.
Our results of operations have shown significant losses over the past several years, which could impact theresources we have to pursue our business and adversely affect an investment in inContact.
Our net loss was $9.4 million, $1.1 million and $2.9 million for the years ended December 31, 2011, 2010 and2009, respectively. Continued losses will diminish the working capital we have available to pursue developmentof our business. Sales within the Software segment continue to improve, but we have not achieved positiveannual operating results and whether inContact will ultimately achieve positive results and cash flow should beconsidered a substantial risk with respect to our business.
The stability and growth of our revenues depends on our ability to attract and retain on-going customers.
The revenue model for companies selling software services under the cloud-based model, such as inContact, is toattract and retain customers who purchase services under contracts providing for monthly or periodic charges.Our ability to increase and maintain revenue depends substantially on the efficacy of our contact center and callrouting solutions and maintaining customer satisfaction. Our failure to deliver services our customers need andwant, and to keep our customers satisfied, would adversely affect our results or operations.
Incremental revenue from reseller partners and international sales may not exceed expenditures, which couldadversely impact our results of operations.
In 2011, we expended a significant amount of money to develop our infrastructure and international deliverysystems to be able to serve new customers we believe will come from the reseller sales channel established in2011 and to support reseller partners. We expect to make additional expenditures for this purpose in 2012. Futurerevenue from our reseller arrangements may not be sufficient to cover our investment in infrastructure andfacilities or our continuing cost of operating the expanded service capacity, which would have a significantadverse effect on our results of operations.
13
Failure to effectively develop and expand our sales and marketing capabilities could harm our ability toincrease our customer base and achieve broader market acceptance of our solutions.
Increasing our customer base and achieving broader market acceptance of our solutions will depend to asignificant extent on our ability to expand our sales and marketing operations. We plan to continue to expand ourdirect sales force and engage additional third-party channel partners. This expansion will require us to investsignificant financial and other resources. Our business will be seriously harmed if our efforts do not generate acorresponding increase in revenue. We may not achieve anticipated revenue growth from expanding our directsales force if we are unable to hire and develop talented direct sales personnel, if our new direct sales personnelare unable to achieve desired productivity levels in a reasonable period of time, or if we are unable to retain ourexisting direct sales personnel. We also may not achieve anticipated revenue growth from our third-party channelpartners if we are unable to attract and retain additional motivated channel partners, if any existing or futurechannel partners fail to successfully market, resell, implement or support our solutions for their users, or if theyrepresent multiple providers and devote greater resources to market, resell, implement and support competingproducts and services.
We have a lengthy product sales cycle, which has contributed and may continue to contribute to the variabilityof quarterly operating results
We have experienced a lengthy initial sales and eventual “turn-up” cycle for our inContact portfolio in ourSoftware segment, averaging approximately five to eight months. The lengthy sales cycle is one of the factorsthat has caused and may continue to cause our revenues and operating results to vary significantly from quarter toquarter. As our inContact portfolio is relatively new in the marketplace, we must provide a significant amount ofeducation to prospective customers about the use and benefits of our products and services, which can causepotential customers to take many months to make these decisions. The length of the sales cycle can also beaffected by other factors over which we have little or no control, including customer budgetary constraints,timing of customer budget cycles, and concerns by the customer about the introduction of new products by us orby our competitors. As a result, sales cycles for customer orders vary substantially from customer to customer.Excessive delay in sales could be significant and adversely affect our business, financial condition or results ofoperations.
Our quarterly results of operations may fluctuate in the future.
Our quarterly revenue and results of operations may fluctuate as a result of a variety of factors, many of whichare outside of our control. If our quarterly revenue or results of operations fall below the expectations ofinvestors or securities analysts, the price of our common stock could decline substantially. Fluctuations in ourresults of operations may be due to a number of factors, including, but not limited to, those listed below andidentified throughout this “Risk Factors” section:
• Our ability to retain and increase sales to existing customers, attract new customers and satisfy ourcustomers’ requirements;
• Changes in the mix of revenue between our segments because the overall operating margin issignificantly higher for the Software segment than for the Telecom segment;
• The timing and success of new product introductions and enhancements or product initiation by us orour competitors;
• Changes in our pricing policies or those of our competitors;
• The amount and timing of expenditures related to expanding our operations;
• The purchasing and budgeting cycles of our customers; and
• General economic, industry and market conditions.
14

Because the sales cycle for the evaluation and implementation of our solutions is variable based on the specificcustomer needs, we may experience a delay between increasing operating expenses and the generation ofcorresponding revenue, if any. As a result, if revenue for a particular quarter is below our budgeted expectations,we may not be able to proportionally reduce operating expenses for that quarter, causing a disproportionate effecton our expected results of operations for that quarter.
Due to the foregoing factors, and the other risks discussed in this report, you should not rely on quarter-to-quartercomparisons of our results of operations as an indication of our future performance.
Our growth and results of operations are unknown, which means an investment in us has greater risk.
It is not possible to predict with any certainty the growth of our business over the next year. Our ability tocontinue our growth and improve our results of operations will depend on a number of factors, including ourability to promote and gain market acceptance of cloud-based software solutions, to maintain and expand ourindependent agent network, to fund maintenance and expansion of infrastructure to service our customers, tomeet existing and emerging competition, and to maintain sufficient operating margins despite pricing pressures.Furthermore, the growth and development of our business may be harmed if we are unable to adapt and expandour systems, procedures and controls to support and manage our growth. All of these factors indicate there couldbe fluctuations in our results of operations and volatility in our stock price that could expose an investor togreater risk.
Our operating results may be negatively impacted by the pricing decisions of our competitors and ourproviders. We may not be able to mitigate this impact with our other services.
Our costs of revenues in our Telecom segment from period to period are affected by the pricing for long distanceservice we can obtain from the wholesale providers of these services. We must price our services at levels thatare competitive, so costs of revenues affect the rates we offer to customers and our resulting revenues. Thisindustry has a history of downward pressure on long distance service rates as a result of competition amongproviders. To acquire and retain customers, we offer these services at prices that are competitive in conjunctionwith the other benefits we provide. Consequently, falling prices will likely result in lowering our rates to users,which will reduce revenues. On the other hand, higher prices charged by our providers will increase our costs ofrevenues and cut into operating results, unless we raise prices to our customers, which may be difficult for us todo if our competitors are not subject to the same upward pricing pressures or choose not to increase pricesnotwithstanding such pressure. Our strategy is to mitigate the impact of pricing pressure in the Telecom segmentby increasing Software segment revenue, which is not subject to these rate changes and has much higher margins.Sales of cloud-based software services still make up a smaller portion of our revenues. We may not be successfulin making these cloud-based services a majority of our revenue mix and improve our overall operating margins.
Disruptions in the operation of our technology could adversely affect our operations.
We are dependent on our computer databases, billing and accounting computer programs, network and computerhardware that houses these systems to effectively operate our business and market our services. Our customersand providers may become dissatisfied by any system failures that interrupt our ability to provide our service tothem. Substantial or repeated system failures would significantly reduce the attractiveness of our services.Significant disruption in the operation of these systems would adversely affect our business and results ofoperations.
Our enhanced services are dependent on leased telecommunications lines, and a significant disruption orchange in these services could adversely affect our business.
Our inContact portfolio of cloud-based software services are provided to customers through a dedicated networkof equipment we own connected through leased telecommunications lines with capacity dedicated to us that is
15
based on Internet protocol. Communication initiated by the user is converted to data packs that are transmittedthrough the dedicated network and managed by our software that resides on our equipment attached to thenetwork. We also move a portion of our voice long distance service over this dedicated network because it lowersour cost of providing the service from using traditional transmission methods.
We lease telecommunication lines and space at co-location facilities for our equipment from third-partysuppliers, which represents the backbone of our dedicated network. If any of these suppliers is unable orunwilling to provide or expand their current levels of service to us, the services we offer to customers would beadversely affected. We may not be able to obtain substitute services from other providers at reasonable orcomparable prices or in a timely fashion. Any resulting disruptions in the services we offer that are provided overour dedicated network would likely result in customer dissatisfaction and adversely affect our operations.Furthermore, pricing increases by any of the suppliers we rely on for the dedicated network could adverselyaffect our results of operations if we are unable to pass pricing increases through to our customers.
If there are interruptions or delays in our services through third-party error, our own error or the occurrenceof unforeseeable events, delivery of our solutions could become impaired, which could harm our relationshipswith customers and subject us to liability.
We provide our services through computer hardware that we own and that is currently located in third-party webhosting co-location facilities maintained and operated in California, Texas, Utah, Germany, Hong Kong and thePhilippines. Our hosting providers do not guarantee that our customers’ access to hosted solutions will beuninterrupted, error-free or secure. Our operations depend on our providers’ ability to protect their and oursystems in their facilities against damage or interruption from natural disasters, power or telecommunicationsfailures, criminal acts and similar events. Our back-up computer hardware and systems have not been testedunder actual disaster conditions and may not have sufficient capacity to recover all data and services in the eventof an outage occurring simultaneously at all facilities. In the event that our hosting facility arrangements wereterminated, or there was a lapse of service or accidental or willful damage to such facilities, we could experiencelengthy interruptions in our service as well as delays and/or additional expense in arranging new facilities andservices. Any or all of these events could cause our customers to lose access to the services they are purchasingfrom us. In addition, the failure by our third-party hosting facilities to meet our capacity requirements couldresult in interruptions in our service or impede our ability to scale our operations.
Design and mechanical errors, spikes in usage volume and failure to follow system protocols and procedurescould cause our systems to fail, resulting in interruptions in our customers’ service to their customers. Anyinterruptions or delays in our services, whether as a result of third-party error, our own error, natural disasters orsecurity breaches, whether accidental or willful, could harm our relationships with customers and our reputation.This in turn could reduce our revenue, subject us to liability, and cause us to issue credits or pay penalties orcause customers to fail to continue service, any of which could adversely affect our business, financial conditionand results of operations. In the event of damage or interruption, our insurance policies may not adequatelycompensate us for any losses that we may incur.
If the security of our customers’ confidential information contained in our systems or stored by use of oursoftware is breached or otherwise subjected to unauthorized access, our service or our software may beperceived as not being secure and customers may curtail or stop using our service and our solutions.
Our systems and software store and transmit proprietary information and critical data belonging to our customersand their users. Any accidental or willful security breaches or other unauthorized access could expose us to a riskof information loss, litigation and other possible liabilities. If security measures are breached because of third-party action, employee error, malfeasance or otherwise, or if design flaws in our software are exposed andexploited, and, as a result, a third party obtains unauthorized access to any of our clients’ data, our relationshipswith customers and our reputation will be damaged, our business may suffer and we could incur significantliability. Because techniques used to obtain unauthorized access or to sabotage systems change frequently and
16
generally are not recognized until launched against a target, we and our third-party hosting co-location facilitiesmay be unable to anticipate these techniques or to implement adequate preventative measures.
If outside unfriendly parties succeed in penetrating our network security or otherwise misappropriate ourcustomer information, we could be subject to liability. Our liability could include claims for unauthorizedpurchases with credit card or banking information, impersonation or other similar fraud claims, as well as forother misuses of personal information, including for unauthorized marketing purposes. These claims could resultin litigation and adverse publicity, which could have an adverse effect on our reputation, business and results ofoperations. As we continue to gain higher profile customers, the risk that unfriendly parties will attempt andsucceed in penetrating our network security also increases.
We may not be able to secure additional financing on favorable terms, or at all, to meet our long-term capitalneeds.
We may determine that additional capital will be necessary in responding to business challenges, including theneed to develop new solutions or enhance our existing solutions, enhance our operating infrastructure, fundexpansion, respond to competitive pressures, acquire complementary businesses, products and technologies, orfor other reasons. We may not be able to secure additional debt or equity financing on favorable terms, or at all,at the time when we need such funding to pursue our business objectives. If we raise additional funds throughfurther issuances of equity or convertible debt securities, our existing stockholders could suffer significantdilution in their percentage ownership of the Company, and any new equity securities we issue could have rights,preferences and privileges senior to those of holders of our common stock. Any debt financing secured by us inthe future could involve restrictive covenants relating to our capital raising activities and other financial andoperational matters, which may make it more difficult for us to obtain additional capital and to pursue businessopportunities, including potential acquisitions. In addition, if we decide to raise funds through debt or convertibledebt financings, we may be unable to meet our interest or principal payments.
If we are unable to protect our intellectual property rights, our competitive position could be harmed or wecould be required to incur significant expenses to enforce our rights.
Our success depends to a significant degree upon the protection of our software and other proprietary technologyrights. We rely on trade secret, copyright, patent, and trademark laws and confidentiality agreements withemployees and third parties, all of which offer only limited protection. The steps we have taken to protect ourintellectual property may not prevent misappropriation of our proprietary rights or the reverse engineering of oursolutions. We may not be able to obtain any further trademarks, and our pending applications may not result inthe issuance of patents or trademarks. Furthermore, legal standards relating to the validity, enforceability andscope of protection of intellectual property rights in other countries are uncertain and may afford little or noeffective protection of our proprietary technology. Consequently, we may be unable to prevent our proprietarytechnology from being exploited abroad, which could affect our ability to expand to international markets orrequire costly efforts to protect our technology. Policing the unauthorized use of our products, trademarks andother proprietary rights is expensive, difficult and, in some cases, impossible. Litigation may be necessary in thefuture to enforce or defend our intellectual property rights, to protect our trade secrets or to determine the validityand scope of the proprietary rights of others. Such litigation could result in substantial costs and diversion ofmanagement resources, either of which could harm our business. Accordingly, despite our efforts, we may not beable to prevent third parties from infringing upon or misappropriating our intellectual property.
Our development of enhanced services could subject us to claims of patent infringement that would adverselyaffect our results of operations.
We offer enhanced telecommunications and related software services through our dedicated network. Certainenhanced services similar to some of the services we offer have been the subject of claims by certain patentholders that providing the enhanced services violates existing patent rights covering the manner and method by
17
which the services are performed. We may not be aware of claims that have arisen alleging enhanced services weoffer infringe on intellectual property rights of others. Infringement of intellectual property rights would have anadverse impact on the net revenue generated from sales of the enhanced services.
If our solutions fail to perform properly or if they contain technical defects, our reputation could be harmed,our market share may decline and we could be subject to product liability claims.
Our software products and services may contain undetected errors or defects that may result in product failures,slow response times, or otherwise cause our products to fail to perform in accordance with customerexpectations. Because our customers use our products and services for important aspects of their business, anyerrors or defects in, or other performance problems with, our products and services could hurt our reputation andmay damage our customers’ businesses. If that occurs, we could lose future sales, or our existing customers couldelect to not renew or to delay or withhold payment to us, which could result in an increase in our provision foruncollectible accounts and an increase in collection cycles for accounts receivable. Clients also may makewarranty claims against us, which could result in the expense and risk of litigation. Product performanceproblems could result in loss of market share, failure to achieve market acceptance and the diversion ofdevelopment resources. If one or more of our products fails to perform or contains a technical defect, a customermay assert a claim against us for substantial damages, whether or not we are responsible for the product failure ordefect. We do not currently maintain any warranty reserves. inContact has had no significant warranty costs inour historical experience.
Product liability claims could require us to spend significant time and money in litigation or to pay significantsettlements or damages. Although we maintain general liability insurance, including coverage for errors andomissions, this coverage may not be sufficient to cover liabilities resulting from such product liability claims.Also, our insurer may disclaim coverage. Our liability insurance also may not continue to be available to us onreasonable terms, in sufficient amounts, or at all. Any product liability claims successfully brought against uswould cause our business to suffer.
We provide service level commitments to our customers, which could cause us to issue credits for futureservices if the stated service levels are not met for a given period and could significantly harm our revenue.
Our customer agreements provide service level commitments. If we are unable to meet the stated service levelcommitments or suffer extended periods of unavailability for our service, we may be contractually obligated toprovide these customers with credits for future services. Our revenue could be significantly impacted if we sufferunscheduled downtime that exceeds the allowed downtimes under our agreements with our customers. In light ofour historical experience with meeting our service level commitments, we do not currently have any reserves onour balance sheet for these commitments. The failure to meet this level of service availability may require us tocredit qualifying customers for the value of an entire month of their subscription fees, not just the value of thesubscription fee for the period of the downtime. As a result, a failure to deliver services for a relatively shortduration could cause us to issue these credits to all qualifying customers. Any extended service outages couldharm our reputation, revenue and operating results.
We are expanding the sales of our services to customers located outside of the United States so our businesswill be susceptible to risks associated with international operations.
In 2010, we opened up offices outside of the United States and currently have operations, sales personnel orindependent consultants in several foreign countries. We have limited experience operating in foreignjurisdictions. Our inexperience in operating our business outside of the United States increases the risk that ourservices and any future international expansion efforts will not be successful, which could result in us notmeeting our revenue goals. Operating in international markets also requires management attention and financialresources. We cannot be certain that the investment and additional resources required in establishing, acquiringor integrating operations in other countries will produce desired levels of revenues or profitability. In addition,
18
conducting international operations subjects us to new risks that we have not generally faced in the United States.These may include:
• Fluctuations in currency exchange rates;
• Unexpected changes in foreign regulatory requirements;
• Longer accounts receivable payment cycles and difficulties in collecting accounts receivable;
• Difficulties in managing and staffing international operations;
• Potentially adverse tax consequences, including the complexities of foreign value added tax systemsand restrictions on the repatriation of earnings;
• General economic conditions in international markets, including the ongoing global economicdownturn and continued uncertainty in the global financial markets, which may cause a decline incustomer or consumer activity;
• Localization of our services, including translation into foreign languages and associated expenses;
• Dependence on certain third parties to increase customer sales;
• The burdens of complying with a wide variety of foreign laws and different legal standards, includinglaws and regulations related to privacy;
• Increased financial accounting and reporting burdens and complexities;
• Increased risk for international telecom fraud;
• Political instability abroad, terrorist attacks and security concerns in general; and
• Reduced or varied protection for intellectual property rights in some countries.
The occurrence of any one of these risks could negatively affect our international business and, consequently, ourresults of operations generally.
Regulation of IP telephony services is unclear, so the imposition of significant regulation in the future couldadversely affect our operations.
We deliver our inContact portfolio of cloud-based software services and move other long distance servicethrough our VoIP Network. We view government regulation as one of the conditions of the environment withinwhich we conduct business that does impact, and will continue to impact, our business as we endeavor to complywith existing regulation and what may come in the future. At both the federal and state level there are initiatives,proposals, proceedings and investigations pending with respect to telecommunications and the Internet that wedescribe in some detail above in the “Government Regulation” section of ITEM 1. BUSINESS. This sectiondescribes areas where the regulatory landscape could change and significantly impact our business, and youshould review that section carefully. Our failure to anticipate, plan for, and comply with new regulation as itcomes along on a cost effective basis is a continuing risk of our business that could have a significant adverseeffect on our business activity and results of operations.
ITEM 1B. UNRESOLVED STAFF COMMENTS
We have not received any comments from the Securities and Exchange Commission that remain unresolved.
ITEM 2. PROPERTIES
We lease our principal office space in Salt Lake City, Utah, which is our corporate headquarters, including ourprincipal administrative, marketing, technical support and research and development facilities. The space consistsof approximately 50,000 square feet and the lease for this office space expires in June 2015, but we have an
19
option to renew the lease for an additional five years at the end of the lease period. We also lease smaller officespaces in California, England and the Philippines. We believe that our current facilities are suitable and adequateto meet our current needs, and that suitable additional or substitute space will be available as needed toaccommodate expansion of our operations.
The hosting of our equipment and software at co-located third-party facilities is significant to our business andwe have entered into agreements with third-party facilities in California, Texas, England, Germany, Hong Kongand the Philippines under multiple agreements that either continue month-to-month or expire between February2014 and September 2016. We believe that our contracted space for our hardware and software at these facilitiesis both suitable and adequate for our current development plans and that suitable additional facilities will beavailable as needed.
ITEM 3. LEGAL PROCEEDINGS
In May 2009, inContact was served in a lawsuit titled California College, Inc., et al., v. UCN, Inc., et al. Thelawsuit was filed in the Third Judicial District Court for Salt Lake County, Utah, Case No. 090907053. In thelawsuit California College and its affiliates allege that (1) inContact made intentional and/or negligentmisrepresentations in connection with the sale of inContact services to California College and CaliforniaCollege’s purchase of an outbound call software program from Insidesales.com, Inc, another defendant in thelawsuit, (2) that inContact breached its service contract with California College and the contract betweenCalifornia College and Insidesales.com by failing to deliver contracted services and product and failing to abideby implied covenants of good faith and fair dealing, and (3) the conduct of inContact interfered with prospectiveeconomic business relations of California College with respect to enrolling students. On each of the claims formisrepresentation, California College is seeking damages in an amount proven at trial, which amount is not lessthan $20 million. On each of the breach of contract claims pertaining to the inContact service agreement,California College is seeking damages in an amount proven at trial, which amount is not less than $1 million. Onthe interference in business relations claim, California College is seeking damages in an amount proven at trial,which amount is not less than $20 million. Pursuant to a motion filed by Insidesales.com, California College filedan amended complaint that was answered by Insidesales.com and us in February 2010. Furthermore,Insidesales.com and inContact filed cross-claims against one another, which they subsequently agreed to dismisswith prejudice. In October 2011, California College and Insidesales.com agreed to a settlement of the claimsasserted against Insidesales.com, and Insidesales.com was dismissed from the lawsuit. The remaining parties arenow pursuing discovery. inContact has denied all of the substantive allegations of the complaint and cross-claimand intends to defend the claims vigorously. Management believes the claims against inContact are without meritand no liability has been recorded.
We are the subject of certain legal matters, which we consider incidental to our business activities. It is theopinion of management that the ultimate disposition of these other matters will not have a material impact on ourfinancial position, liquidity or results of operations.
ITEM 4. MINE SAFETY DISCLOSURES
This item does not apply to our business.
20
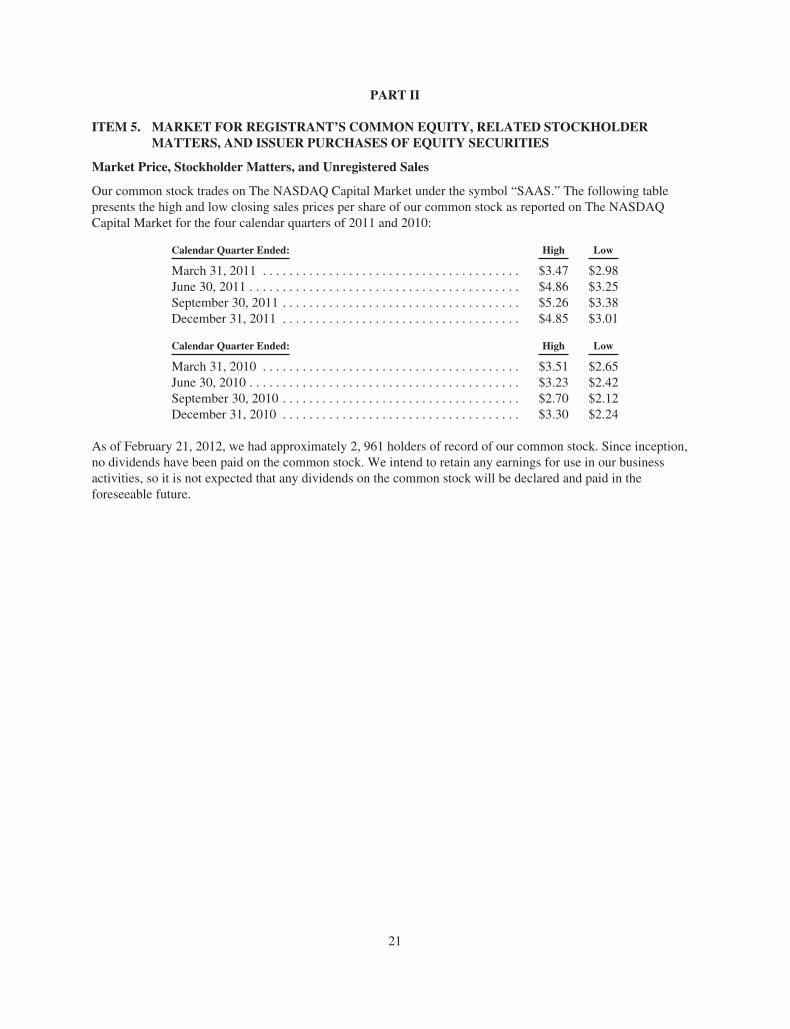
PART II
ITEM 5. MARKET FOR REGISTRANT’S COMMON EQUITY, RELATED STOCKHOLDERMATTERS, AND ISSUER PURCHASES OF EQUITY SECURITIES
Market Price, Stockholder Matters, and Unregistered Sales
Our common stock trades on The NASDAQ Capital Market under the symbol “SAAS.” The following tablepresents the high and low closing sales prices per share of our common stock as reported on The NASDAQCapital Market for the four calendar quarters of 2011 and 2010:
Calendar Quarter Ended: High Low
March 31, 2011 . . . . . . . . . . . . . . . . . . . . . . . . . . . . . . . . . . . . . . . $3.47 $2.98June 30, 2011 . . . . . . . . . . . . . . . . . . . . . . . . . . . . . . . . . . . . . . . . . $4.86 $3.25September 30, 2011 . . . . . . . . . . . . . . . . . . . . . . . . . . . . . . . . . . . . $5.26 $3.38December 31, 2011 . . . . . . . . . . . . . . . . . . . . . . . . . . . . . . . . . . . . $4.85 $3.01
Calendar Quarter Ended: High Low
March 31, 2010 . . . . . . . . . . . . . . . . . . . . . . . . . . . . . . . . . . . . . . . $3.51 $2.65June 30, 2010 . . . . . . . . . . . . . . . . . . . . . . . . . . . . . . . . . . . . . . . . . $3.23 $2.42September 30, 2010 . . . . . . . . . . . . . . . . . . . . . . . . . . . . . . . . . . . . $2.70 $2.12December 31, 2010 . . . . . . . . . . . . . . . . . . . . . . . . . . . . . . . . . . . . $3.30 $2.24
As of February 21, 2012, we had approximately 2, 961 holders of record of our common stock. Since inception,no dividends have been paid on the common stock. We intend to retain any earnings for use in our businessactivities, so it is not expected that any dividends on the common stock will be declared and paid in theforeseeable future.
21
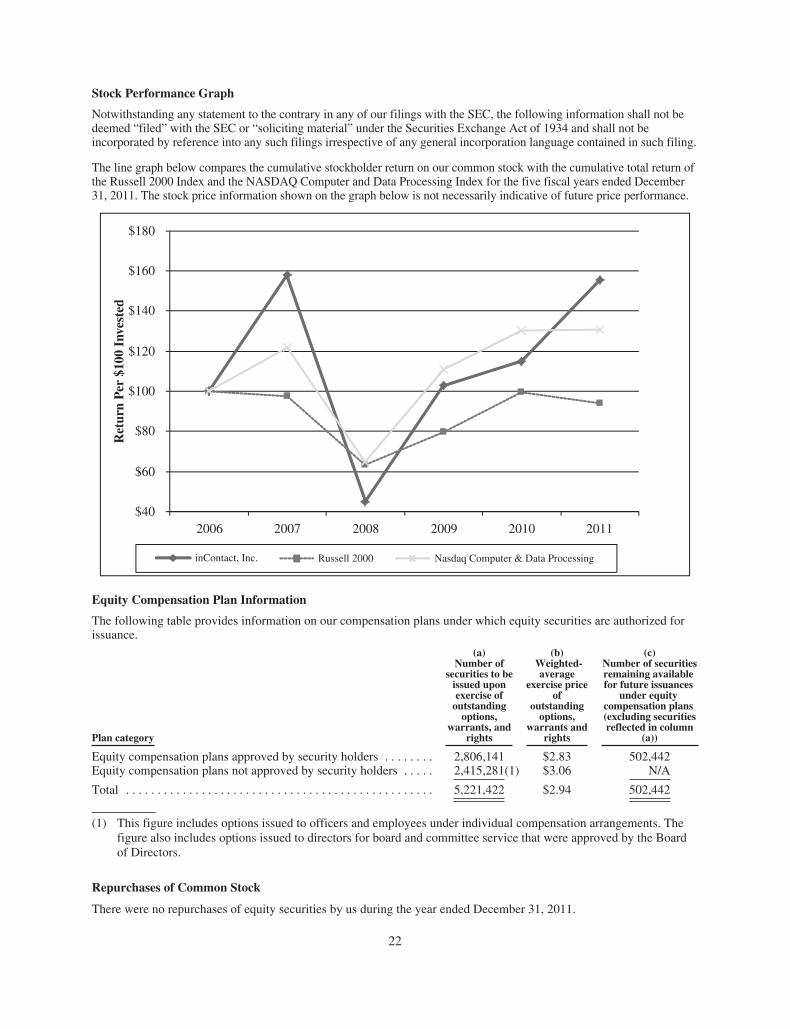
Stock Performance Graph
Notwithstanding any statement to the contrary in any of our filings with the SEC, the following information shall not bedeemed “filed” with the SEC or “soliciting material” under the Securities Exchange Act of 1934 and shall not beincorporated by reference into any such filings irrespective of any general incorporation language contained in such filing.
The line graph below compares the cumulative stockholder return on our common stock with the cumulative total return ofthe Russell 2000 Index and the NASDAQ Computer and Data Processing Index for the five fiscal years ended December31, 2011. The stock price information shown on the graph below is not necessarily indicative of future price performance.
$180
$160
$140
$120
$100
$80
$60
$402006 2007 2008 2009 2010 2011
Ret
urn
Per
$10
0 In
vest
ed
inContact, Inc. Russell 2000 Nasdaq Computer & Data Processing
Equity Compensation Plan Information
The following table provides information on our compensation plans under which equity securities are authorized forissuance.
Plan category
(a)Number of
securities to beissued uponexercise ofoutstandingoptions,
warrants, andrights
(b)Weighted-average
exercise priceof
outstandingoptions,
warrants andrights
(c)Number of securitiesremaining availablefor future issuances
under equitycompensation plans(excluding securitiesreflected in column
(a))
Equity compensation plans approved by security holders . . . . . . . . 2,806,141 $2.83 502,442Equity compensation plans not approved by security holders . . . . . 2,415,281(1) $3.06 N/A
Total . . . . . . . . . . . . . . . . . . . . . . . . . . . . . . . . . . . . . . . . . . . . . . . . . 5,221,422 $2.94 502,442
(1) This figure includes options issued to officers and employees under individual compensation arrangements. Thefigure also includes options issued to directors for board and committee service that were approved by the Boardof Directors.
Repurchases of Common Stock
There were no repurchases of equity securities by us during the year ended December 31, 2011.
22
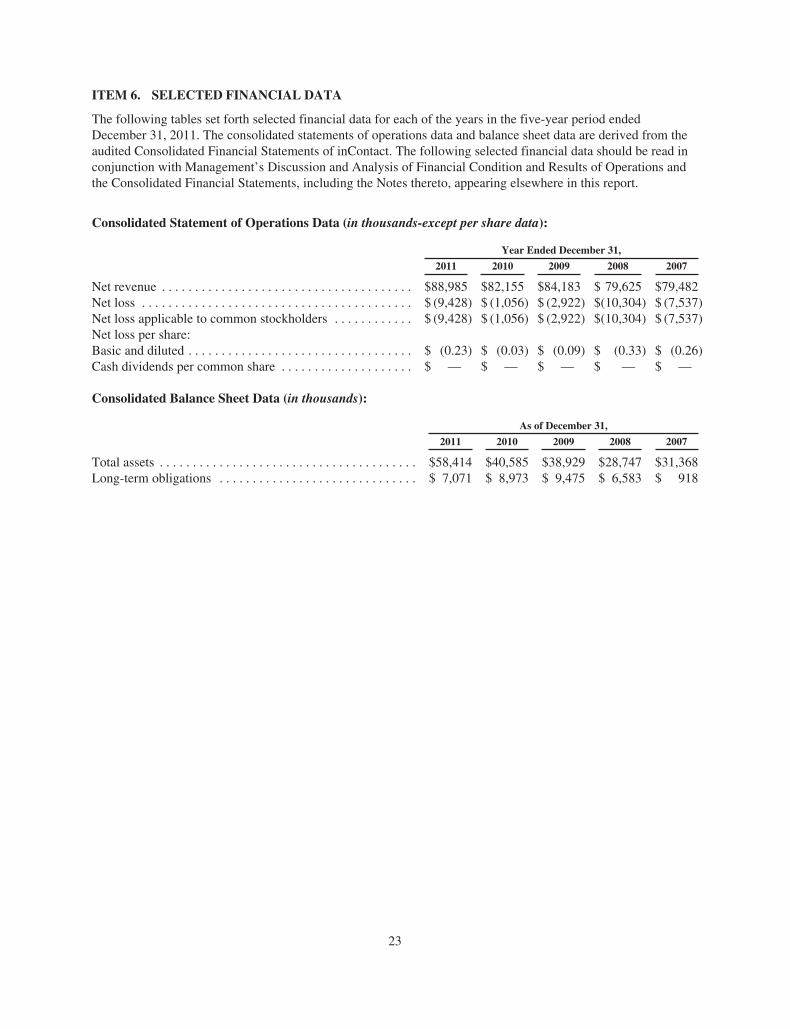
ITEM 6. SELECTED FINANCIAL DATA
The following tables set forth selected financial data for each of the years in the five-year period endedDecember 31, 2011. The consolidated statements of operations data and balance sheet data are derived from theaudited Consolidated Financial Statements of inContact. The following selected financial data should be read inconjunction with Management’s Discussion and Analysis of Financial Condition and Results of Operations andthe Consolidated Financial Statements, including the Notes thereto, appearing elsewhere in this report.
Consolidated Statement of Operations Data (in thousands-except per share data):
Year Ended December 31,
2011 2010 2009 2008 2007
Net revenue . . . . . . . . . . . . . . . . . . . . . . . . . . . . . . . . . . . . . . $88,985 $82,155 $84,183 $ 79,625 $79,482Net loss . . . . . . . . . . . . . . . . . . . . . . . . . . . . . . . . . . . . . . . . . $ (9,428) $ (1,056) $ (2,922) $(10,304) $ (7,537)Net loss applicable to common stockholders . . . . . . . . . . . . $ (9,428) $ (1,056) $ (2,922) $(10,304) $ (7,537)Net loss per share:Basic and diluted . . . . . . . . . . . . . . . . . . . . . . . . . . . . . . . . . . $ (0.23) $ (0.03) $ (0.09) $ (0.33) $ (0.26)Cash dividends per common share . . . . . . . . . . . . . . . . . . . . $ — $ — $ — $ — $ —
Consolidated Balance Sheet Data (in thousands):
As of December 31,
2011 2010 2009 2008 2007
Total assets . . . . . . . . . . . . . . . . . . . . . . . . . . . . . . . . . . . . . . . $58,414 $40,585 $38,929 $28,747 $31,368Long-term obligations . . . . . . . . . . . . . . . . . . . . . . . . . . . . . . $ 7,071 $ 8,973 $ 9,475 $ 6,583 $ 918
23
ITEM 7. MANAGEMENT’S DISCUSSION AND ANALYSIS OF FINANCIAL CONDITION ANDRESULTS OF OPERATIONS
Introduction
Management’s discussion and analysis of financial condition and results of operations (“MD&A”) is provided asa supplement to the accompanying consolidated financial statements and notes to help provide an understandingof inContact’s financial condition, cash flows and results of operations. MD& A is organized as follows:
Overview. This section provides a general description of our business, as well as recent developments we believeare important in understanding the results of operations and financial condition or in understanding anticipatedfuture trends.
Consolidated Results of Operations. This section provides an analysis of our consolidated results of operationsfor the three years ended December 31, 2011.
Segment Results of Operations. This section provides an analysis of our segment results of operations for thethree years ended December 31, 2011.
Liquidity and Capital Resources. This section provides an analysis of our cash flows for the three years endedDecember 31, 2011, as well as a discussion of our outstanding debt and commitments that existed as ofDecember 31, 2011. Included in the analysis of outstanding debt is a discussion of the amount of financialcapacity available to fund our future commitments, as well as a discussion of other financing arrangements.
Contractual Obligations and Off-Balance Sheet Arrangements. This section provides a tabular presentation ofour outstanding contractual obligations that existed as of December 31, 2011.
Critical Accounting Estimates. This section discusses accounting estimates that are considered important to ourresults of operations and financial condition, require significant judgment and require estimates on the part ofmanagement in application. Our significant accounting policies, including those considered to be criticalaccounting policies, are summarized in Note 1 to the accompanying consolidated financial statements.
Overview
We began in 1997 as a reseller of telecommunications services and have evolved to become a leading provider ofend-to-end, cloud-based contact center software services and network connectivity. We strive to deliver the mostproven solutions quickly and with ease, helping our customers reduce the cost and improve the quality of everyuser interaction.
We began offering cloud-based software solutions to the contact center market in 2005. Our dynamic technologyplatform provides our customers a solution without the costs and complexities of legacy systems. Our provendelivery model provides cost savings and removes the complexities of deploying and maintaining a premised-based solution, while providing flexibility to change with business needs.
We provide software which includes automatic call distribution with skills-based routing, interactive voiceresponse with speech recognition, computer telephony integration capabilities, reporting, workforce optimization,e-learning, contact center agent hiring and customer feedback measurement tools. Taken together, the inContactcloud-based platform creates an integrated solution for contact centers, including those with distributedworkforces—either at-home or multi-site.
24
Recent Developments
Our primary financial objective is to generate recurring cloud-based software revenue from sustainable sourcesby investing in various cloud-based software growth initiatives, as we believe we are in the early stages of alarge, long-term market. In the past, we have grown that business through our direct sales initiatives and referralpartner arrangements. We added a new sales channel in 2011. In June 2011, we entered into our first reselleragreement for our cloud-based contact center solutions with Siemens. Siemens is a world-wide distributor/reseller of our portfolio of cloud-based software solutions, which includes the exclusive right to sell our solutionsin EMEA. In November 2011, we entered into a North America reseller agreement with Verizon. Our newopportunity in 2011 is to leverage the marketing and sales capacity of these large enterprises selling to call centerowners and operators to substantially increase our business in North America and establish our business overseas– all of which we believe will generate significant growth in our recurring cloud-based software revenue.
This new opportunity means we must invest in the infrastructure required to deliver our cloud-based software tonew enterprise and international customers and increase our customer service and support capacity. We beganmaking that investment in 2011, and were able to fund our expenditures in 2011, as well as expectedexpenditures in 2012, with the $23.6 million we raised from the sale of 7.2 million shares of common stock to aparent company of Siemens. Even so, the investment we made increased our cost of services and other operatingexpenses in 2011, which adversely affected our margins and results of operations. Our ability to recoup thatinvestment depends on how successful our reseller strategy is in 2012 and beyond, but we are able to mitigate therisk associated with future realization of sales by obtaining minimum purchase commitments from Siemens togenerate $5.0 million of net software revenue in 2012 and $10.0 million in 2013.
Trends in Our Business
There has been in increase in costs of revenue during 2011 due to greater professional service and customerservice personnel costs as we employ more personnel, including higher-paid employees with more developedskill sets to service larger mid-market and enterprise customers, greater direct costs attributable to establishingour international infrastructure and international call traffic, and an increase in amortization of previouslycapitalized internal use software costs. We expect costs of revenue in absolute dollars to continue to increase, butwe expect the costs of revenue as a percentage of sales to decrease as we anticipate an increase in revenue as aresult of developing the infrastructure to service more enterprise and international customers, investing in salesand marketing activities, and from the additional sales channel added during 2011 from entering into reselleragreements with Siemens and Verizon.
We experienced an increase in Telecom segment revenue for the first time in several years. The increase isassociated with the increase in Telecom revenue from our inContact portfolio customers exceeding lost revenuefrom attrition of our Telecom only customers. We expect the Telecom revenue from our inContact portfoliocustomer to continue to exceed the attrition of our Telecom only customers in 2012.
Sources of Revenue
We derive our revenues from two major business activities: (1) delivery and support of our inContact portfolio ofsoftware services and associated professional services and (2) reselling telecommunication services. Our primarybusiness focus is marketing and selling our inContact portfolio.
Software
Software delivery and support of our inContact portfolio is provided on a monthly recurring subscription basis.Monthly recurring charges are billed in arrears and recognized for the period in which they are earned. Inaddition to the monthly recurring revenue, revenue is also received on a non-recurring basis for professionalservices included in implementing or improving a user’s inContact portfolio experience. Customers access
25
“cloud-based” software and data through a secure Internet connection. Support services include technicalassistance for our software products and product upgrades and enhancements on a when and if available basis.Our telecommunications and data network is fundamental to our inContact portfolio and allows us to provide theall-in-one inContact solution.
Telecom
We continue to derive revenue from traditional telecommunications services such as dedicated transport,switched long distance and data services. These services are provided over our network or through third partytelecommunications providers. Revenue for transactional long distance usage is derived based on user specificrate plans and the user’s call usage and is recognized in the period the call is initiated. Users are also billedmonthly charges in arrears and revenue is recognized for such charges over the billing period. If the billingperiod spans more than one month, earned but unbilled revenues are recognized as revenue for incurred usage todate.
Costs of Revenue and Operating Expenses
Costs of Revenue
Costs of revenue consist primarily of payments to third party long distance service providers for resoldtelecommunication services to our customers. Costs of revenue also include salaries (including stock-basedcompensation) and related expenses for our software services delivery, support and professional servicesorganizations, equipment depreciation relating to our services, amortization of acquired intangible assets,amortization of capitalized internal use software development costs, and allocated overhead, such as rent, utilitiesand depreciation on property and equipment. As a result, overhead expenses are included in costs of revenue andeach operating expense category. The cost associated with providing professional services is significantly higheras a percentage of revenue than the cost associated with delivering our software services due to the labor costsassociated with providing professional services. We anticipate that we will incur additional costs for longdistance service providers, hosting, support, employee salaries and related expenses, to support delivery of oursoftware solutions in the future.
Selling and Marketing
Selling and marketing expenses consist primarily of salaries (including stock-based compensation) and relatedexpenses for employees in sales and marketing, including commissions and bonuses, advertising, marketingevents, corporate communications, expenses, travel costs and allocated overhead. Since our Software segmentrevenue is delivered and therefore recognized over time, we have experienced a delay between increasing salesand marketing expenses and the recognition of the corresponding revenue. We believe it is important to continueinvesting in selling and marketing to create brand awareness and lead generation opportunities, to increasemarket share and to support the resellers added in 2011. Accordingly, we expect selling and marketing expensesto increase in absolute dollars as we continue to support growth initiatives.
Research and Development
Research and development expenses consist primarily of the non-capitalized portion of salary (including stock-based compensation) and related expenses for development personnel and costs related to the development ofnew products, enhancement of existing products, quality assurance, market research, testing, productmanagement and allocated overhead. We expect research and development expenses to increase in absolutedollars in the future as we intend to release new features and functionality on a frequent basis, expand our contentofferings, upgrade and extend our service offerings and develop new technologies.
26
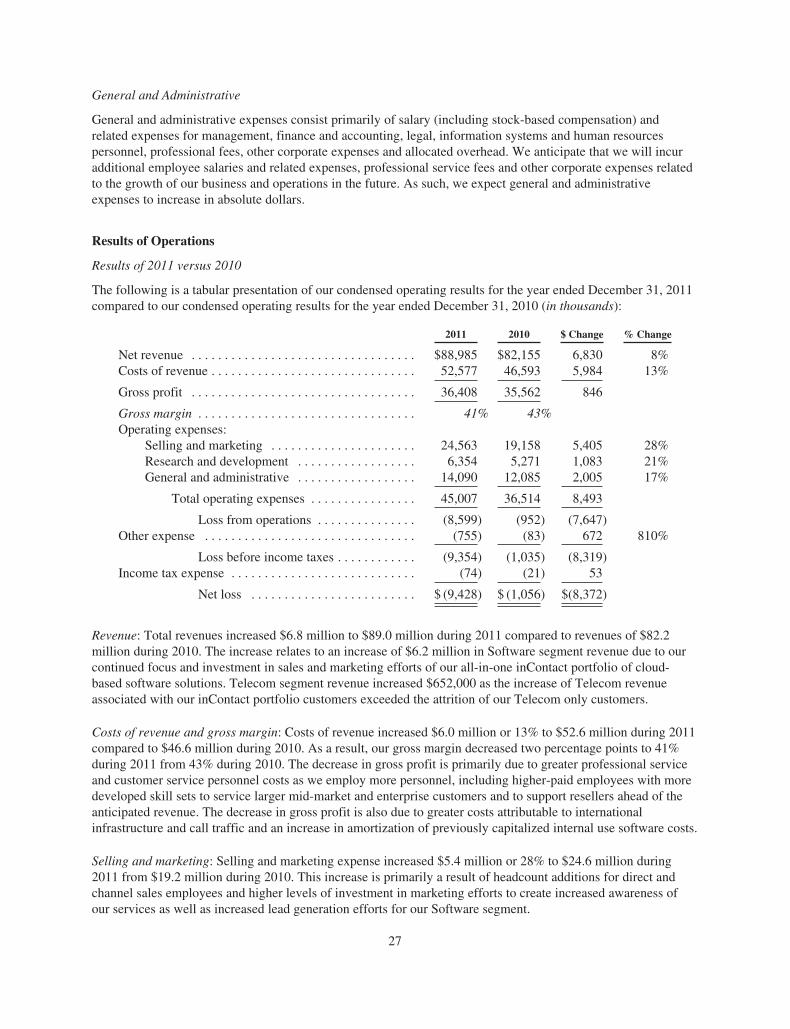
General and Administrative
General and administrative expenses consist primarily of salary (including stock-based compensation) andrelated expenses for management, finance and accounting, legal, information systems and human resourcespersonnel, professional fees, other corporate expenses and allocated overhead. We anticipate that we will incuradditional employee salaries and related expenses, professional service fees and other corporate expenses relatedto the growth of our business and operations in the future. As such, we expect general and administrativeexpenses to increase in absolute dollars.
Results of Operations
Results of 2011 versus 2010
The following is a tabular presentation of our condensed operating results for the year ended December 31, 2011compared to our condensed operating results for the year ended December 31, 2010 (in thousands):
2011 2010 $ Change % Change
Net revenue . . . . . . . . . . . . . . . . . . . . . . . . . . . . . . . . . . $88,985 $82,155 6,830 8%Costs of revenue . . . . . . . . . . . . . . . . . . . . . . . . . . . . . . . 52,577 46,593 5,984 13%
Gross profit . . . . . . . . . . . . . . . . . . . . . . . . . . . . . . . . . . 36,408 35,562 846
Gross margin . . . . . . . . . . . . . . . . . . . . . . . . . . . . . . . . . 41% 43%Operating expenses:
Selling and marketing . . . . . . . . . . . . . . . . . . . . . . 24,563 19,158 5,405 28%Research and development . . . . . . . . . . . . . . . . . . 6,354 5,271 1,083 21%General and administrative . . . . . . . . . . . . . . . . . . 14,090 12,085 2,005 17%
Total operating expenses . . . . . . . . . . . . . . . . 45,007 36,514 8,493
Loss from operations . . . . . . . . . . . . . . . (8,599) (952) (7,647)Other expense . . . . . . . . . . . . . . . . . . . . . . . . . . . . . . . . (755) (83) 672 810%
Loss before income taxes . . . . . . . . . . . . (9,354) (1,035) (8,319)Income tax expense . . . . . . . . . . . . . . . . . . . . . . . . . . . . (74) (21) 53
Net loss . . . . . . . . . . . . . . . . . . . . . . . . . $ (9,428) $ (1,056) $(8,372)
Revenue: Total revenues increased $6.8 million to $89.0 million during 2011 compared to revenues of $82.2million during 2010. The increase relates to an increase of $6.2 million in Software segment revenue due to ourcontinued focus and investment in sales and marketing efforts of our all-in-one inContact portfolio of cloud-based software solutions. Telecom segment revenue increased $652,000 as the increase of Telecom revenueassociated with our inContact portfolio customers exceeded the attrition of our Telecom only customers.
Costs of revenue and gross margin: Costs of revenue increased $6.0 million or 13% to $52.6 million during 2011compared to $46.6 million during 2010. As a result, our gross margin decreased two percentage points to 41%during 2011 from 43% during 2010. The decrease in gross profit is primarily due to greater professional serviceand customer service personnel costs as we employ more personnel, including higher-paid employees with moredeveloped skill sets to service larger mid-market and enterprise customers and to support resellers ahead of theanticipated revenue. The decrease in gross profit is also due to greater costs attributable to internationalinfrastructure and call traffic and an increase in amortization of previously capitalized internal use software costs.
Selling and marketing: Selling and marketing expense increased $5.4 million or 28% to $24.6 million during2011 from $19.2 million during 2010. This increase is primarily a result of headcount additions for direct andchannel sales employees and higher levels of investment in marketing efforts to create increased awareness ofour services as well as increased lead generation efforts for our Software segment.
27
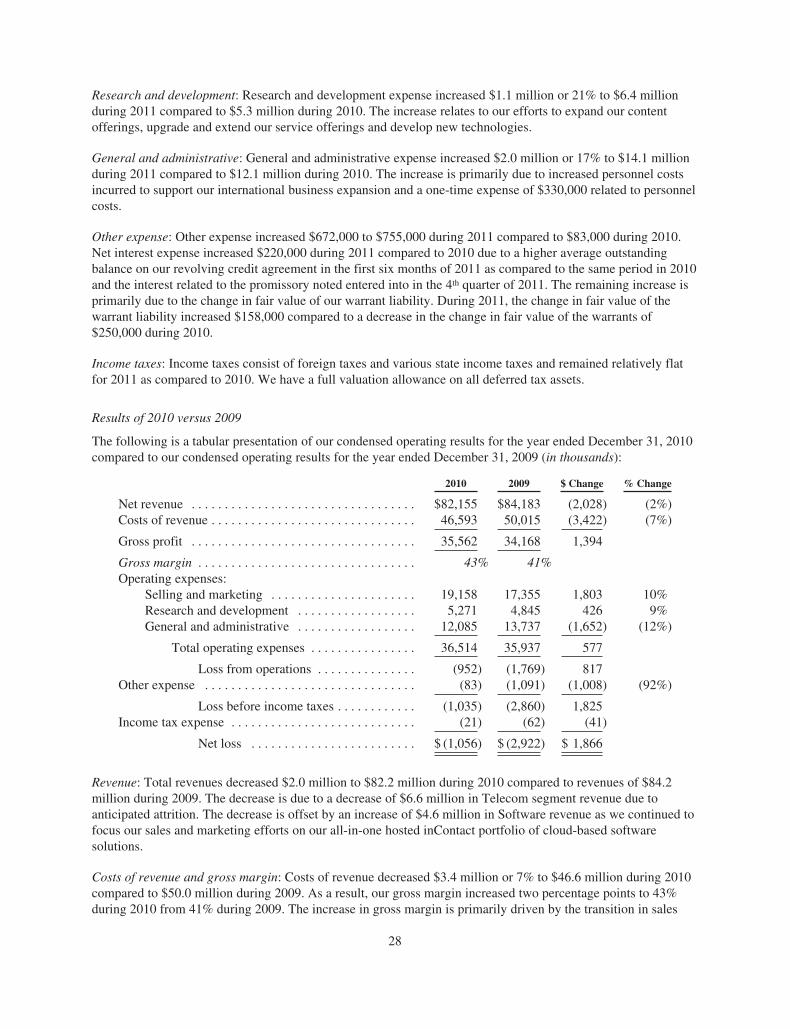
Research and development: Research and development expense increased $1.1 million or 21% to $6.4 millionduring 2011 compared to $5.3 million during 2010. The increase relates to our efforts to expand our contentofferings, upgrade and extend our service offerings and develop new technologies.
General and administrative: General and administrative expense increased $2.0 million or 17% to $14.1 millionduring 2011 compared to $12.1 million during 2010. The increase is primarily due to increased personnel costsincurred to support our international business expansion and a one-time expense of $330,000 related to personnelcosts.
Other expense: Other expense increased $672,000 to $755,000 during 2011 compared to $83,000 during 2010.Net interest expense increased $220,000 during 2011 compared to 2010 due to a higher average outstandingbalance on our revolving credit agreement in the first six months of 2011 as compared to the same period in 2010and the interest related to the promissory noted entered into in the 4th quarter of 2011. The remaining increase isprimarily due to the change in fair value of our warrant liability. During 2011, the change in fair value of thewarrant liability increased $158,000 compared to a decrease in the change in fair value of the warrants of$250,000 during 2010.
Income taxes: Income taxes consist of foreign taxes and various state income taxes and remained relatively flatfor 2011 as compared to 2010. We have a full valuation allowance on all deferred tax assets.
Results of 2010 versus 2009
The following is a tabular presentation of our condensed operating results for the year ended December 31, 2010compared to our condensed operating results for the year ended December 31, 2009 (in thousands):
2010 2009 $ Change % Change
Net revenue . . . . . . . . . . . . . . . . . . . . . . . . . . . . . . . . . . $82,155 $84,183 (2,028) (2%)Costs of revenue . . . . . . . . . . . . . . . . . . . . . . . . . . . . . . . 46,593 50,015 (3,422) (7%)
Gross profit . . . . . . . . . . . . . . . . . . . . . . . . . . . . . . . . . . 35,562 34,168 1,394
Gross margin . . . . . . . . . . . . . . . . . . . . . . . . . . . . . . . . . 43% 41%Operating expenses:
Selling and marketing . . . . . . . . . . . . . . . . . . . . . . 19,158 17,355 1,803 10%Research and development . . . . . . . . . . . . . . . . . . 5,271 4,845 426 9%General and administrative . . . . . . . . . . . . . . . . . . 12,085 13,737 (1,652) (12%)
Total operating expenses . . . . . . . . . . . . . . . . 36,514 35,937 577
Loss from operations . . . . . . . . . . . . . . . (952) (1,769) 817Other expense . . . . . . . . . . . . . . . . . . . . . . . . . . . . . . . . (83) (1,091) (1,008) (92%)
Loss before income taxes . . . . . . . . . . . . (1,035) (2,860) 1,825Income tax expense . . . . . . . . . . . . . . . . . . . . . . . . . . . . (21) (62) (41)
Net loss . . . . . . . . . . . . . . . . . . . . . . . . . $ (1,056) $ (2,922) $ 1,866
Revenue: Total revenues decreased $2.0 million to $82.2 million during 2010 compared to revenues of $84.2million during 2009. The decrease is due to a decrease of $6.6 million in Telecom segment revenue due toanticipated attrition. The decrease is offset by an increase of $4.6 million in Software revenue as we continued tofocus our sales and marketing efforts on our all-in-one hosted inContact portfolio of cloud-based softwaresolutions.
Costs of revenue and gross margin: Costs of revenue decreased $3.4 million or 7% to $46.6 million during 2010compared to $50.0 million during 2009. As a result, our gross margin increased two percentage points to 43%during 2010 from 41% during 2009. The increase in gross margin is primarily driven by the transition in sales
28

mix from our Telecom segment that has lower margins to our Software segment as a result of increased sales ofour inContact portfolio, which has much higher margins, and higher gross margin for the Telecom segment in2010 compared to 2009 due to the termination of low-margin Telecom customers that we purposely moved offour network in the third quarter of 2009.
Selling and marketing: Selling and marketing expense increased $1.8 million or 10% to $19.2 million during2010 from $17.4 million during 2009. This increase is a result of headcount additions for employees focused onmanaging and enhancing our partner relationships and our increased efforts to create lead generationopportunities for our Software segment. The increase in our selling and marketing efforts was partially offset byreduced commissions expense related to Telecom.
Research and development: Research and development expense increased $426,000 or 9% to $5.3 million during2010 compared to $4.9 million during 2009. The increase relates to our efforts to expand our content offerings,upgrade and extend our service offerings and develop new technologies.
General and administrative: General and administrative expense decreased $1.7 million or 12% to $12.1 millionduring 2010 compared to $13.7 million during 2009. The decrease is primarily due to a reduction of overheadcosts in the fourth quarter of 2009, which we maintained during 2010. Also, stock based compensation decreaseddue to the reduction of personnel in the fourth quarter of 2009 and the decrease in our allowance for uncollectibleaccounts due to improved collections and increased economic stability for our customer base in 2010 ascompared to 2009.
Other expense: Other expense decreased $1.0 million to $83,000 during 2010 compared to $1.1 million during2009. Net interest expense decreased $376,000 during 2010 compared to 2009 due to a lower outstandingbalance on our revolving credit agreement and a lower interest rate in 2010 as compared to 2009. The remainingdecrease of $632,000 primarily relates to the change in fair value of our warrant liability. During 2010, the fairvalue of our warrant liability decreased $250,000 and the fair value of our warrant liability increased $383,000during 2009.
Income taxes: Income taxes consist of state income taxes and remained relatively flat for 2010 as compared to2009. We have a full valuation allowance on all deferred tax assets.
Segment Reporting
We operate under two business segments: Software and Telecom. The Software segment includes all monthlyrecurring subscription revenue related to the delivery of our software applications plus the associatedprofessional services and setup fees related to the software services product features (referred to as cloud-basedor SaaS). The Telecom segment includes all voice and data long distance services provided to customers.
For segment reporting, we classify operating expenses as either “direct” or “indirect.” Direct expense refers tocosts attributable solely to either selling and marketing efforts or research and development efforts. Indirectexpense refers to costs that management considers to be overhead in running the business. Management evaluatesexpenditures for both selling and marketing and research and development efforts at the segment level withoutthe allocation of overhead expenses, such as rent, utilities and depreciation on property and equipment.
29
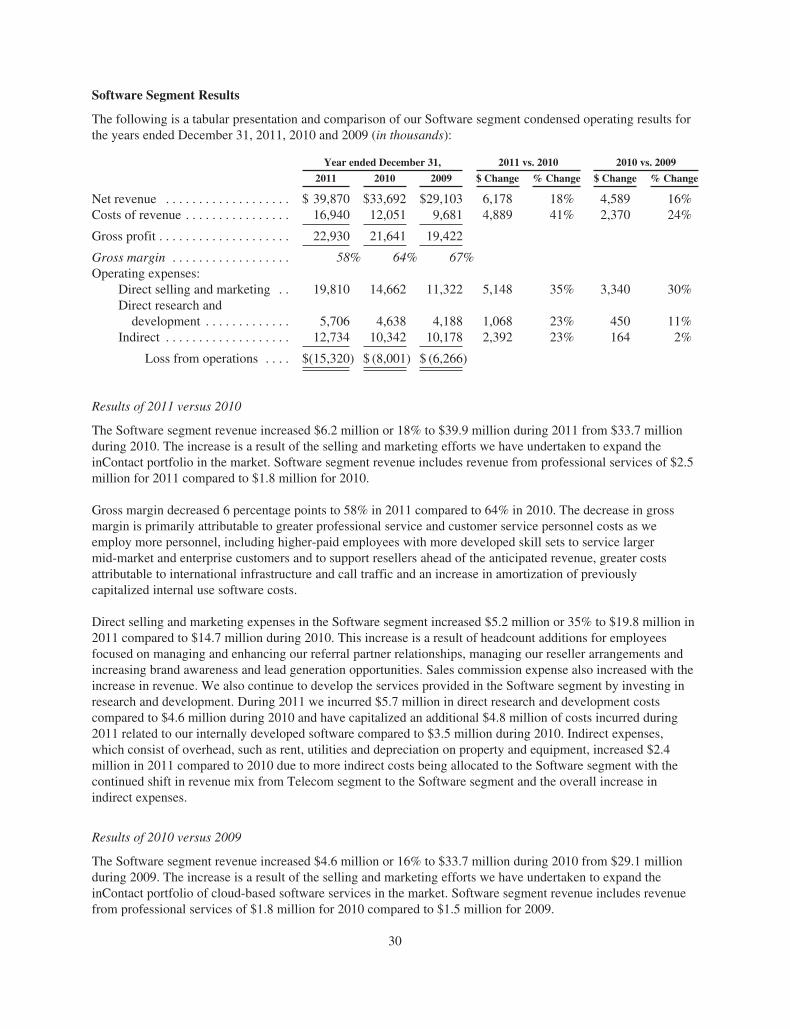
Software Segment Results
The following is a tabular presentation and comparison of our Software segment condensed operating results forthe years ended December 31, 2011, 2010 and 2009 (in thousands):
Year ended December 31, 2011 vs. 2010 2010 vs. 2009
2011 2010 2009 $ Change % Change $ Change % Change
Net revenue . . . . . . . . . . . . . . . . . . . $ 39,870 $33,692 $29,103 6,178 18% 4,589 16%Costs of revenue . . . . . . . . . . . . . . . . 16,940 12,051 9,681 4,889 41% 2,370 24%
Gross profit . . . . . . . . . . . . . . . . . . . . 22,930 21,641 19,422
Gross margin . . . . . . . . . . . . . . . . . . 58% 64% 67%Operating expenses:
Direct selling and marketing . . 19,810 14,662 11,322 5,148 35% 3,340 30%Direct research anddevelopment . . . . . . . . . . . . . 5,706 4,638 4,188 1,068 23% 450 11%
Indirect . . . . . . . . . . . . . . . . . . . 12,734 10,342 10,178 2,392 23% 164 2%
Loss from operations . . . . $(15,320) $ (8,001) $ (6,266)
Results of 2011 versus 2010
The Software segment revenue increased $6.2 million or 18% to $39.9 million during 2011 from $33.7 millionduring 2010. The increase is a result of the selling and marketing efforts we have undertaken to expand theinContact portfolio in the market. Software segment revenue includes revenue from professional services of $2.5million for 2011 compared to $1.8 million for 2010.
Gross margin decreased 6 percentage points to 58% in 2011 compared to 64% in 2010. The decrease in grossmargin is primarily attributable to greater professional service and customer service personnel costs as weemploy more personnel, including higher-paid employees with more developed skill sets to service largermid-market and enterprise customers and to support resellers ahead of the anticipated revenue, greater costsattributable to international infrastructure and call traffic and an increase in amortization of previouslycapitalized internal use software costs.
Direct selling and marketing expenses in the Software segment increased $5.2 million or 35% to $19.8 million in2011 compared to $14.7 million during 2010. This increase is a result of headcount additions for employeesfocused on managing and enhancing our referral partner relationships, managing our reseller arrangements andincreasing brand awareness and lead generation opportunities. Sales commission expense also increased with theincrease in revenue. We also continue to develop the services provided in the Software segment by investing inresearch and development. During 2011 we incurred $5.7 million in direct research and development costscompared to $4.6 million during 2010 and have capitalized an additional $4.8 million of costs incurred during2011 related to our internally developed software compared to $3.5 million during 2010. Indirect expenses,which consist of overhead, such as rent, utilities and depreciation on property and equipment, increased $2.4million in 2011 compared to 2010 due to more indirect costs being allocated to the Software segment with thecontinued shift in revenue mix from Telecom segment to the Software segment and the overall increase inindirect expenses.
Results of 2010 versus 2009
The Software segment revenue increased $4.6 million or 16% to $33.7 million during 2010 from $29.1 millionduring 2009. The increase is a result of the selling and marketing efforts we have undertaken to expand theinContact portfolio of cloud-based software services in the market. Software segment revenue includes revenuefrom professional services of $1.8 million for 2010 compared to $1.5 million for 2009.
30
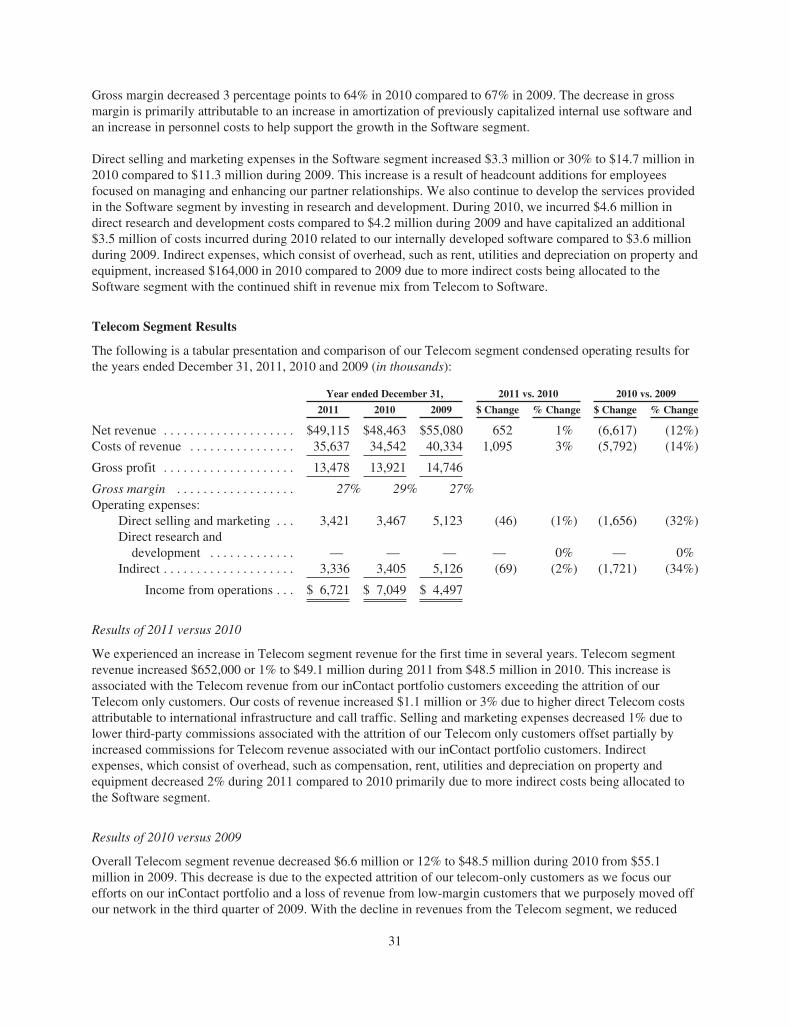
Gross margin decreased 3 percentage points to 64% in 2010 compared to 67% in 2009. The decrease in grossmargin is primarily attributable to an increase in amortization of previously capitalized internal use software andan increase in personnel costs to help support the growth in the Software segment.
Direct selling and marketing expenses in the Software segment increased $3.3 million or 30% to $14.7 million in2010 compared to $11.3 million during 2009. This increase is a result of headcount additions for employeesfocused on managing and enhancing our partner relationships. We also continue to develop the services providedin the Software segment by investing in research and development. During 2010, we incurred $4.6 million indirect research and development costs compared to $4.2 million during 2009 and have capitalized an additional$3.5 million of costs incurred during 2010 related to our internally developed software compared to $3.6 millionduring 2009. Indirect expenses, which consist of overhead, such as rent, utilities and depreciation on property andequipment, increased $164,000 in 2010 compared to 2009 due to more indirect costs being allocated to theSoftware segment with the continued shift in revenue mix from Telecom to Software.
Telecom Segment Results
The following is a tabular presentation and comparison of our Telecom segment condensed operating results forthe years ended December 31, 2011, 2010 and 2009 (in thousands):
Year ended December 31, 2011 vs. 2010 2010 vs. 2009
2011 2010 2009 $ Change % Change $ Change % Change
Net revenue . . . . . . . . . . . . . . . . . . . . $49,115 $48,463 $55,080 652 1% (6,617) (12%)Costs of revenue . . . . . . . . . . . . . . . . 35,637 34,542 40,334 1,095 3% (5,792) (14%)
Gross profit . . . . . . . . . . . . . . . . . . . . 13,478 13,921 14,746
Gross margin . . . . . . . . . . . . . . . . . . 27% 29% 27%Operating expenses:
Direct selling and marketing . . . 3,421 3,467 5,123 (46) (1%) (1,656) (32%)Direct research anddevelopment . . . . . . . . . . . . . — — — — 0% — 0%
Indirect . . . . . . . . . . . . . . . . . . . . 3,336 3,405 5,126 (69) (2%) (1,721) (34%)
Income from operations . . . $ 6,721 $ 7,049 $ 4,497
Results of 2011 versus 2010
We experienced an increase in Telecom segment revenue for the first time in several years. Telecom segmentrevenue increased $652,000 or 1% to $49.1 million during 2011 from $48.5 million in 2010. This increase isassociated with the Telecom revenue from our inContact portfolio customers exceeding the attrition of ourTelecom only customers. Our costs of revenue increased $1.1 million or 3% due to higher direct Telecom costsattributable to international infrastructure and call traffic. Selling and marketing expenses decreased 1% due tolower third-party commissions associated with the attrition of our Telecom only customers offset partially byincreased commissions for Telecom revenue associated with our inContact portfolio customers. Indirectexpenses, which consist of overhead, such as compensation, rent, utilities and depreciation on property andequipment decreased 2% during 2011 compared to 2010 primarily due to more indirect costs being allocated tothe Software segment.
Results of 2010 versus 2009
Overall Telecom segment revenue decreased $6.6 million or 12% to $48.5 million during 2010 from $55.1million in 2009. This decrease is due to the expected attrition of our telecom-only customers as we focus ourefforts on our inContact portfolio and a loss of revenue from low-margin customers that we purposely moved offour network in the third quarter of 2009. With the decline in revenues from the Telecom segment, we reduced
31
operating costs in the segment as well. Our costs of revenue decreased 14% due to continued improvement incarrier rates, and a reduction in the low-margin business mentioned previously. Direct selling and marketingexpenses decreased 32% during 2010 compared to 2009, primarily due to a decrease in commissions as wecontinue to focus more on our selling and marketing efforts of the Software segment. Indirect expenses, whichconsist of overhead, such as rent, utilities and depreciation on property and equipment, decreased 34% during2010 compared to 2009 is primarily due to our efforts to reduce costs in the fourth quarter of 2009 and moreindirect costs being allocated to the Software segment.
Liquidity and Capital Resources
Current Financial Condition
Our principal sources of liquidity are cash and cash equivalents and available borrowings under our revolvingcredit note, which expires in July 2013. At December 31, 2011, we had $17.7 million of cash and cashequivalents. In addition to our $17.7 million of cash and cash equivalents, subject to meeting covenantrequirements, we have access to additional available borrowings under our revolving credit note with Zions FirstNational Bank (“Zions”) entered into in July 2009. The available borrowings under the revolving credit note are$5.8 million at December 31, 2011, based on the maximum available advance amount calculated on theDecember 20, 2011 borrowing base certificate, resulting in total cash and additional availability under therevolving credit note of $23.5 million at December 31, 2011. The balance of our revolving credit note atDecember 31, 2011 was $2.5 million and the proceeds were used to take advantage of vendor discounts on earlypayment terms. We had no outstanding balance during most of the fourth quarter. The outstanding balance of ourrevolving credit agreement ranged from $0.0 to $8.5 million during 2011 and we paid the outstanding balance of$2.5 million in January 2012.
We experienced a net loss of $9.4 million during the year ended December 31, 2011. Significant non-cashexpenses affecting operations during 2011 were $7.1 million of depreciation and amortization and $1.5 million ofstock-based compensation. The non-cash expenses were offset by an increase in accounts receivable resulting in$3.2 million of cash being used in our operating activities during 2011.
Our working capital of $18.3 million at December 31, 2011 increased significantly from $9.2 million atDecember 31, 2010. The increase is primarily due to proceeds of $23.9 million received from the sale of stock inJune 2011, partially offset by net payments of $4.8 million on our revolving credit note, $10.0 million used forinvesting activities and net cash of $3.2 used for operating activities.
In March 2011, we entered into an equipment leasing facility commitment with Zions Credit Corporation (“ZionsCredit”). Under the terms of the leasing facility commitment, Zions Credit agreed to provide us with financing ofup to $3.0 million to lease computer related equipment for our business operations, which Zions Credit will leaseto us in the form of a capital lease. The term of the facility is 36 months upon acceptance of the leased propertyby us. The calculated interest rate is subject to change based on the three year LIBOR plus 4.5%. We had $1.7million of capital lease obligations related to this leasing facility at December 31, 2011 and $1.3 million of thisleasing facility had not been utilized at December 31, 2011 and is available for use. The final lease payments forthe utilized portion of the leasing facility will be in November 2014.
We continue to take a proactive approach in managing our operating expenditures and cash flow from operations.We expect to rely on internally generated cash, our revolving credit facility and our equipment leasing facility tofinance operations and capital requirements. We believe that existing cash and cash equivalents, cash fromoperations, available borrowings under our revolving credit note and available borrowings under our equipmentleasing facility will be sufficient to meet our cash requirements during at least the next twelve months.
Revolving Credit Note
On July 16, 2009, we entered into a revolving credit loan agreement (the “Revolving Credit Agreement”) withZions. Under the terms of the Revolving Credit Agreement, Zions has agreed to loan up to $8.5 million under a
32
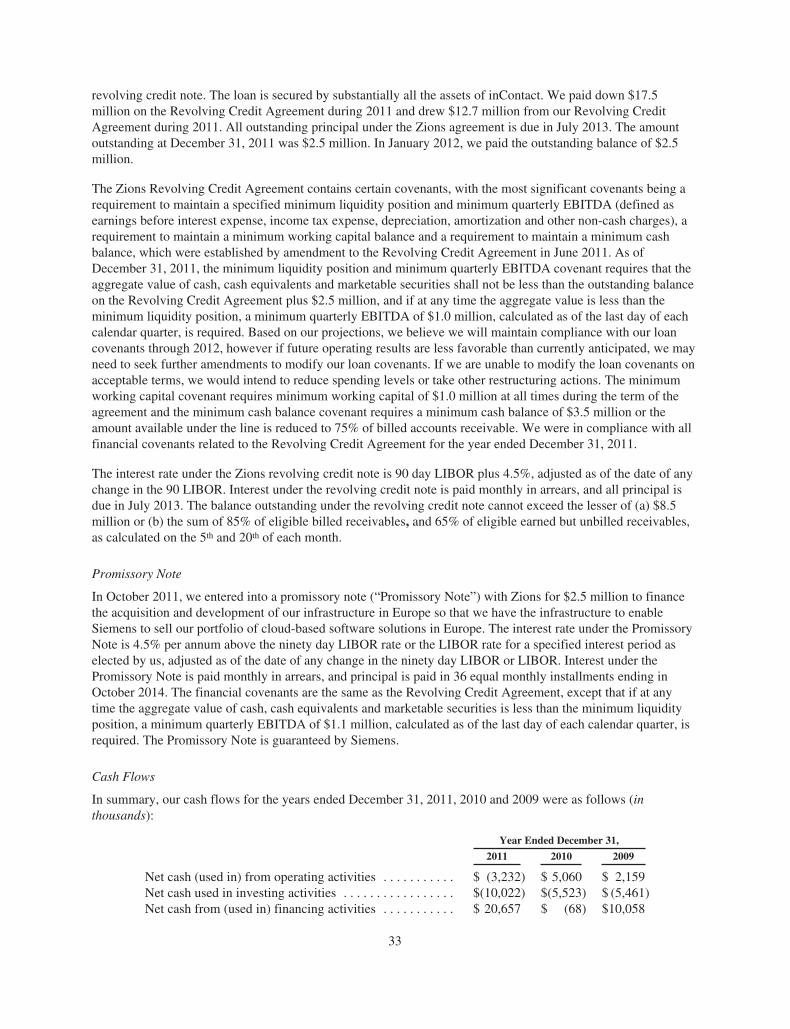
revolving credit note. The loan is secured by substantially all the assets of inContact. We paid down $17.5million on the Revolving Credit Agreement during 2011 and drew $12.7 million from our Revolving CreditAgreement during 2011. All outstanding principal under the Zions agreement is due in July 2013. The amountoutstanding at December 31, 2011 was $2.5 million. In January 2012, we paid the outstanding balance of $2.5million.
The Zions Revolving Credit Agreement contains certain covenants, with the most significant covenants being arequirement to maintain a specified minimum liquidity position and minimum quarterly EBITDA (defined asearnings before interest expense, income tax expense, depreciation, amortization and other non-cash charges), arequirement to maintain a minimum working capital balance and a requirement to maintain a minimum cashbalance, which were established by amendment to the Revolving Credit Agreement in June 2011. As ofDecember 31, 2011, the minimum liquidity position and minimum quarterly EBITDA covenant requires that theaggregate value of cash, cash equivalents and marketable securities shall not be less than the outstanding balanceon the Revolving Credit Agreement plus $2.5 million, and if at any time the aggregate value is less than theminimum liquidity position, a minimum quarterly EBITDA of $1.0 million, calculated as of the last day of eachcalendar quarter, is required. Based on our projections, we believe we will maintain compliance with our loancovenants through 2012, however if future operating results are less favorable than currently anticipated, we mayneed to seek further amendments to modify our loan covenants. If we are unable to modify the loan covenants onacceptable terms, we would intend to reduce spending levels or take other restructuring actions. The minimumworking capital covenant requires minimum working capital of $1.0 million at all times during the term of theagreement and the minimum cash balance covenant requires a minimum cash balance of $3.5 million or theamount available under the line is reduced to 75% of billed accounts receivable. We were in compliance with allfinancial covenants related to the Revolving Credit Agreement for the year ended December 31, 2011.
The interest rate under the Zions revolving credit note is 90 day LIBOR plus 4.5%, adjusted as of the date of anychange in the 90 LIBOR. Interest under the revolving credit note is paid monthly in arrears, and all principal isdue in July 2013. The balance outstanding under the revolving credit note cannot exceed the lesser of (a) $8.5million or (b) the sum of 85% of eligible billed receivables, and 65% of eligible earned but unbilled receivables,as calculated on the 5th and 20th of each month.
Promissory Note
In October 2011, we entered into a promissory note (“Promissory Note”) with Zions for $2.5 million to financethe acquisition and development of our infrastructure in Europe so that we have the infrastructure to enableSiemens to sell our portfolio of cloud-based software solutions in Europe. The interest rate under the PromissoryNote is 4.5% per annum above the ninety day LIBOR rate or the LIBOR rate for a specified interest period aselected by us, adjusted as of the date of any change in the ninety day LIBOR or LIBOR. Interest under thePromissory Note is paid monthly in arrears, and principal is paid in 36 equal monthly installments ending inOctober 2014. The financial covenants are the same as the Revolving Credit Agreement, except that if at anytime the aggregate value of cash, cash equivalents and marketable securities is less than the minimum liquidityposition, a minimum quarterly EBITDA of $1.1 million, calculated as of the last day of each calendar quarter, isrequired. The Promissory Note is guaranteed by Siemens.
Cash Flows
In summary, our cash flows for the years ended December 31, 2011, 2010 and 2009 were as follows (inthousands):
Year Ended December 31,
2011 2010 2009
Net cash (used in) from operating activities . . . . . . . . . . . $ (3,232) $ 5,060 $ 2,159Net cash used in investing activities . . . . . . . . . . . . . . . . . $(10,022) $(5,523) $ (5,461)Net cash from (used in) financing activities . . . . . . . . . . . $ 20,657 $ (68) $10,058
33
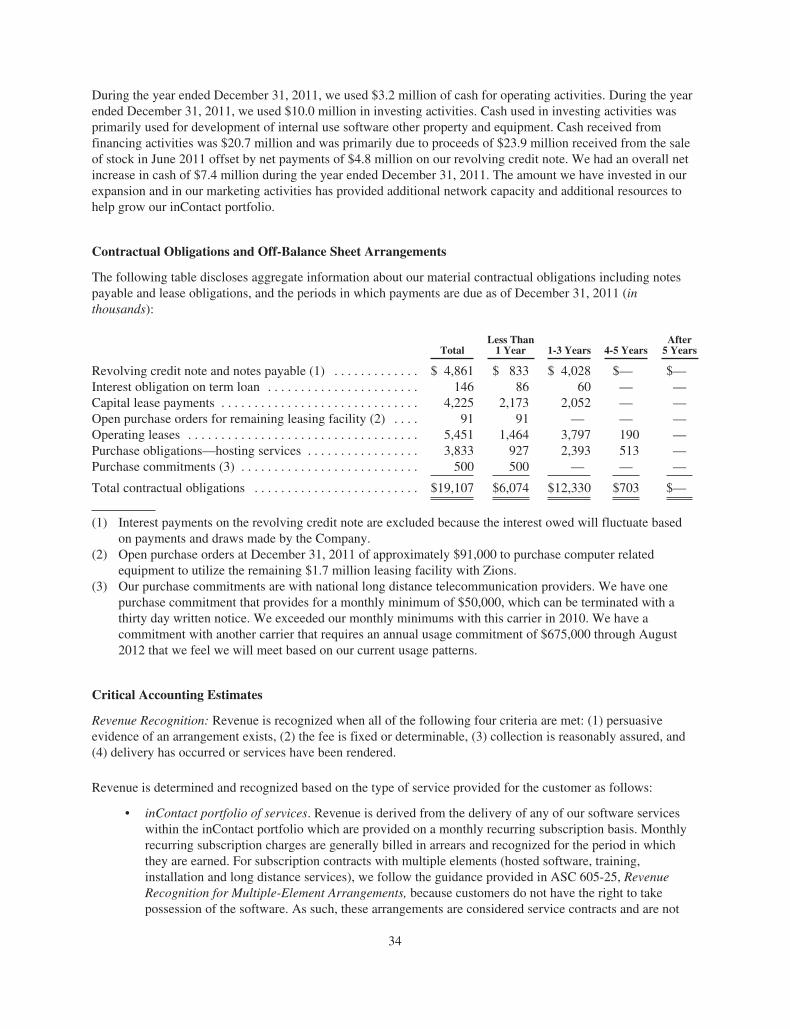
During the year ended December 31, 2011, we used $3.2 million of cash for operating activities. During the yearended December 31, 2011, we used $10.0 million in investing activities. Cash used in investing activities wasprimarily used for development of internal use software other property and equipment. Cash received fromfinancing activities was $20.7 million and was primarily due to proceeds of $23.9 million received from the saleof stock in June 2011 offset by net payments of $4.8 million on our revolving credit note. We had an overall netincrease in cash of $7.4 million during the year ended December 31, 2011. The amount we have invested in ourexpansion and in our marketing activities has provided additional network capacity and additional resources tohelp grow our inContact portfolio.
Contractual Obligations and Off-Balance Sheet Arrangements
The following table discloses aggregate information about our material contractual obligations including notespayable and lease obligations, and the periods in which payments are due as of December 31, 2011 (inthousands):
TotalLess Than1 Year 1-3 Years 4-5 Years
After5 Years
Revolving credit note and notes payable (1) . . . . . . . . . . . . . $ 4,861 $ 833 $ 4,028 $— $—Interest obligation on term loan . . . . . . . . . . . . . . . . . . . . . . . 146 86 60 — —Capital lease payments . . . . . . . . . . . . . . . . . . . . . . . . . . . . . . 4,225 2,173 2,052 — —Open purchase orders for remaining leasing facility (2) . . . . 91 91 — — —Operating leases . . . . . . . . . . . . . . . . . . . . . . . . . . . . . . . . . . . 5,451 1,464 3,797 190 —Purchase obligations—hosting services . . . . . . . . . . . . . . . . . 3,833 927 2,393 513 —Purchase commitments (3) . . . . . . . . . . . . . . . . . . . . . . . . . . . 500 500 — — —
Total contractual obligations . . . . . . . . . . . . . . . . . . . . . . . . . $19,107 $6,074 $12,330 $703 $—
(1) Interest payments on the revolving credit note are excluded because the interest owed will fluctuate basedon payments and draws made by the Company.
(2) Open purchase orders at December 31, 2011 of approximately $91,000 to purchase computer relatedequipment to utilize the remaining $1.7 million leasing facility with Zions.
(3) Our purchase commitments are with national long distance telecommunication providers. We have onepurchase commitment that provides for a monthly minimum of $50,000, which can be terminated with athirty day written notice. We exceeded our monthly minimums with this carrier in 2010. We have acommitment with another carrier that requires an annual usage commitment of $675,000 through August2012 that we feel we will meet based on our current usage patterns.
Critical Accounting Estimates
Revenue Recognition: Revenue is recognized when all of the following four criteria are met: (1) persuasiveevidence of an arrangement exists, (2) the fee is fixed or determinable, (3) collection is reasonably assured, and(4) delivery has occurred or services have been rendered.
Revenue is determined and recognized based on the type of service provided for the customer as follows:
• inContact portfolio of services. Revenue is derived from the delivery of any of our software serviceswithin the inContact portfolio which are provided on a monthly recurring subscription basis. Monthlyrecurring subscription charges are generally billed in arrears and recognized for the period in whichthey are earned. For subscription contracts with multiple elements (hosted software, training,installation and long distance services), we follow the guidance provided in ASC 605-25, RevenueRecognition for Multiple-Element Arrangements, because customers do not have the right to takepossession of the software. As such, these arrangements are considered service contracts and are not
34
within the scope of Industry Topic 985, Software. In addition to the monthly recurring subscriptionrevenue, revenue is also derived on a non-recurring basis for professional services included inimplementing or improving a customer’s inContact portfolio experience. Because our professionalservices, such as training and installation, are not considered to have standalone value, we deferrevenue for upfront fees received for professional services in multiple element arrangements andrecognize such fees as revenue over the estimated life of the customer. Professional services soldseparately (i.e. not sold contemporaneously with the negotiation of a subscription contract) arerecognized as revenue over the period that services are provided. Fees for telecommunications servicesin multiple element arrangements with in the inContact portfolio are based on usage and are recognizedas revenue in the same manner as fees for telecommunications services discussed in the followingparagraph.
• Telecommunications services. Revenue is derived from telecommunications services, such as dedicatedtransport, switched long distance and data services. These services are provided over our network orthrough third party telecommunications providers. Our network is the backbone of our inContactportfolio and allows us to provide the all-in-one inContact solution. Revenue for thetelecommunications usage is derived based on customer specific rate plans and the customer’s callusage and is recognized in the period the call is initiated. Customers are also billed monthly charges inarrears and revenue is recognized for such charges over the billing period. If the billing period spansmore than one month, earned but unbilled revenues are recognized as revenue for incurred usage todate.
During the three months ended December 31, 2011, we determined that we had a sufficient amount of transactionhistory to estimate the life of a customer and began recognizing the revenue for upfront fees for professionalservices over the estimated life of a customer. Previously, we had recognized upfront fees for professionalservices over the life of the contract, as we did not have sufficient history with our customer base to estimatecustomer life. Therefore, prior to the fourth quarter of 2011, we used contract life as a proxy for customer life.This change in estimate was accounted for prospectively for all new and existing arrangements, and resulted inrecognizing approximately $200,000 less in revenue during the fourth quarter of 2011.
Accounts Receivable and Allowance for Uncollectible Accounts: Accounts receivable is composed of billedamounts as well as unbilled amounts for which revenue has been earned and recognized. The allowance foruncollectible accounts, an estimate of the amount of accounts receivable outstanding of which managementbelieves may be uncollectible, is determined each month principally based on the aging of receivables.Management reviews the current trends and aged receivables periodically and adjusts the estimated bad debtexpense to accrue for doubtful accounts as needed. An account is written off by management when deemeduncollectible, although collection efforts may continue.
Long-Lived Assets: We estimate the useful lives of long-lived assets in order to determine the amount ofdepreciation and amortization expense to be recorded during any reporting period. Depreciation and amortizationexpense is generally computed using the straight-line method over the estimated useful lives. Long-lived assetsconsist of property and equipment (computer equipment, software, furniture and equipment). We evaluate thecarrying value of long-lived assets when events or circumstances indicate the existence of a possible impairment.In our evaluation, we estimate the net undiscounted cash flows expected to be generated by the assets, andrecognize impairment when such cash flows will be less than carrying values.
Intangible Assets: We estimate the useful lives of intangibles, (which include acquired customer lists, patents andacquired technology), in order to determine the amount of amortization expense to be recorded during anyreporting period. We use an accelerated method to amortize customer lists acquired after 2004. Other intangiblesare amortized using the straight-line method. We test intangible assets for impairment annually or when events orcircumstances indicate the existence of a possible impairment. In our evaluation, we estimate the netundiscounted cash flows expected to be generated by the assets, and recognize impairment when such cash flows
35
will be less than carrying values. Events or circumstances that could indicate the existence of a possibleimpairment include obsolescence of the technology, an absence of market demand for the product, and/or thepartial or complete lapse of continuing technology rights protection.
Goodwill: We evaluate goodwill for impairment, at a minimum, on an annual basis on September 30 of each yearand whenever events and changes in circumstances suggest that the carrying amount may not be recoverableusing a two-step process. First, the fair values are estimated using a market-based valuation approach utilizing amultiple of revenues. Determining fair value requires the exercise of significant judgments, including judgmentsabout relevant revenue multiples of comparable companies. We have two reporting units (identified as oursegments, Telecom and Software). All of the goodwill of $4.1 million relates to the Software reporting unit.Therefore, only the carrying value of the Software reporting unit was evaluated. If the carrying value of theSoftware reporting unit exceeds its fair value, then the second step is performed, and an impairment charge isrecognized for the amount, if any, by which the carrying amount of goodwill exceeds its implied fair value. AtSeptember 30, 2011, the fair value of the Software reporting unit exceeded its carrying value so no impairmentcharge was recorded during the year ended December 31, 2011. There were no events or circumstances from thedate of our assessment through December 31, 2011 that would impact this assessment.
Income Taxes: All income tax amounts reflect the use of the asset and liability method. Under this method,deferred income tax assets and liabilities are determined based on the expected future income tax consequencesof temporary differences between the carrying amounts of assets and liabilities for financial and income taxreporting purposes. A valuation allowance is provided to offset deferred income tax assets if, based upon theavailable evidence, it is more likely than not that some or all of the deferred income tax assets will not berealized. To date, a valuation allowance has been recorded to eliminate the deferred income tax assets.Significant judgment is required in making this assessment, and it is difficult to predict when, if ever, ourassessment may conclude that the remaining portion of the deferred tax assets are realizable.
The amounts relating to taxes also consider the ultimate resolution of revenue agent reviews based on estimatesand assumptions. We believe we have adequately accounted for our uncertain tax positions; however, tax audits,changes in tax laws and other unforeseen matters may result in us owing additional taxes. Management believesthat our tax positions comply with applicable tax law and that we have adequately provided for these matters.However, to the extent the final tax outcome of these matters is different than our recorded amounts, we may berequired to adjust our tax amounts resulting in additional income tax expense or benefit in future periods.
Off -balance Sheet Arrangements: We have no off-balance sheet arrangements. However, we have purchasecommitments with two national long distance telecommunication providers and our operating leases.
Stock-based Compensation: We account for stock-based compensation in accordance with ASC 718-10,Compensation—Stock Compensation. ASC 718-10 requires measurement of compensation cost for equity-basedawards (i.e., stock options, warrants and restricted stock units) at fair value on date of grant and recognition ofthe fair value of compensation for awards expected to vest over the requisite service period.
We utilize the graded-vesting method, rather than a straight-line method, for recognizing compensation expenseas management believes this graded-vesting method more closely matches the expense to associated services.Under this method, nearly 60% of the compensation cost is expensed in the first year of a typical three-yearvesting term. The estimation of stock awards that will ultimately vest requires judgment, and to the extent actualresults differ from these estimates, such amounts will be recorded as an adjustment in the period estimates arerevised. Management considers many factors when estimating expected forfeitures, including types of awards,employee class, and historical experience. Actual results may differ substantially from these estimates.
Recent Accounting Pronouncements
See Note 1 of our Notes to Consolidated Financial Statements for information regarding the effect of newaccounting pronouncements on our financial statements.
36

ITEM 7A. QUANTITATIVE AND QUALITATIVE DISCLOSURES ABOUTMARKET RISK
Our cash and cash equivalents are invested with high-quality issuers and limit the amount of credit exposure toany one issuer. Due to the short-term nature of the cash equivalents, we believe that we are not subject to anymaterial interest rate risk as it relates to interest income.
Interest rates on some of our outstanding leases and revolving credit facility are variable so market fluctuations ininterest rate may increase our interest expense.
37
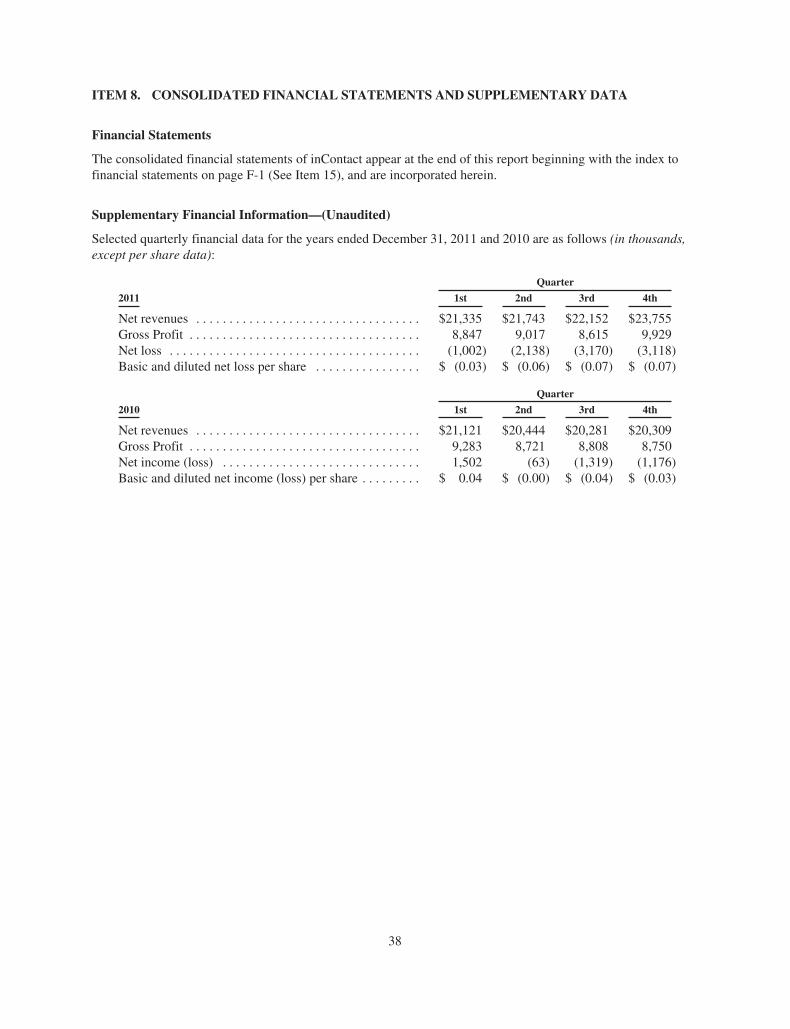
ITEM 8. CONSOLIDATED FINANCIAL STATEMENTS AND SUPPLEMENTARY DATA
Financial Statements
The consolidated financial statements of inContact appear at the end of this report beginning with the index tofinancial statements on page F-1 (See Item 15), and are incorporated herein.
Supplementary Financial Information—(Unaudited)
Selected quarterly financial data for the years ended December 31, 2011 and 2010 are as follows (in thousands,except per share data):
Quarter
2011 1st 2nd 3rd 4th
Net revenues . . . . . . . . . . . . . . . . . . . . . . . . . . . . . . . . . . $21,335 $21,743 $22,152 $23,755Gross Profit . . . . . . . . . . . . . . . . . . . . . . . . . . . . . . . . . . . 8,847 9,017 8,615 9,929Net loss . . . . . . . . . . . . . . . . . . . . . . . . . . . . . . . . . . . . . . (1,002) (2,138) (3,170) (3,118)Basic and diluted net loss per share . . . . . . . . . . . . . . . . $ (0.03) $ (0.06) $ (0.07) $ (0.07)
Quarter
2010 1st 2nd 3rd 4th
Net revenues . . . . . . . . . . . . . . . . . . . . . . . . . . . . . . . . . . $21,121 $20,444 $20,281 $20,309Gross Profit . . . . . . . . . . . . . . . . . . . . . . . . . . . . . . . . . . . 9,283 8,721 8,808 8,750Net income (loss) . . . . . . . . . . . . . . . . . . . . . . . . . . . . . . 1,502 (63) (1,319) (1,176)Basic and diluted net income (loss) per share . . . . . . . . . $ 0.04 $ (0.00) $ (0.04) $ (0.03)
38
ITEM 9. CHANGES IN AND DISAGREEMENTSWITH ACCOUNTANTS ON ACCOUNTING ANDFINANCIAL DISCLOSURE
None
ITEM 9A. CONTROLS AND PROCEDURES
This Report includes the certifications of our Chief Executive Officer and Chief Financial Officer required byRule 13a-14 of the Securities Exchange Act of 1934 (the “Exchange Act”). See Exhibits 31.1 and 31.2. ThisItem 9A includes information concerning the controls and control evaluations referred to in those certifications.
Evaluation of Disclosure Controls and Procedures
Disclosure controls and procedures (as defined in Rule 13a-15(e) under the Exchange Act) are designed to ensurethat information required to be disclosed in reports filed or submitted under the Exchange Act is recorded,processed, summarized, and reported within the time periods specified in rules and forms adopted by theSecurities and Exchange Commission (“SEC”), and that such information is accumulated and communicated tomanagement, including the chief executive officer and the chief financial officer, to allow timely decisionsregarding required disclosures.
In connection with the preparation of this report, inContact’s management, under the supervision and with theparticipation of the Chief Executive Officer and Chief Financial Officer, reassessed the effectiveness of thedesign and operation of our disclosure controls and procedures. Based on that evaluation, our Chief ExecutiveOfficer and Chief Financial Officer have concluded that, inContact’s disclosure controls and procedures wereeffective as of December 31, 2011.
Changes in Internal Control over Financial Reporting
There were no changes in our internal control over financial reporting that occurred during the fourth quarter of2011 that have materially affected, or are reasonably likely to materially affect, our internal control over financialreporting.
Management’s Report on Internal Control over Financial Reporting
The report called for by Item 308(a) of Regulation S-K is presented at the end of this report before theconsolidated financial statements and after the Index to Financial Statements on page F-1 (see Item 15).
Report of Independent Registered Public Accounting Firm
The report called for by Item 308(b) of Regulation S-K is presented at the end of this report before theconsolidated financial statements and after the Index to Financial Statements on page F-1 (see Item 15).
ITEM 9B. OTHER INFORMATION
None.
39
PART III
ITEM 10. DIRECTORS, EXECUTIVE OFFICERS AND CORPORATE GOVERNANCE
Information regarding Section 16(a) compliance, the Audit Committee, our code of ethics and background of ourdirectors will be presented in our Proxy Statement for the 2012 annual meeting of Shareholders and isincorporated herein by reference. The following information on our executive officers is presented belowpursuant to General Instructions G(3) of Form 10-K.
ITEM 11. Executive Compensation
Information required by this Item 11 on executive compensation will be presented in our 2012 Proxy Statementand is incorporated herein by reference.
ITEM 12. Security Ownership of Certain Beneficial Owners and Management and Related StockholderMatters
Information required by this Item 12 on security ownership of certain beneficial owners and managements willbe presented in our 2012 Proxy Statement and is incorporated herein by reference. Information regarding equitycompensation plans is presented under Item 5 of this report on Form 10-K.
ITEM 13. Certain Relationships and Related Transactions, and Director Independence
Information required by this Item 13 regarding certain related transactions and director independence will bepresented in our 2012 Proxy Statement and is incorporated herein by reference.
ITEM 14. Principal Accountant Fees and Services
Information required by this Item 14 will be presented in our 2012 Proxy Statement and is incorporated herein byreference.
40
PART IV
ITEM 15. EXHIBITS AND FINANCIAL STATEMENT SCHEDULES
Financial Statements and Schedule
Documents filed as part of this report:
(1) Financial Statements. The following consolidated financial statements and the notes thereto, and theReports of Independent Registered Public Accounting Firms are incorporated by reference as providedin Item 8 of this report:
Page
Management’s Report on Internal Control over Financial Reporting . . . . . . . . . . . . . . . . . . . . . . . . . . . . . . . F-2Reports of Independent Registered Public Accounting Firm . . . . . . . . . . . . . . . . . . . . . . . . . . . . . . . . . . . . . . F-3Consolidated Balance Sheets as of December 31, 2011 and 2010 . . . . . . . . . . . . . . . . . . . . . . . . . . . . . . . . . . F-5Consolidated Statements of Operations for the Years Ended December 31, 2011, 2010 and 2009 . . . . . . . . . F-6Consolidated Statements of Stockholders’ Equity for the Years Ended December 31, 2011, 2010 and2009 . . . . . . . . . . . . . . . . . . . . . . . . . . . . . . . . . . . . . . . . . . . . . . . . . . . . . . . . . . . . . . . . . . . . . . . . . . . . . . . . F-7
Consolidated Statements of Cash Flows for the Years Ended December 31, 2011, 2010 and 2009 . . . . . . . . F-8Notes to Consolidated Financial Statements . . . . . . . . . . . . . . . . . . . . . . . . . . . . . . . . . . . . . . . . . . . . . . . . . . . F-9Schedule II—Valuation and Qualifying Accounts . . . . . . . . . . . . . . . . . . . . . . . . . . . . . . . . . . . . . . . . . . . . . . F-32
Exhibits
Copies of the following documents are included as exhibits to this Form 10-K pursuant to Item 601 of RegulationS-K.
Exhibit No. Title of Document
3.1 Certificate of Incorporation, as amended (1)
3.2 Amendment to the Certificate of Incorporation dated June 26, 2004 (2)
3.3 Amendment to the Certificate of Incorporation dated October 14, 2008 (3)
3.4 ByLaws (4)
4.1 Investor Rights Agreement dated June 14, 2011, with Enterprise Networks Holdings, Inc. (19)
10.1 Long-Term Stock Incentive Plan (4)
10.2 2005 Employee Stock Purchase Plan (2)
10.3 Form of Stock Option Agreement used prior to June 1999 (5)
10.4 Form of Stock Option Agreement used after June 1999 (5)
10.5 Form of Warrant – inContact/ ComVest (6)
10.6 Form of Registration Rights Agreement—inContact/ComVest (6)
10.7 Form of Warrant covering 55,000 shares issued to ComVest Capital on February 9, 2007 (7)
10.8 Form of Stock Option Agreement for awards granted under the Annual Executive Stock OptionPlan (8)
10.9 Lease Agreement for Office Space at 7730 So Union Park Avenue, Salt Lake City, Utah 84047 (9)
10.10 Form of Notice of Restricted Stock Unit Grant to Non-Employee Directors (10)
10.11 Form of Restricted Stock Unit Award Agreement to Non-Employee Directors (10)
41

Exhibit No. Title of Document
10.12 Master Lease Agreement No. MCC1058 dated April 1, 2008 (11)
10.13 2008 Equity Incentive Plan (12)
10.14 Revolving Credit Loan Agreement between inContact and Zions dated July 16, 2009 (13)
10.15 Amendment to Loan Agreement between inContact and Zions dated February 22, 2010 (14)
10.16 Note Modification Agreement and Allonge between inContact and Zions dated August 3, 2010(15)
10.17 Second Amendment to Loan Agreement between inContact and Zions dated August 3, 2010 (16)
10.18 Second Note Modification Agreement and Allonge between inContact and Zions dated March 1,2011 (20)
10.19 Third Amendment to Loan Agreement between inContact and Zions dated March 1, 2011 (20)
10.20 Master Finance Lease Agreement No. 0012773 with Zions dated July 23, 2009 (20)
10.21 Form of Securities Purchase Agreement dated December 21, 2009 (17)
10.22 Form of Registration Rights Agreement dated December 21, 2009 (17)
10.23 Form of Common Stock Purchase Agreement dated June 14, 2011 (19)
10.24 Form of Registration Rights Agreement dated June 14, 2011 (19)
10.25 Fourth Amendment to Loan Agreement between inContact and Zions dated June 29, 2011 (21)
10.26 Master Reseller Agreement between inContact and Siemens (22)
10.27 Loan Agreement with Zions dated October 7, 2011
10.28 Promissory Note issued to Zions dated October 7, 2011
10.29 Guarantee Agreement by Siemens Enterprise Communications with Zions dated October 7, 2011
10.30 Security Transfer Agreement with Siemens Enterprise Communications dated October 7, 2011
10.31 First Amendment to Lease Agreement for Office Space at 7730 So Union Park Avenue, Salt LakeCity, Utah 84047
14.1 Code of Ethics (18)
21.1 List of Subsidiaries
23.1 Consent of Deloitte & Touche LLP, Independent Registered Public Accounting Firm
31.1 Certification of the Chief Executive Officer pursuant to Section 302 of the Sarbanes-Oxley Act of2002
31.2 Certification of the Chief Financial Officer pursuant to Section 302 of the Sarbanes-Oxley Act of2002
32.1 Certification of the Chief Executive Officer pursuant to Section 906 of the Sarbanes-Oxley Act of2002
32.2 Certifications of the Chief Financial Officer pursuant to Section 906 of the Sarbanes-Oxley Act of2002
42
Exhibit No. Title of Document
101 The following financial statements, formatted in XBRL: (i) Consolidated Balance Sheets as ofDecember 31, 2011 and December 31, 2010, (ii) Consolidated Statements of Operations for theyears ended December 31, 2011, 2010 and 2009, (iii) Consolidated Statements of Cash Flows foryears ended December 31, 2011, 2010 and 2009; (iv) Consolidated Statements of Stockholders’Equity for the years ended December 31, 2011, 2010 and 2009 and (iv) Notes to the CondensedConsolidated Financial Statements, tagged as blocks of text. The information in Exhibit 101 is“furnished” and not “filed,” as provided in Rule 402 of Regulation S-T.
(1) This document was filed as an exhibits to the annual report on Form 10-KSB for 2003 filed by inContactwith the Securities and Exchange Commission on March 30, 2004, and is incorporated herein by thisreference.
(2) These documents were filed as exhibits to the annual report on Form 10-K for 2004 filed by inContact withthe Securities and Exchange Commission on March 30, 2005, and are incorporated herein by this reference.
(3) This document was filed as an exhibit to the quarterly report on Form 10-Q filed by inContact with theSecurities and Exchange Commission on November 10, 2008, and is incorporated herein by this reference.
(4) These documents were filed as exhibits to the Registration Statement on Form 10-SB filed by inContactwith the Securities and Exchange Commission on August 3, 1999, and are incorporated herein by thisreference.
(5) These documents were filed as exhibits to the Registration Statement on Form SB-2, File No. 108655,initially filed by inContact with the Securities and Exchange Commission on September 9, 2003, and areincorporated herein by this reference.
(6) These documents were filed as exhibits to the current report on Form 8-K filed by inContact with theSecurities and Exchange Commission on May 5, 2006, and are incorporated herein by this reference. Eachof the form documents were signed and exchanged by inContact and ComVest Capital on May 23, 2006.
(7) This document was filed as an exhibit to the current report on Form 8-K filed by inContact with theSecurities and Exchange Commission on January 31, 2007, and is incorporated herein by this reference.
(8) This document was filed as an exhibit to the current report on Form 8-K filed by inContact with theSecurities and Exchange Commission on March 13, 2007, and is incorporated herein by this reference.
(9) This document was filed as an exhibit to the annual report on Form 10-K for 2007 filed by inContact withthe Securities and Exchange Commission on April 1, 2008, and are incorporated herein by this reference.
(10) These documents were filed as exhibits to the quarterly report on Form 10-Q filed by inContact with theSecurities and Exchange Commission on November 10, 2008, and are incorporated herein by this reference.
(11) This document was filed as an exhibit to the current report on Form 8-K filed by inContact with theSecurities and Exchange Commission on April 11, 2008, and is incorporated herein by this reference.
(12) This document was filed as an exhibit to the current report on Form 8-K filed by inContact with theSecurities and Exchange Commission on June 6, 2008, and is incorporated herein by this reference.
(13) This document was filed as an exhibit to the current report on Form 8-K filed by inContact with theSecurities and Exchange Commission on July 21, 2009, and is incorporated herein by this reference.
(14) This document was filed as an exhibit to the current report on Form 8-K filed by inContact with theSecurities and Exchange Commission on February 25, 2010, and is incorporated herein by this reference.
(15) This document was filed as an exhibit to the quarterly report on Form 10-Q filed by inContact with theSecurities and Exchange Commission on August 6, 2010, and is incorporated herein by this reference.
(16) This document was filed as an exhibit to the quarterly report on Form 10-Q filed by inContact with theSecurities and Exchange Commission on August 6, 2010, and is incorporated herein by this reference.
(17) These documents were filed as an exhibit to the current report on Form 8-K filed by inContact with theSecurities and Exchange Commission on December 21, 2009, and are incorporated herein by this reference.
(18) This document was filed as an exhibit to the current report on Form 8-K filed by inContact with theSecurities and Exchange Commission on June 12, 2007, and is incorporated herein by this reference.
(19) These documents were filed as an exhibit to the current report on Form 8-K filed by inContact with theSecurities and Exchange Commission on June 15, 2011, and are incorporated herein by this reference.
43

(20) These documents were filed as an exhibit to the annual report on Form 10-K for 2010 filed by inContactwith the Securities and Exchange Commission on March 11, 2011, and are incorporated herein by thisreference.
(21) This document was filed as an exhibit to the current report on Form 8-K filed by inContact with theSecurities and Exchange Commission on June 30, 2011, and is incorporated herein by this reference.
(22) This document was filed as an exhibit to the quarterly report on Form 10-Q filed by inContact with theSecurities and Exchange Commission on August 5, 2011, and is incorporated herein by this reference.Confidential portions were omitted pursuant to a confidential treatment request filed separately with theSEC
44
SIGNATURES
Pursuant to the requirements of Section 13 or 15(d) of the Securities Exchange Act of 1934, the registranthas duly caused this report to be signed on its behalf by the undersigned, thereunto duly authorized.
INCONTACT, INC.
Date: March 9, 2012 /S/ PAUL JARMAN
Paul JarmanChief Executive Officer
(Principal Executive Officer)
Date: March 9, 2012 /S/ GREGORY S. AYERS
Gregory S. AyersChief Financial Officer
(Principal Financial and Accounting Officer)
Pursuant to the requirements of the Securities Exchange Act of 1934, this report has been signed below by thefollowing persons on behalf of the registrant and in the capacities and on the dates indicated.
Date: March 9, 2012 /S/ THEODORE STERNTheodore Stern, Director
Date: March 9, 2012 /S/ STEVE M. BARNETT
Steve M. Barnett, Director
Date: March 9, 2012 /S/ PAUL JARMAN
Paul Jarman, Director
Date: March 9, 2012 /S/ BLAKE O. FISHERBlake O. Fisher, Director
Date: March 9, 2012 /S/ PAUL F. KOEPPE
Paul F. Koeppe, Director
Date: March 9, 2012 /S/ MARK J. EMKJER
Mark J. Emkjer, Director
Date: March 9, 2012 /S/ HAMID AKHAVAN
Hamid Akhavan, Director
45
INCONTACT, INC.
Consolidated Financial Statements
TABLE OF CONTENTS
Page
Management’s Report on Internal Control over Financial Reporting . . . . . . . . . . . . . . . . . . . . . . . . . . . . . . . F-2Reports of Independent Registered Public Accounting Firm . . . . . . . . . . . . . . . . . . . . . . . . . . . . . . . . . . . . . F-3Consolidated Balance Sheets as of December 31, 2011 and 2010 . . . . . . . . . . . . . . . . . . . . . . . . . . . . . . . . . F-5Consolidated Statements of Operations for the Years Ended December 31, 2011, 2010 and 2009 . . . . . . . . F-6Consolidated Statements of Stockholders’ Equity for the Years Ended December 31, 2011, 2010 and2009 . . . . . . . . . . . . . . . . . . . . . . . . . . . . . . . . . . . . . . . . . . . . . . . . . . . . . . . . . . . . . . . . . . . . . . . . . . . . . . . F-7
Consolidated Statements of Cash Flows for the Years Ended December 31, 2011, 2010 and 2009 . . . . . . . F-8Notes to Consolidated Financial Statements . . . . . . . . . . . . . . . . . . . . . . . . . . . . . . . . . . . . . . . . . . . . . . . . . . F-9Schedule II—Valuation and Qualifying Accounts . . . . . . . . . . . . . . . . . . . . . . . . . . . . . . . . . . . . . . . . . . . . . F-32
F-1

MANAGEMENT’S REPORT ON INTERNAL CONTROL OVER FINANCIAL REPORTING
Our management is responsible for establishing and maintaining adequate internal control over financialreporting, as defined in Exchange Act Rule 13a-15(f). Our internal control over financial reporting includes thosepolicies and procedures that (i) pertain to the maintenance of records that, in reasonable detail, accurately andfairly reflect our transactions and dispositions of our assets; (ii) provide reasonable assurance that transactionsare recorded as necessary to permit preparation of financial statements in accordance with accounting principlesgenerally accepted in the United States of America, and that our receipts and expenditures are being made only inaccordance with authorizations of our management and directors; and (iii) provide reasonable assuranceregarding prevention or timely detection of unauthorized acquisition, use, or disposition of our assets that couldhave a material effect on the financial statements.
Internal control over financial reporting is designed to provide reasonable assurance to our management andBoard of Directors regarding the preparation of reliable financial statements for external purposes in accordancewith generally accepted accounting principles. Internal control over financial reporting includes self-monitoringmechanisms and actions taken to correct deficiencies as they are identified. Because of the inherent limitations inany internal control, no matter how well designed, misstatements may occur and not be prevented or detected.Accordingly, even effective internal control over financial reporting can provide only reasonable assurance withrespect to financial statement preparation. Further, the evaluation of the effectiveness of internal control overfinancial reporting was made as of a specific date, and continued effectiveness in future periods is subject to therisks that controls may become inadequate because of changes in conditions or that the degree of compliancewith the policies and procedures may decline.
Management conducted an evaluation of the effectiveness of our internal control over financial reporting basedon the framework in Internal Control—Integrated Framework issued by the Committee of SponsoringOrganizations of the Treadway Commission. Based on this evaluation, management concluded that our internalcontrol over financial reporting was effective as of December 31, 2011. Management reviewed the results of theirassessment with our Audit Committee.
The effectiveness of our internal control over financial reporting as of December 31, 2011 has been audited byDeloitte & Touche LLP, an independent registered public accounting firm, as stated in their report which isincluded in Item 15 of this Annual Report on Form 10-K.
F-2
REPORT OF INDEPENDENT REGISTERED PUBLIC ACCOUNTING FIRM
To the Board of Directors and Stockholders of inContact, Inc.Salt Lake City, Utah
We have audited the internal control over financial reporting of inContact, Inc. and subsidiaries (the “Company”)as of December 31, 2011, based on criteria established in Internal Control—Integrated Framework issued by theCommittee of Sponsoring Organizations of the Treadway Commission. The Company’s management isresponsible for maintaining effective internal control over financial reporting and for its assessment of theeffectiveness of internal control over financial reporting, included in the accompanying Management’s Report onInternal Controls over Financial Reporting. Our responsibility is to express an opinion on the Company’s internalcontrol over financial reporting based on our audit.
We conducted our audit in accordance with the standards of the Public Company Accounting Oversight Board(United States). Those standards require that we plan and perform the audit to obtain reasonable assurance aboutwhether effective internal control over financial reporting was maintained in all material respects. Our auditincluded obtaining an understanding of internal control over financial reporting, assessing the risk that a materialweakness exists, testing and evaluating the design and operating effectiveness of internal control based on theassessed risk, and performing such other procedures as we considered necessary in the circumstances. We believethat our audit provides a reasonable basis for our opinion.
A company’s internal control over financial reporting is a process designed by, or under the supervision of, thecompany’s principal executive and principal financial officers, or persons performing similar functions, andeffected by the company’s board of directors, management, and other personnel to provide reasonable assuranceregarding the reliability of financial reporting and the preparation of financial statements for external purposes inaccordance with generally accepted accounting principles. A company’s internal control over financial reportingincludes those policies and procedures that (1) pertain to the maintenance of records that, in reasonable detail,accurately and fairly reflect the transactions and dispositions of the assets of the company; (2) provide reasonableassurance that transactions are recorded as necessary to permit preparation of financial statements in accordancewith generally accepted accounting principles, and that receipts and expenditures of the company are being madeonly in accordance with authorizations of management and directors of the company; and (3) provide reasonableassurance regarding prevention or timely detection of unauthorized acquisition, use, or disposition of thecompany’s assets that could have a material effect on the financial statements.
Because of the inherent limitations of internal control over financial reporting, including the possibility of collusionor improper management override of controls, material misstatements due to error or fraud may not be prevented ordetected on a timely basis. Also, projections of any evaluation of the effectiveness of the internal control overfinancial reporting to future periods are subject to the risk that the controls may become inadequate because ofchanges in conditions, or that the degree of compliance with the policies or procedures may deteriorate.
In our opinion, the Company maintained, in all material respects, effective internal control over financialreporting as of December 31, 2011, based on the criteria established in Internal Control—Integrated Frameworkissued by the Committee of Sponsoring Organizations of the Treadway Commission.
We have also audited, in accordance with the standards of the Public Company Accounting Oversight Board(United States), the consolidated financial statements and financial statement schedule as of and for the yearended December 31, 2011 of the Company and our report dated March 9, 2012 expressed an unqualified opinionon those financial statements and financial statement schedule.
/s/ DELOITTE & TOUCHE LLP
Salt Lake City, UtahMarch 9, 2012
F-3
REPORT OF INDEPENDENT REGISTERED PUBLIC ACCOUNTING FIRM
To the Board of Directors and Stockholders of inContact, Inc.Salt Lake City, Utah
We have audited the accompanying consolidated balance sheets of inContact, Inc. and subsidiaries (the“Company”) as of December 31, 2011 and 2010, and the related consolidated statements of operations,stockholders’ equity, and cash flows for each of the three years in the period ended December 31, 2011. Ouraudits also included the financial statement schedule II listed at Item 15(1). These consolidated financialstatements and financial statement schedule are the responsibility of the Company’s management. Ourresponsibility is to express an opinion on these consolidated financial statements and financial statement schedulebased on our audits.
We conducted our audits in accordance with the standards of the Public Company Accounting Oversight Board(United States). Those standards require that we plan and perform the audit to obtain reasonable assurance aboutwhether the financial statements are free of material misstatement. An audit includes examining, on a test basis,evidence supporting the amounts and disclosures in the financial statements. An audit also includes assessing theaccounting principles used and significant estimates made by management, as well as evaluating the overallfinancial statement presentation. We believe that our audits provide a reasonable basis for our opinion.
In our opinion, such consolidated financial statements present fairly, in all material respects, the financialposition of inContact, Inc. and subsidiaries as of December 31, 2011 and 2010, and the results of their operationsand their cash flows for each of the three years in the period ended December 31, 2011, in conformity withaccounting principles generally accepted in the United States of America. Also, in our opinion, such financialstatement schedule, when considered in relation to the basic consolidated financial statements taken as a whole,presents fairly, in all material respects, the information set forth therein.
We have also audited, in accordance with the standards of the Public Company Accounting Oversight Board(United States), the Company’s internal control over financial reporting as of December 31, 2011, based on thecriteria established in Internal Control—Integrated Framework issued by the Committee of SponsoringOrganizations of the Treadway Commission and our report dated March 9, 2012, expressed an unqualifiedopinion on the Company’s internal control over financial reporting.
/s/ DELOITTE & TOUCHE LLP
Salt Lake City, UtahMarch 9, 2012
F-4
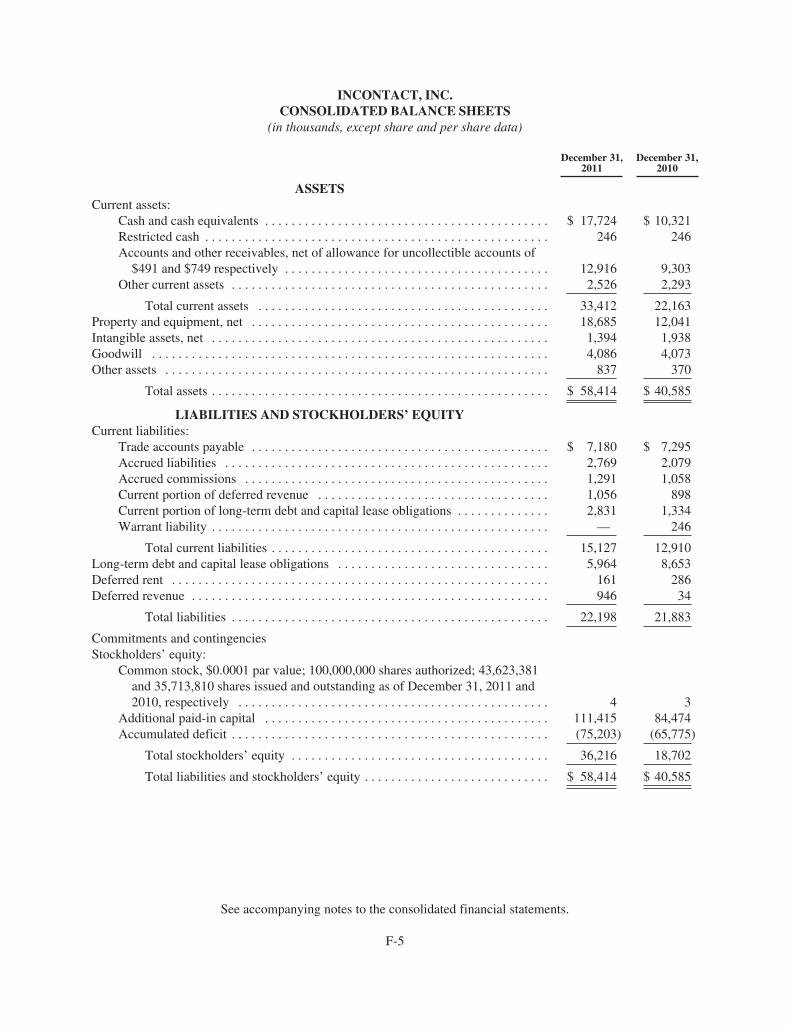
INCONTACT, INC.CONSOLIDATED BALANCE SHEETS
(in thousands, except share and per share data)
December 31,2011
December 31,2010
ASSETSCurrent assets:
Cash and cash equivalents . . . . . . . . . . . . . . . . . . . . . . . . . . . . . . . . . . . . . . . . . . . $ 17,724 $ 10,321Restricted cash . . . . . . . . . . . . . . . . . . . . . . . . . . . . . . . . . . . . . . . . . . . . . . . . . . . . 246 246Accounts and other receivables, net of allowance for uncollectible accounts of$491 and $749 respectively . . . . . . . . . . . . . . . . . . . . . . . . . . . . . . . . . . . . . . . . 12,916 9,303
Other current assets . . . . . . . . . . . . . . . . . . . . . . . . . . . . . . . . . . . . . . . . . . . . . . . . 2,526 2,293
Total current assets . . . . . . . . . . . . . . . . . . . . . . . . . . . . . . . . . . . . . . . . . . . . 33,412 22,163Property and equipment, net . . . . . . . . . . . . . . . . . . . . . . . . . . . . . . . . . . . . . . . . . . . . . 18,685 12,041Intangible assets, net . . . . . . . . . . . . . . . . . . . . . . . . . . . . . . . . . . . . . . . . . . . . . . . . . . . 1,394 1,938Goodwill . . . . . . . . . . . . . . . . . . . . . . . . . . . . . . . . . . . . . . . . . . . . . . . . . . . . . . . . . . . . 4,086 4,073Other assets . . . . . . . . . . . . . . . . . . . . . . . . . . . . . . . . . . . . . . . . . . . . . . . . . . . . . . . . . . 837 370
Total assets . . . . . . . . . . . . . . . . . . . . . . . . . . . . . . . . . . . . . . . . . . . . . . . . . . . $ 58,414 $ 40,585
LIABILITIES AND STOCKHOLDERS’ EQUITYCurrent liabilities:
Trade accounts payable . . . . . . . . . . . . . . . . . . . . . . . . . . . . . . . . . . . . . . . . . . . . . $ 7,180 $ 7,295Accrued liabilities . . . . . . . . . . . . . . . . . . . . . . . . . . . . . . . . . . . . . . . . . . . . . . . . . 2,769 2,079Accrued commissions . . . . . . . . . . . . . . . . . . . . . . . . . . . . . . . . . . . . . . . . . . . . . . 1,291 1,058Current portion of deferred revenue . . . . . . . . . . . . . . . . . . . . . . . . . . . . . . . . . . . 1,056 898Current portion of long-term debt and capital lease obligations . . . . . . . . . . . . . . 2,831 1,334Warrant liability . . . . . . . . . . . . . . . . . . . . . . . . . . . . . . . . . . . . . . . . . . . . . . . . . . . — 246
Total current liabilities . . . . . . . . . . . . . . . . . . . . . . . . . . . . . . . . . . . . . . . . . . 15,127 12,910Long-term debt and capital lease obligations . . . . . . . . . . . . . . . . . . . . . . . . . . . . . . . . 5,964 8,653Deferred rent . . . . . . . . . . . . . . . . . . . . . . . . . . . . . . . . . . . . . . . . . . . . . . . . . . . . . . . . . 161 286Deferred revenue . . . . . . . . . . . . . . . . . . . . . . . . . . . . . . . . . . . . . . . . . . . . . . . . . . . . . . 946 34
Total liabilities . . . . . . . . . . . . . . . . . . . . . . . . . . . . . . . . . . . . . . . . . . . . . . . . 22,198 21,883
Commitments and contingenciesStockholders’ equity:
Common stock, $0.0001 par value; 100,000,000 shares authorized; 43,623,381and 35,713,810 shares issued and outstanding as of December 31, 2011 and2010, respectively . . . . . . . . . . . . . . . . . . . . . . . . . . . . . . . . . . . . . . . . . . . . . . . 4 3
Additional paid-in capital . . . . . . . . . . . . . . . . . . . . . . . . . . . . . . . . . . . . . . . . . . . 111,415 84,474Accumulated deficit . . . . . . . . . . . . . . . . . . . . . . . . . . . . . . . . . . . . . . . . . . . . . . . . (75,203) (65,775)
Total stockholders’ equity . . . . . . . . . . . . . . . . . . . . . . . . . . . . . . . . . . . . . . . 36,216 18,702
Total liabilities and stockholders’ equity . . . . . . . . . . . . . . . . . . . . . . . . . . . . $ 58,414 $ 40,585
See accompanying notes to the consolidated financial statements.
F-5
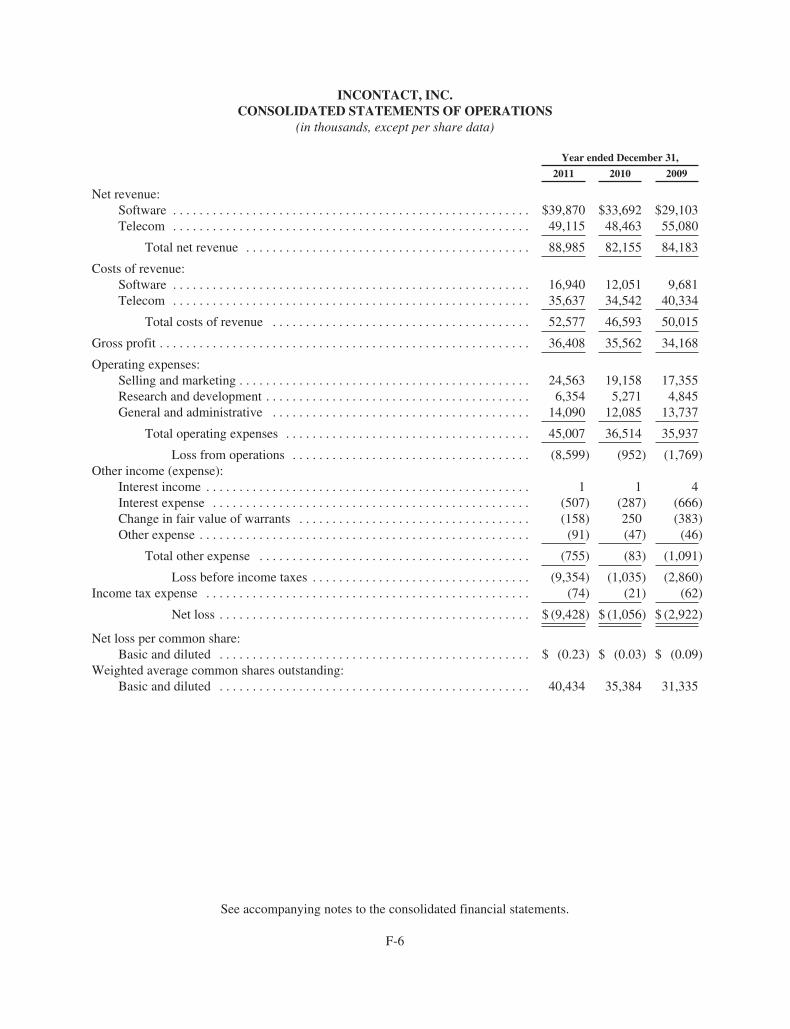
INCONTACT, INC.CONSOLIDATED STATEMENTS OF OPERATIONS
(in thousands, except per share data)
Year ended December 31,
2011 2010 2009
Net revenue:Software . . . . . . . . . . . . . . . . . . . . . . . . . . . . . . . . . . . . . . . . . . . . . . . . . . . . . . $39,870 $33,692 $29,103Telecom . . . . . . . . . . . . . . . . . . . . . . . . . . . . . . . . . . . . . . . . . . . . . . . . . . . . . . 49,115 48,463 55,080
Total net revenue . . . . . . . . . . . . . . . . . . . . . . . . . . . . . . . . . . . . . . . . . . . 88,985 82,155 84,183
Costs of revenue:Software . . . . . . . . . . . . . . . . . . . . . . . . . . . . . . . . . . . . . . . . . . . . . . . . . . . . . . 16,940 12,051 9,681Telecom . . . . . . . . . . . . . . . . . . . . . . . . . . . . . . . . . . . . . . . . . . . . . . . . . . . . . . 35,637 34,542 40,334
Total costs of revenue . . . . . . . . . . . . . . . . . . . . . . . . . . . . . . . . . . . . . . . 52,577 46,593 50,015
Gross profit . . . . . . . . . . . . . . . . . . . . . . . . . . . . . . . . . . . . . . . . . . . . . . . . . . . . . . . . 36,408 35,562 34,168
Operating expenses:Selling and marketing . . . . . . . . . . . . . . . . . . . . . . . . . . . . . . . . . . . . . . . . . . . . 24,563 19,158 17,355Research and development . . . . . . . . . . . . . . . . . . . . . . . . . . . . . . . . . . . . . . . . 6,354 5,271 4,845General and administrative . . . . . . . . . . . . . . . . . . . . . . . . . . . . . . . . . . . . . . . 14,090 12,085 13,737
Total operating expenses . . . . . . . . . . . . . . . . . . . . . . . . . . . . . . . . . . . . . 45,007 36,514 35,937
Loss from operations . . . . . . . . . . . . . . . . . . . . . . . . . . . . . . . . . . . . (8,599) (952) (1,769)Other income (expense):
Interest income . . . . . . . . . . . . . . . . . . . . . . . . . . . . . . . . . . . . . . . . . . . . . . . . . 1 1 4Interest expense . . . . . . . . . . . . . . . . . . . . . . . . . . . . . . . . . . . . . . . . . . . . . . . . (507) (287) (666)Change in fair value of warrants . . . . . . . . . . . . . . . . . . . . . . . . . . . . . . . . . . . (158) 250 (383)Other expense . . . . . . . . . . . . . . . . . . . . . . . . . . . . . . . . . . . . . . . . . . . . . . . . . . (91) (47) (46)
Total other expense . . . . . . . . . . . . . . . . . . . . . . . . . . . . . . . . . . . . . . . . . (755) (83) (1,091)
Loss before income taxes . . . . . . . . . . . . . . . . . . . . . . . . . . . . . . . . . (9,354) (1,035) (2,860)Income tax expense . . . . . . . . . . . . . . . . . . . . . . . . . . . . . . . . . . . . . . . . . . . . . . . . . (74) (21) (62)
Net loss . . . . . . . . . . . . . . . . . . . . . . . . . . . . . . . . . . . . . . . . . . . . . . . $ (9,428) $ (1,056) $ (2,922)
Net loss per common share:Basic and diluted . . . . . . . . . . . . . . . . . . . . . . . . . . . . . . . . . . . . . . . . . . . . . . . $ (0.23) $ (0.03) $ (0.09)
Weighted average common shares outstanding:Basic and diluted . . . . . . . . . . . . . . . . . . . . . . . . . . . . . . . . . . . . . . . . . . . . . . . 40,434 35,384 31,335
See accompanying notes to the consolidated financial statements.
F-6
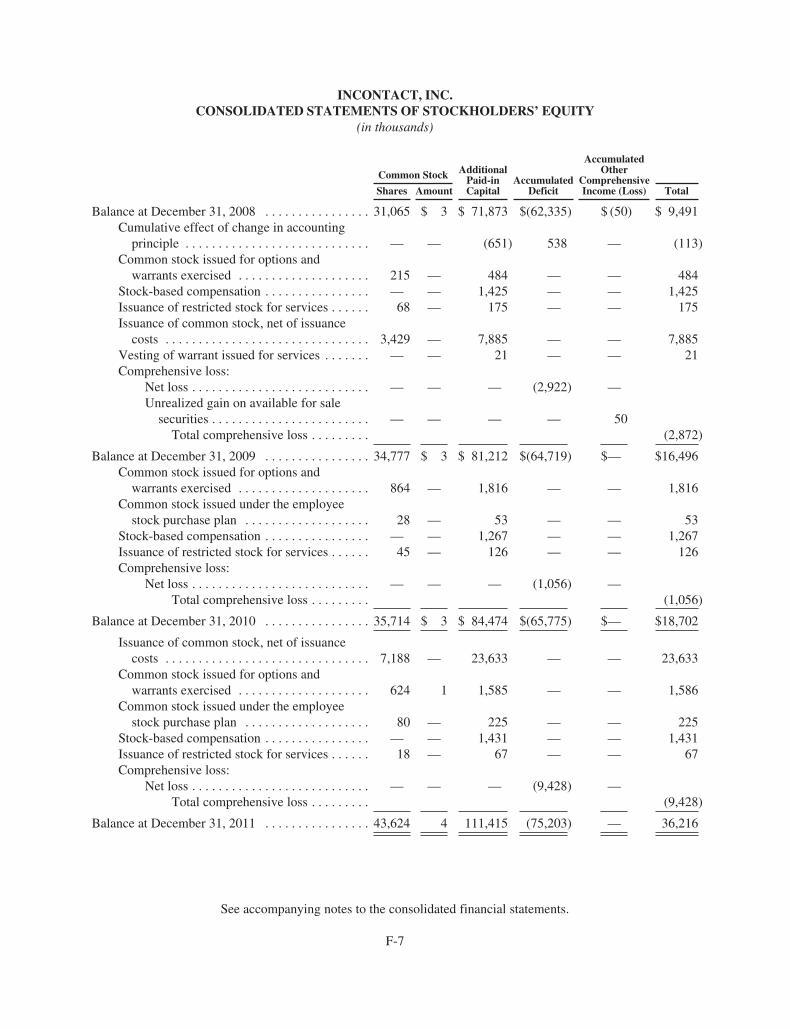
INCONTACT, INC.CONSOLIDATED STATEMENTS OF STOCKHOLDERS’ EQUITY
(in thousands)
Common Stock AdditionalPaid-inCapital
AccumulatedDeficit
AccumulatedOther
ComprehensiveIncome (Loss)Shares Amount Total
Balance at December 31, 2008 . . . . . . . . . . . . . . . . 31,065 $ 3 $ 71,873 $(62,335) $ (50) $ 9,491Cumulative effect of change in accountingprinciple . . . . . . . . . . . . . . . . . . . . . . . . . . . . — — (651) 538 — (113)
Common stock issued for options andwarrants exercised . . . . . . . . . . . . . . . . . . . . 215 — 484 — — 484
Stock-based compensation . . . . . . . . . . . . . . . . — — 1,425 — — 1,425Issuance of restricted stock for services . . . . . . 68 — 175 — — 175Issuance of common stock, net of issuancecosts . . . . . . . . . . . . . . . . . . . . . . . . . . . . . . . 3,429 — 7,885 — — 7,885
Vesting of warrant issued for services . . . . . . . — — 21 — — 21Comprehensive loss:
Net loss . . . . . . . . . . . . . . . . . . . . . . . . . . . — — — (2,922) —Unrealized gain on available for salesecurities . . . . . . . . . . . . . . . . . . . . . . . . — — — — 50Total comprehensive loss . . . . . . . . . (2,872)
Balance at December 31, 2009 . . . . . . . . . . . . . . . . 34,777 $ 3 $ 81,212 $(64,719) $— $16,496Common stock issued for options andwarrants exercised . . . . . . . . . . . . . . . . . . . . 864 — 1,816 — — 1,816
Common stock issued under the employeestock purchase plan . . . . . . . . . . . . . . . . . . . 28 — 53 — — 53
Stock-based compensation . . . . . . . . . . . . . . . . — — 1,267 — — 1,267Issuance of restricted stock for services . . . . . . 45 — 126 — — 126Comprehensive loss:
Net loss . . . . . . . . . . . . . . . . . . . . . . . . . . . — — — (1,056) —Total comprehensive loss . . . . . . . . . (1,056)
Balance at December 31, 2010 . . . . . . . . . . . . . . . . 35,714 $ 3 $ 84,474 $(65,775) $— $18,702
Issuance of common stock, net of issuancecosts . . . . . . . . . . . . . . . . . . . . . . . . . . . . . . . 7,188 — 23,633 — — 23,633
Common stock issued for options andwarrants exercised . . . . . . . . . . . . . . . . . . . . 624 1 1,585 — — 1,586
Common stock issued under the employeestock purchase plan . . . . . . . . . . . . . . . . . . . 80 — 225 — — 225
Stock-based compensation . . . . . . . . . . . . . . . . — — 1,431 — — 1,431Issuance of restricted stock for services . . . . . . 18 — 67 — — 67Comprehensive loss:
Net loss . . . . . . . . . . . . . . . . . . . . . . . . . . . — — — (9,428) —Total comprehensive loss . . . . . . . . . (9,428)
Balance at December 31, 2011 . . . . . . . . . . . . . . . . 43,624 4 111,415 (75,203) — 36,216
See accompanying notes to the consolidated financial statements.
F-7

INCONTACT, INC.CONSOLIDATED STATEMENTS OF CASH FLOWS
(in thousands)
Year ended December 31,
2011 2010 2009
Cash flows from operating activities:Net loss . . . . . . . . . . . . . . . . . . . . . . . . . . . . . . . . . . . . . . . . . . . . . . . . . . . . . . . . . . . . . . . . . . . . . . . . . . . $ (9,428) $ (1,056) $ (2,922)Adjustments to reconcile net loss to net cash (used in) from operating activities:
Depreciation of property and equipment . . . . . . . . . . . . . . . . . . . . . . . . . . . . . . . . . . . . . . . . . . . . . 3,504 2,959 2,850Amortization of software development costs . . . . . . . . . . . . . . . . . . . . . . . . . . . . . . . . . . . . . . . . . . 2,994 1,923 1,102Amortization of intangible assets . . . . . . . . . . . . . . . . . . . . . . . . . . . . . . . . . . . . . . . . . . . . . . . . . . . 544 563 983Amortization of note financing costs . . . . . . . . . . . . . . . . . . . . . . . . . . . . . . . . . . . . . . . . . . . . . . . . 61 95 91Interest accretion . . . . . . . . . . . . . . . . . . . . . . . . . . . . . . . . . . . . . . . . . . . . . . . . . . . . . . . . . . . . . . . 16 11 —Stock-based compensation . . . . . . . . . . . . . . . . . . . . . . . . . . . . . . . . . . . . . . . . . . . . . . . . . . . . . . . . 1,431 1,267 1,425Warrants and stock issued for services . . . . . . . . . . . . . . . . . . . . . . . . . . . . . . . . . . . . . . . . . . . . . . . 67 126 196Change in fair value of warrants . . . . . . . . . . . . . . . . . . . . . . . . . . . . . . . . . . . . . . . . . . . . . . . . . . . 158 (250) 383Loss on disposal of property and equipment . . . . . . . . . . . . . . . . . . . . . . . . . . . . . . . . . . . . . . . . . . 95 51 66Changes in operating assets and liabilities:
Accounts and other receivables, net . . . . . . . . . . . . . . . . . . . . . . . . . . . . . . . . . . . . . . . . . . . . . (3,522) (138) (989)Other current assets . . . . . . . . . . . . . . . . . . . . . . . . . . . . . . . . . . . . . . . . . . . . . . . . . . . . . . . . . (405) (535) (461)Other non-current assets . . . . . . . . . . . . . . . . . . . . . . . . . . . . . . . . . . . . . . . . . . . . . . . . . . . . . . (375) 148 (26)Trade accounts payable . . . . . . . . . . . . . . . . . . . . . . . . . . . . . . . . . . . . . . . . . . . . . . . . . . . . . . 2 1,037 (821)Accrued liabilities . . . . . . . . . . . . . . . . . . . . . . . . . . . . . . . . . . . . . . . . . . . . . . . . . . . . . . . . . . . 411 (730) 482Accrued commissions . . . . . . . . . . . . . . . . . . . . . . . . . . . . . . . . . . . . . . . . . . . . . . . . . . . . . . . 233 (78) (22)Deferred rent . . . . . . . . . . . . . . . . . . . . . . . . . . . . . . . . . . . . . . . . . . . . . . . . . . . . . . . . . . . . . . (88) (46) (63)Deferred revenue . . . . . . . . . . . . . . . . . . . . . . . . . . . . . . . . . . . . . . . . . . . . . . . . . . . . . . . . . . . 1,070 (287) (115)
Net cash (used in) from operating activities . . . . . . . . . . . . . . . . . . . . . . . . . . . . . . . . . . . (3,232) 5,060 2,159
Cash flows from investing activities:Gross increase in restricted cash . . . . . . . . . . . . . . . . . . . . . . . . . . . . . . . . . . . . . . . . . . . . . . . . . . . . . . . — — (246)Contingent purchase price payments . . . . . . . . . . . . . . . . . . . . . . . . . . . . . . . . . . . . . . . . . . . . . . . . . . . . (135) (430) (719)Proceeds from redemption of auction rate preferred securities . . . . . . . . . . . . . . . . . . . . . . . . . . . . . . . . — 125 150Payments made for deposits . . . . . . . . . . . . . . . . . . . . . . . . . . . . . . . . . . . . . . . . . . . . . . . . . . . . . . . . . . . (98) (64) —Proceeds from deposits . . . . . . . . . . . . . . . . . . . . . . . . . . . . . . . . . . . . . . . . . . . . . . . . . . . . . . . . . . . . . . . 181 30 —Capitalized software development costs . . . . . . . . . . . . . . . . . . . . . . . . . . . . . . . . . . . . . . . . . . . . . . . . . (4,753) (3,448) (3,622)Purchases of property and equipment . . . . . . . . . . . . . . . . . . . . . . . . . . . . . . . . . . . . . . . . . . . . . . . . . . . (5,217) (1,736) (1,024)
Net cash used in investing activities . . . . . . . . . . . . . . . . . . . . . . . . . . . . . . . . . . . . . . . . . (10,022) (5,523) (5,461)
Cash flows from financing activities:Proceeds from issuance of common stock . . . . . . . . . . . . . . . . . . . . . . . . . . . . . . . . . . . . . . . . . . . . . . . . 23,865 — 8,399Offering costs payments . . . . . . . . . . . . . . . . . . . . . . . . . . . . . . . . . . . . . . . . . . . . . . . . . . . . . . . . . . . . . . (32) — (514)Proceeds from exercise of options and warrants . . . . . . . . . . . . . . . . . . . . . . . . . . . . . . . . . . . . . . . . . . . 1,182 1,816 484Proceeds from sale of stock under employee stock purchase plan . . . . . . . . . . . . . . . . . . . . . . . . . . . . . . 225 53 —Principal payments on long-term debt and capital leases . . . . . . . . . . . . . . . . . . . . . . . . . . . . . . . . . . . . . (2,234) (1,937) (1,440)Borrowings under promissory note . . . . . . . . . . . . . . . . . . . . . . . . . . . . . . . . . . . . . . . . . . . . . . . . . . . . . 2,500 — —Debt financing fees . . . . . . . . . . . . . . . . . . . . . . . . . . . . . . . . . . . . . . . . . . . . . . . . . . . . . . . . . . . . . . . . . . (79) — (91)Borrowings under the revolving credit notes . . . . . . . . . . . . . . . . . . . . . . . . . . . . . . . . . . . . . . . . . . . . . . 12,730 20,500 12,420Payments under the revolving credit notes . . . . . . . . . . . . . . . . . . . . . . . . . . . . . . . . . . . . . . . . . . . . . . . . (17,500) (20,500) (9,200)
Net cash from (used in) financing activities . . . . . . . . . . . . . . . . . . . . . . . . . . . . . . . . . . . 20,657 (68) 10,058
Net increase (decrease) in cash and cash equivalents . . . . . . . . . . . . . . . . . . . . . . . . . . . 7,403 (531) 6,756Cash and cash equivalents at the beginning of the year . . . . . . . . . . . . . . . . . . . . . . . . . . . . . . . . . . . . . . . . . . 10,321 10,852 4,096
Cash and cash equivalents at the end of the year . . . . . . . . . . . . . . . . . . . . . . . . . . . . . . . . . . . . . . . . . . . . . . . $ 17,724 $ 10,321 $10,852
Supplemental cash flow information:Cash paid for interest . . . . . . . . . . . . . . . . . . . . . . . . . . . . . . . . . . . . . . . . . . . . . . . . . . . . . . . . . . . . . . . . $ 446 $ 208 $ 610Cash paid for taxes . . . . . . . . . . . . . . . . . . . . . . . . . . . . . . . . . . . . . . . . . . . . . . . . . . . . . . . . . . . . . . . . . . $ 28 $ 59 $ 50
Supplemental schedule of non-cash investing and financing activities:Unrealized gain on change in fair value of auction rate securities . . . . . . . . . . . . . . . . . . . . . . . . . . . . . . $ — $ — $ 50Payments due for property and equipment included in trade accounts payable . . . . . . . . . . . . . . . . . . . . 189 77 5Property and equipment and other assets financed with capital leases . . . . . . . . . . . . . . . . . . . . . . . . . . 3,311 1,556 1,479Contingent purchase price payments included in accounts payable . . . . . . . . . . . . . . . . . . . . . . . . . . . . — 122 56Cashless exercise of warrants . . . . . . . . . . . . . . . . . . . . . . . . . . . . . . . . . . . . . . . . . . . . . . . . . . . . . . . . . . 404 — —Equity issuance costs included in accrued liabilities . . . . . . . . . . . . . . . . . . . . . . . . . . . . . . . . . . . . . . . . 200 — —
See accompanying notes to the consolidated financial statements.
F-8
INCONTACT, INC.NOTES TO CONSOLIDATED FINANCIAL STATEMENTS
NOTE 1. DESCRIPTION OF THE COMPANY AND SUMMARY OF SIGNIFICANT ACCOUNTINGPOLICIES
Organization
We changed our name from UCN, Inc. to inContact, Inc. (“inContact,” “we,” “us,” “our,” or the “Company”) onJanuary 1, 2009. The accompanying consolidated financial statements and related footnotes refer to us asinContact for all years presented. We are incorporated in the state of Delaware.
We provide cloud-based contact center applications through our inContact® portfolio, an advanced contacthandling and performance management software application. “Cloud-based” is a term to refer to computing, datastorage and delivery of technology services through the Internet, which includes software-as-a-service (“SaaS”).Our services provide a variety of connectivity options for carrying inbound calls to our inContact portfolio orlinking agents to our inContact applications. We provide customers the ability to monitor agent effectivenessthrough our user survey tools and the ability to efficiently monitor their agent needs. We are also an aggregatorand provider of telecommunications services. We contract with a number of third party providers for the right toresell the various telecommunication services and products they provide, and then offer all of these services tothe customers. These services and products allow customers to buy only the telecommunications services theyneed, combine those services in a customized enhanced contact center package, receive one bill for thoseservices, and call a single point of contact if a service problem or billing issue arises.
Principles of Consolidation
The accompanying consolidated financial statements include the accounts of inContact and its wholly ownedsubsidiaries. All significant intercompany accounts and transactions have been eliminated upon consolidation.
Summary of Significant Accounting Policies
Use of Estimates in the Preparation of Financial Statements
The preparation of financial statements in conformity with accounting principles generally accepted in the UnitedStates of America requires management to make estimates and assumptions that affect the reported amounts ofassets and liabilities and disclosure of contingent assets and liabilities at the date of the financial statements andthe reported amounts of revenues and expenses during the reporting period. Actual results could differ from theseestimates. Significant estimates include unbilled revenue, the allowance for uncollectible accounts, attrition ratesused to determine the amortization rate and estimated useful lives of customer lists acquired, the estimatedcustomer life used to recognize revenue for professional services, and fair value calculations of the warrantliability and stock-based compensation.
Cash and Cash Equivalents
Cash and cash equivalents include money market funds, overnight deposits and other investments that are readilyconvertible into cash and have original maturities of three months or less. Cash equivalents are carried at cost,which approximates fair value.
Restricted Cash
Restricted cash consists of a letter of credit related to an equipment leasing facility (Note 6) and cash held ondeposit for credit card processing.
F-9
Accounts and Other Receivables and Allowance for Uncollectible Accounts
Accounts and other receivables are composed of billed amounts as well as unbilled amounts for which revenuehas been earned and recognized, net of an allowance for uncollectible amounts. Finance charges are assessed toaccounts once the amount owed is past due based on their specific terms. The allowance for uncollectibleaccounts is estimated by management and is based on specific information about customer accounts, past lossexperience and general economic conditions. An account is written off by management when deemeduncollectible, although collections efforts may continue.
Property and Equipment
Property and equipment are stated at cost, less accumulated depreciation. Major additions and improvements arecapitalized, while minor repairs and maintenance costs are expensed when incurred. Depreciation is computedusing the straight-line method over the estimated useful lives of the related assets as follows:
Asset Category Estimated Useful Lives
Computer equipment . . . . . . . 3 to 7 yearsComputer software . . . . . . . . 3 yearsInternal use software . . . . . . . 3 yearsFurniture and fixtures . . . . . . 3 to 7 yearsLeasehold improvements . . . Shorter of 7 years or remainder of lease term
We evaluate the carrying value of property and equipment whenever events or changes in circumstances indicatethat the related carrying amounts may not be recoverable. Measurement of the amount of an impairment, if any,typically requires various estimates and assumptions including cash flows directly attributable to the asset, theuseful life of the asset and residual value, if any. We did not record any impairment charges in relation to long-lived property and equipment during the years ended December 31, 2011, 2010 or 2009.
Internal Use Software
We capitalize certain costs incurred for the development of internal use software, which are included as internaluse software in property and equipment in the consolidated balance sheets. These costs include the costsassociated with coding, software configuration, upgrades and enhancements that are incurred during theapplication development stage. These costs, net of accumulated amortization, totaled $7.0 million and$6.7 million as of December 31, 2011 and 2010, respectively. Amortization of capitalized software costs was$3.0 million in 2011, $1.9 million in 2010 and $1.1 million in 2009.
Intangible Assets
Intangible assets consist of customer lists, patents, technology, trademarks, domain names and non-competeagreements. We estimate the useful lives of our acquired customer lists based on estimated attrition rates.Customer lists are generally amortized using an accelerated method over 24 to 120 months. Patents, technologyand non-compete agreements are amortized on a straight-line basis over their estimated useful lives, which rangefrom 24 to 96 months. Trademarks have indefinite lives, with the exception of one trademark that has a usefullife of 15 years.
We review our finite-lived intangible assets for indicators of impairment whenever events or changes incircumstances indicate that the carrying value may not be recoverable. When we determine that the carryingvalue of an intangible asset may not be recoverable, the related estimated future undiscounted cash flowsexpected to result from the use and eventual disposition of the asset are compared to the carrying value of theasset. If the sum of the estimated future undiscounted cash flows is less than the carrying amount, we record animpairment charge based on the difference between the carrying value of the asset and its fair value, which we
F-10
estimate based on discounted expected future net cash flows. Events or circumstances that could indicate theexistence of a possible impairment include obsolescence of the technology, an absence of market demand for theproduct, and/or continuing technology rights protection. Management believes the net carrying amount of ourlong-lived assets will be recovered by future cash flows generated by commercialization of the technologyrelated to the long-lived asset, and from cash flows generated from customer lists. We did not record anyimpairment charges in relation to long-lived intangible assets during the years ended December 31, 2011, 2010and 2009.
Goodwill and Indefinite-lived Intangible Assets
We evaluate goodwill and indefinite-lived intangible assets for impairment as of the end of the third quarter, andwhenever events and changes in circumstances suggest that the carrying amount may not be recoverable.Goodwill impairment is determined using a two-step process. The first step of the process is to compare the fairvalue of a reporting unit with its carrying amount, including goodwill. In performing the first step, we determinethe fair value of a reporting unit by using a market-based valuation approach utilizing a multiple of revenues.Determining fair value requires the exercise of significant judgments, including judgments about relevantrevenue multiples of comparable companies. If the fair value of a reporting unit exceeds its carrying amount,goodwill of the reporting unit is not impaired and the second step of the impairment test is not necessary. If thecarrying amount of a reporting unit exceeds its fair value, the second step of the goodwill impairment test isrequired to be performed to measure the amount of impairment loss, if any. The second step of the goodwillimpairment test compares the implied fair value of the reporting unit’s goodwill with the carrying amount of thatgoodwill. The implied fair value of goodwill is determined in the same manner as the amount of goodwillrecognized in a business combination. In other words, the estimated fair value of the reporting unit is allocated toall of the assets and liabilities of that unit (including any unrecognized intangible assets) as if the reporting unithad been acquired in a business combination and the fair value of the reporting unit was the purchase price paid.If the carrying amount of the reporting unit’s goodwill exceeds the implied fair value of that goodwill, animpairment loss is recognized in an amount equal to that excess.
The impairment test for other indefinite-lived intangible assets not subject to amortization involves a comparisonof the estimated fair value of the intangible asset with its carrying value. If the carrying value of the intangibleasset exceeds its fair value, an impairment loss is recognized in an amount equal to that excess. The estimates offair value of intangible assets not subject to amortization are determined using a discounted cash flow (“DCF”)valuation analysis. The DCF methodology used to value indefinite-lived intangibles entails identifying theprojected discrete cash flows related to such intangibles and discounting them back to the valuation date.Significant judgments inherent in this analysis include the determination of discount rates, cash flows attributableto the intangibles and the terminal growth rates. Discount rate assumptions are based on an assessment of the riskinherent in the future cash flows generated as a result of the respective intangible assets.
Upon completion of the impairment test as of September 30, 2011, no indication of goodwill impairment existed.There were no events or circumstances from the date of assessment through December 31, 2011 that wouldimpact this assessment.
Off-Balance Sheet Arrangements
We have no off-balance sheet arrangements. However, we have purchase commitments with two national longdistance telecommunication providers and operating leases (Note 13).
Revenue Recognition
Revenue is recognized when all of the following four criteria are met: (1) persuasive evidence of an arrangementexists, (2) the fee is fixed or determinable, (3) collection is reasonably assured, and (4) delivery has occurred orservices have been rendered.
F-11
Revenue is determined and recognized based on the type of service provided for the customer as follows:
• inContact portfolio of services. Revenue is derived from the delivery of any of our software serviceswithin the inContact portfolio which are provided on a monthly recurring subscription basis. Monthlyrecurring subscription charges are generally billed in arrears and recognized for the period in whichthey are earned. For subscription contracts with multiple elements (hosted software, training,installation and long distance services), we follow the guidance provided in ASC 605-25, RevenueRecognition for Multiple-Element Arrangements, because customers do not have the right to takepossession of the software. As such, these arrangements are considered service contracts and are notwithin the scope of Industry Topic 985, Software. In addition to the monthly recurring subscriptionrevenue, revenue is also derived on a non-recurring basis for professional services included inimplementing or improving a customer’s inContact portfolio experience. Because our professionalservices, such as training and installation, are not considered to have standalone value, we deferrevenue for upfront fees received for professional services in multiple element arrangements andrecognize such fees as revenue over the estimated life of the customer. Professional services soldseparately (i.e. not sold contemporaneously with the negotiation of a subscription contract) arerecognized as revenue over the period that services are provided. Fees for telecommunications servicesin multiple element arrangements with in the inContact portfolio are based on usage and are recognizedas revenue in the same manner as fees for telecommunications services discussed in the followingparagraph.
• Telecommunications services. Revenue is derived from telecommunications services, such as dedicatedtransport, switched long distance and data services. These services are provided over our network orthrough third party telecommunications providers. Our network is the backbone of our inContactportfolio and allows us to provide the all-in-one inContact solution. Revenue for thetelecommunications usage is derived based on customer specific rate plans and the customer’s callusage and is recognized in the period the call is initiated. Customers are also billed monthly charges inarrears and revenue is recognized for such charges over the billing period. If the billing period spansmore than one month, earned but unbilled revenues are recognized as revenue for incurred usage todate.
During the three months ended December 31, 2011, we determined that we had a sufficient amount of transactionhistory to estimate the life of a customer and began recognizing the revenue for upfront fees for professionalservices over the estimated life of a customer. Previously, we had recognized upfront fees for professionalservices over the life of the contract, as we did not have sufficient history with our customer base to estimatecustomer life. Therefore, prior to the fourth quarter of 2011, we used contract life as a proxy for customer life.This change in estimate was accounted for prospectively for all new and existing arrangements, and resulted inrecognizing approximately $200,000 less in revenue during the fourth quarter of 2011.
Advertising Costs
We advertise our services through the web, partners and trade journals. Costs associated with these advertisingefforts are expensed as incurred in selling and marketing expenses, and were approximately $1.3 million in 2011,$650,000 in 2010, and $46,000 in 2009.
Stock-Based Compensation
We measure compensation cost for equity-based awards (i.e. stock options, warrants and restricted stock units) atfair value on date of grant and recognize the fair value of compensation for awards expected to vest over therequisite service period.
We utilize the graded-vesting method, rather than the straight-line method, for recognizing compensationexpense as management believes the graded-vesting method more closely matches the expense to associatedservices. Under this method, approximately 60% of the compensation cost is expensed in the first year of a
F-12

typical three-year vesting term. The estimation of stock awards that will ultimately vest requires judgment, and tothe extent actual results differ from estimates, such amounts will be recorded as an adjustment in the periodestimates are revised. Management considers many factors when estimating expected forfeitures, including typesof awards, employee class and historical experience. Actual results may differ substantially from these estimates(Note 10).
Operating Leases
We lease office space under an operating lease agreement. The lease agreement contains rent holidays and rentescalation provisions. We record the total rent payable during the lease term on a straight-line basis over the termof the lease and record the difference between the rent paid and the straight-line rent as deferred rent.
Income Taxes
Income taxes are accounted for using the asset and liability method. Under this method, we recognize a liabilityor asset for the income tax consequences of all net operating loss and tax credit carryforwards and temporarydifferences between the tax bases of assets and liabilities and their reported amounts in the financial statementsthat will result in taxable or deductible amounts in future years when the reported amounts of the assets andliabilities are recovered or settled. These deferred income tax assets or liabilities are measured using the enactedtax rates that will be in effect when the differences are expected to reverse. Recognition of deferred tax assets islimited to amounts considered by management to be more likely than not of realization in future periods. AtDecember 31, 2011 and 2010, we have a full valuation allowance against our deferred tax assets. Significantjudgment is required in making this assessment, and it is difficult to predict when, if ever, our assessment mayconclude that the remaining portion of the deferred tax assets are realizable.
Our policy is to recognize interest and penalties accrued on any unrecognized tax benefits as a component ofincome tax expense.
Comprehensive Loss
Comprehensive loss is reported in the consolidated statement of shareholders’ equity as a component of retainedearnings and consists of net loss and other gains and losses affecting shareholders’ equity that, under generallyaccepted accounting principles are excluded from net loss.
Net Loss Per Common Share
Basic net income (loss) per common share (“Basic EPS”) excludes dilution and is computed by dividing netincome (loss) by the weighted average number of common shares outstanding during the year. Diluted netincome (loss) per common share (“Diluted EPS”) reflects the potential dilution that could occur if stock optionsor other common stock equivalents were exercised or converted into common stock. In periods of net loss,common stock equivalents are excluded from the Diluted EPS computation, because they are antidilutive.Therefore, Diluted EPS equals Basic EPS for all years presented in the consolidated statements of operations inthe accompanying consolidated financial statements.
Fair Value Measurements
The accounting guidance for fair value measurements defines fair value, establishes a market-based frameworkor hierarchy for measuring fair value and expands disclosures about fair value measurements. The guidance isapplicable whenever assets and liabilities are measured and included in the financial statements at fair value. Thefair value of a financial instrument is the amount that could be received upon the sale of an asset or paid totransfer a liability in an orderly transaction between market participants at the measurement date. The guidancealso requires disclosure about how fair value is determined for assets and liabilities and establishes a hierarchyfor which these assets and liabilities must be grouped, based on significant levels of inputs.
F-13
Liquidity
Our principal sources of liquidity are cash and cash equivalents and available borrowings under our revolvingcredit note, which expires in July 2013. At December 31, 2011, we had $17.7 million of cash and cashequivalents. In addition to our $17.7 million of cash and cash equivalents, we have access to additional availableborrowings under our revolving credit facility, subject to meeting our covenant requirements. The availableborrowings under the revolving credit facility at December 31, 2011 are $5.8 million, based on the maximumavailable advance amount calculated on the December 20, 2011 borrowing base certificate, resulting in total cashand additional availability under the revolving credit note of $23.5 million at December 31, 2011. The balance ofour revolving credit note at December 31, 2011 was $2.5 million and the proceeds were used to take advantage ofvendor discounts on early payment terms in December. In January 2012, we paid the outstanding balance on therevolving credit note of $2.5 million. The revolving credit note is collateralized by substantially all our assets.
In March 2011, we entered into an equipment leasing facility commitment with Zions Credit Corporation (“ZionsCredit”). Under the terms of the leasing facility commitment, Zions Credit has agreed to provide us withfinancing of up to $3.0 million to lease computer related equipment for our business operations, which ZionsCredit will lease to us in the form of a capital lease. The term of the facility is 36 months upon acceptance of theleased property by us. The calculated interest rate is subject to change based on the three year London InterBankOffered Rate (“LIBOR”) plus 4.5%. We had utilized $1.7 million of the leasing facility at December 31, 2011.
We believe that existing cash and cash equivalents, cash from operations, and available borrowings under ourrevolving credit note and equipment leasing facility commitment will be sufficient to meet our cash requirementsduring at least the next twelve months.
Concentration Risks
Approximately 40% and 60% of our costs of revenue for the years ended December 31, 2011 and 2010,respectively, was incurred from four telecommunication providers. Approximately 50% of our costs of revenuefor the year ended December 31, 2009 was incurred from three telecommunication providers. We owed $331,000and $1.6 million to these telecommunications providers at December 31, 2011 and 2010, respectively.
Recent Accounting Pronouncements
Effective January 1, 2011, the Company adopted the Financial Accounting Standards Board (“FASB”) revisedaccounting guidance related to revenue arrangements with multiple deliverables. The guidance applies to alldeliverables under contractual arrangements in which a vendor will perform multiple revenue-generatingactivities. The guidance addresses how arrangement consideration should be allocated to the separate units ofaccounting, when applicable. The new guidance retains the criteria when delivered items in a multiple-deliverable arrangement should be considered separate units of accounting, but it removes the previousseparation criterion that objective and reliable evidence of fair value of any undelivered items must exist for thedelivered items to be considered a separate unit or separate units of accounting. Adoption of this guidance did nothave a significant impact on the timing or amount of revenue recognized as we only have one unit of accountingfor our arrangements that contain both our inContact portfolio of services and professional services.
In June 2011, the FASB issued new guidance, which requires an entity to present the total of comprehensiveincome, the components of net income, and the components of other comprehensive income either in a singlecontinuous statement of comprehensive income, or in two separate but consecutive statements. The guidanceeliminates the option to present components of other comprehensive income as part of the statement of equity. Inaddition, in December 2011, the FASB issued an amendment to the accounting standard which defers therequirement to present components of reclassifications of other comprehensive income on the face of the incomestatement. The guidance will be effective for us beginning January 1, 2012. We have determined that theadoption of the guidance will not have a material effect on our operating results or financial position.
F-14
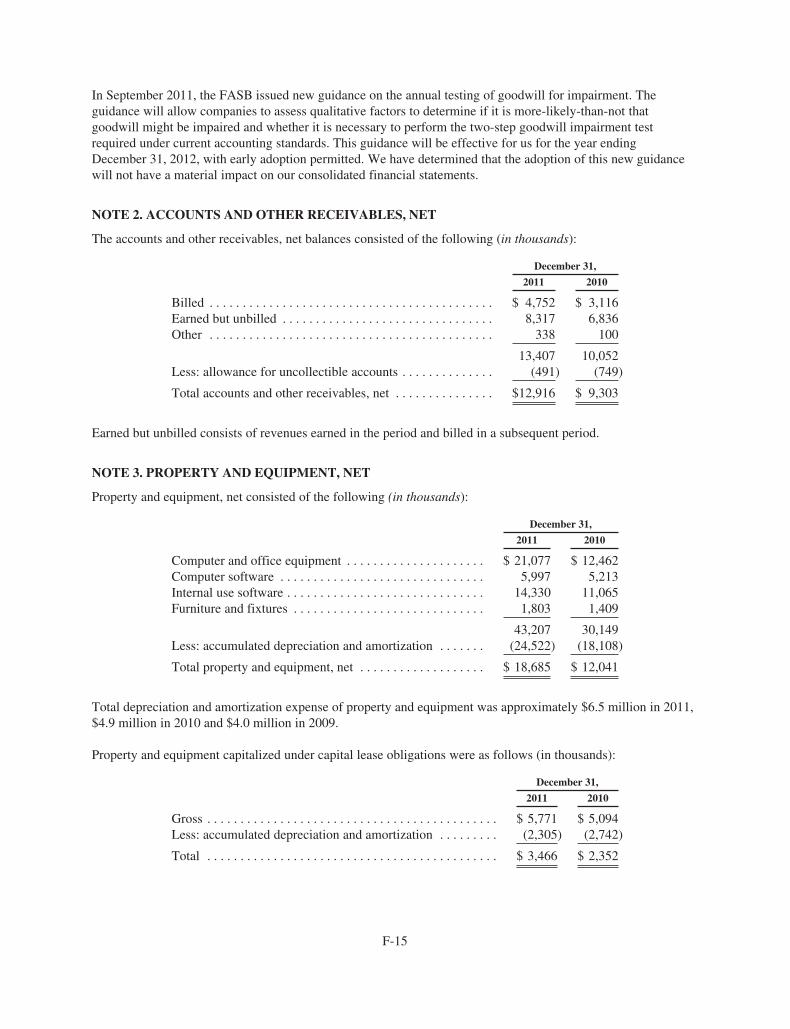
In September 2011, the FASB issued new guidance on the annual testing of goodwill for impairment. Theguidance will allow companies to assess qualitative factors to determine if it is more-likely-than-not thatgoodwill might be impaired and whether it is necessary to perform the two-step goodwill impairment testrequired under current accounting standards. This guidance will be effective for us for the year endingDecember 31, 2012, with early adoption permitted. We have determined that the adoption of this new guidancewill not have a material impact on our consolidated financial statements.
NOTE 2. ACCOUNTS AND OTHER RECEIVABLES, NET
The accounts and other receivables, net balances consisted of the following (in thousands):
December 31,
2011 2010
Billed . . . . . . . . . . . . . . . . . . . . . . . . . . . . . . . . . . . . . . . . . . . $ 4,752 $ 3,116Earned but unbilled . . . . . . . . . . . . . . . . . . . . . . . . . . . . . . . . 8,317 6,836Other . . . . . . . . . . . . . . . . . . . . . . . . . . . . . . . . . . . . . . . . . . . 338 100
13,407 10,052Less: allowance for uncollectible accounts . . . . . . . . . . . . . . (491) (749)
Total accounts and other receivables, net . . . . . . . . . . . . . . . $12,916 $ 9,303
Earned but unbilled consists of revenues earned in the period and billed in a subsequent period.
NOTE 3. PROPERTY AND EQUIPMENT, NET
Property and equipment, net consisted of the following (in thousands):
December 31,
2011 2010
Computer and office equipment . . . . . . . . . . . . . . . . . . . . . $ 21,077 $ 12,462Computer software . . . . . . . . . . . . . . . . . . . . . . . . . . . . . . . 5,997 5,213Internal use software . . . . . . . . . . . . . . . . . . . . . . . . . . . . . . 14,330 11,065Furniture and fixtures . . . . . . . . . . . . . . . . . . . . . . . . . . . . . 1,803 1,409
43,207 30,149Less: accumulated depreciation and amortization . . . . . . . (24,522) (18,108)
Total property and equipment, net . . . . . . . . . . . . . . . . . . . $ 18,685 $ 12,041
Total depreciation and amortization expense of property and equipment was approximately $6.5 million in 2011,$4.9 million in 2010 and $4.0 million in 2009.
Property and equipment capitalized under capital lease obligations were as follows (in thousands):
December 31,
2011 2010
Gross . . . . . . . . . . . . . . . . . . . . . . . . . . . . . . . . . . . . . . . . . . . . $ 5,771 $ 5,094Less: accumulated depreciation and amortization . . . . . . . . . (2,305) (2,742)
Total . . . . . . . . . . . . . . . . . . . . . . . . . . . . . . . . . . . . . . . . . . . . $ 3,466 $ 2,352
F-15
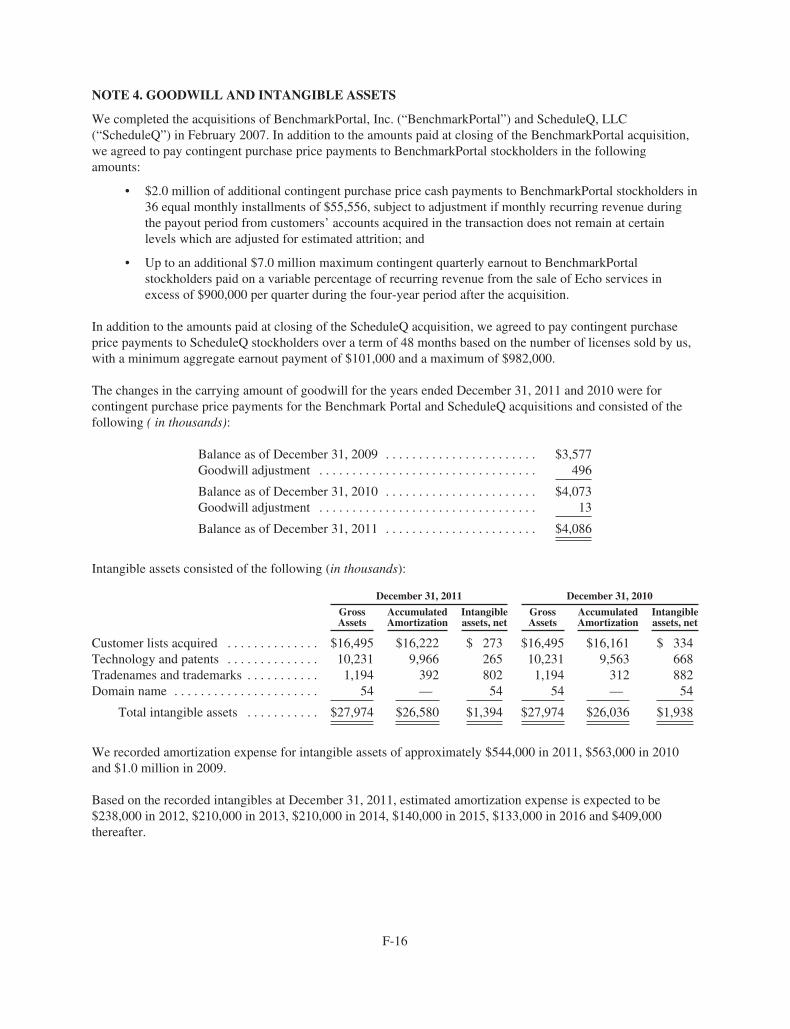
NOTE 4. GOODWILL AND INTANGIBLE ASSETS
We completed the acquisitions of BenchmarkPortal, Inc. (“BenchmarkPortal”) and ScheduleQ, LLC(“ScheduleQ”) in February 2007. In addition to the amounts paid at closing of the BenchmarkPortal acquisition,we agreed to pay contingent purchase price payments to BenchmarkPortal stockholders in the followingamounts:
• $2.0 million of additional contingent purchase price cash payments to BenchmarkPortal stockholders in36 equal monthly installments of $55,556, subject to adjustment if monthly recurring revenue duringthe payout period from customers’ accounts acquired in the transaction does not remain at certainlevels which are adjusted for estimated attrition; and
• Up to an additional $7.0 million maximum contingent quarterly earnout to BenchmarkPortalstockholders paid on a variable percentage of recurring revenue from the sale of Echo services inexcess of $900,000 per quarter during the four-year period after the acquisition.
In addition to the amounts paid at closing of the ScheduleQ acquisition, we agreed to pay contingent purchaseprice payments to ScheduleQ stockholders over a term of 48 months based on the number of licenses sold by us,with a minimum aggregate earnout payment of $101,000 and a maximum of $982,000.
The changes in the carrying amount of goodwill for the years ended December 31, 2011 and 2010 were forcontingent purchase price payments for the Benchmark Portal and ScheduleQ acquisitions and consisted of thefollowing ( in thousands):
Balance as of December 31, 2009 . . . . . . . . . . . . . . . . . . . . . . . $3,577Goodwill adjustment . . . . . . . . . . . . . . . . . . . . . . . . . . . . . . . . . 496
Balance as of December 31, 2010 . . . . . . . . . . . . . . . . . . . . . . . $4,073Goodwill adjustment . . . . . . . . . . . . . . . . . . . . . . . . . . . . . . . . . 13
Balance as of December 31, 2011 . . . . . . . . . . . . . . . . . . . . . . . $4,086
Intangible assets consisted of the following (in thousands):
December 31, 2011 December 31, 2010
GrossAssets
AccumulatedAmortization
Intangibleassets, net
GrossAssets
AccumulatedAmortization
Intangibleassets, net
Customer lists acquired . . . . . . . . . . . . . . $16,495 $16,222 $ 273 $16,495 $16,161 $ 334Technology and patents . . . . . . . . . . . . . . 10,231 9,966 265 10,231 9,563 668Tradenames and trademarks . . . . . . . . . . . 1,194 392 802 1,194 312 882Domain name . . . . . . . . . . . . . . . . . . . . . . 54 — 54 54 — 54
Total intangible assets . . . . . . . . . . . $27,974 $26,580 $1,394 $27,974 $26,036 $1,938
We recorded amortization expense for intangible assets of approximately $544,000 in 2011, $563,000 in 2010and $1.0 million in 2009.
Based on the recorded intangibles at December 31, 2011, estimated amortization expense is expected to be$238,000 in 2012, $210,000 in 2013, $210,000 in 2014, $140,000 in 2015, $133,000 in 2016 and $409,000thereafter.
F-16

NOTE 5. ACCRUED LIABILITIES
Accrued liabilities consisted of the following (in thousands):
December 31,
2011 2010
Accrued payphone and carrier charges . . . . . . . . . . . . . . . . . . . $ 342 $ 222Accrued payroll and other compensation . . . . . . . . . . . . . . . . . 1,895 1,204Accrued professional fees . . . . . . . . . . . . . . . . . . . . . . . . . . . . . — 284Current portion of deferred rent . . . . . . . . . . . . . . . . . . . . . . . . 150 112Other . . . . . . . . . . . . . . . . . . . . . . . . . . . . . . . . . . . . . . . . . . . . . 382 257
Total accrued liabilities . . . . . . . . . . . . . . . . . . . . . . . . . . . $2,769 $2,079
NOTE 6. LONG-TERM DEBT AND CAPITAL LEASE OBLIGATIONS
Long-term debt and capital lease obligations consisted of the following (in thousands):
December 31,
2011 2010
Revolving credit note with Zions First National Bank, with maximum availability of $8.5million, bearing interest at the 90 day LIBOR plus 4.5% (5.08% at December 31, 2011),requirement to repay outstanding principal balance in July 2013 . . . . . . . . . . . . . . . . . . . . . . $2,500 $ 7,270
Promissory note payable to Zions First National Bank, bearing interest at the 90 day LIBORplus 4.5% (5.08% at December 31, 2011), payable monthly with final principal paymentmade in October 2014 2,361 —
Promissory notes payable to former ScheduleQ, LLC shareholders, interest imputed at9.0% per annum, payable monthly, with final principal payments made in February2011 . . . . . . . . . . . . . . . . . . . . . . . . . . . . . . . . . . . . . . . . . . . . . . . . . . . . . . . . . . . . . . . . . . . . . — 2
Capital lease obligations . . . . . . . . . . . . . . . . . . . . . . . . . . . . . . . . . . . . . . . . . . . . . . . . . . . . . . . 3,968 2,734
Total debt and capital lease obligations . . . . . . . . . . . . . . . . . . . . . . . . . . . . . . . . . . . . . . . 8,829 10,006Debt discounts . . . . . . . . . . . . . . . . . . . . . . . . . . . . . . . . . . . . . . . . . . . . . . . . . . . . . . . . . . . (34) (19)
Net total debt and capital lease obligations . . . . . . . . . . . . . . . . . . . . . . . . . . . . . . . . . $8,795 $ 9,987
Current portion of debt . . . . . . . . . . . . . . . . . . . . . . . . . . . . . . . . . . . . . . . . . . . . . . . . . . . . . . . . $ 833 $ 2Current portion of capital lease obligations . . . . . . . . . . . . . . . . . . . . . . . . . . . . . . . . . . . . . . . . 2,010 1,351Current portion of debt discounts . . . . . . . . . . . . . . . . . . . . . . . . . . . . . . . . . . . . . . . . . . . . . . . . (12) (19)
Total current portion of debt and capital lease obligations . . . . . . . . . . . . . . . . . . . . . $2,831 $ 1,334
Long-term portion of debt . . . . . . . . . . . . . . . . . . . . . . . . . . . . . . . . . . . . . . . . . . . . . . . . . . . . . . $4,028 $ 7,270Long-term portion of capital lease obligations . . . . . . . . . . . . . . . . . . . . . . . . . . . . . . . . . . . . . . 1,958 1,383Long-term portion of debt discounts . . . . . . . . . . . . . . . . . . . . . . . . . . . . . . . . . . . . . . . . . . . . . . (22) —
Total long-term portion of debt and capital lease obligations . . . . . . . . . . . . . . . . . . $5,964 $ 8,653
Revolving Credit Note
On July 16, 2009, we entered into a revolving credit loan agreement (“Revolving Credit Agreement”) with ZionsFirst National Bank (“Zions”). Under the terms of the Revolving Credit Agreement, Zions agreed to loan up to$8.5 million under a revolving credit note. The Revolving Credit Agreement is collateralized by substantially allthe assets of inContact. The balance outstanding under the Revolving Credit Agreement cannot exceed the lesserof (a) $8.5 million or (b) the sum of 85% of eligible billed receivables, and 65% of eligible earned, but unbilledreceivables as calculated on the 5th and 20th of each month. There was $5.8 million of unused commitment atDecember 31, 2011, based on the maximum available advance amount calculated on the December 20, 2011borrowing base certificate.
F-17
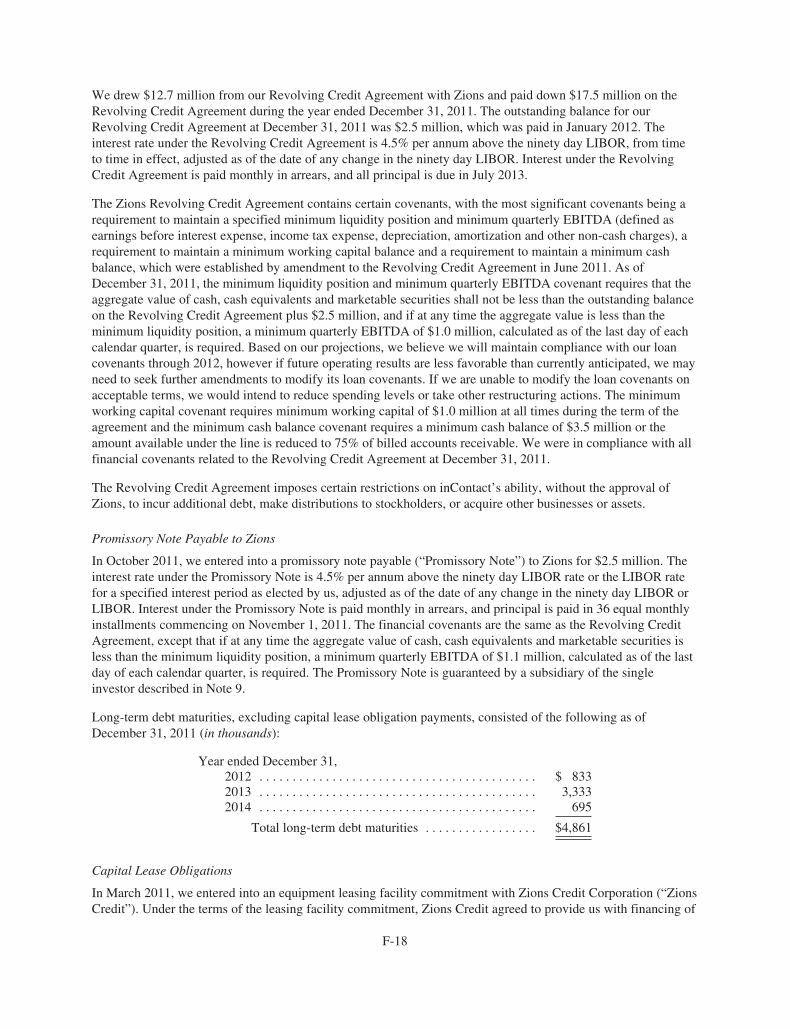
We drew $12.7 million from our Revolving Credit Agreement with Zions and paid down $17.5 million on theRevolving Credit Agreement during the year ended December 31, 2011. The outstanding balance for ourRevolving Credit Agreement at December 31, 2011 was $2.5 million, which was paid in January 2012. Theinterest rate under the Revolving Credit Agreement is 4.5% per annum above the ninety day LIBOR, from timeto time in effect, adjusted as of the date of any change in the ninety day LIBOR. Interest under the RevolvingCredit Agreement is paid monthly in arrears, and all principal is due in July 2013.
The Zions Revolving Credit Agreement contains certain covenants, with the most significant covenants being arequirement to maintain a specified minimum liquidity position and minimum quarterly EBITDA (defined asearnings before interest expense, income tax expense, depreciation, amortization and other non-cash charges), arequirement to maintain a minimum working capital balance and a requirement to maintain a minimum cashbalance, which were established by amendment to the Revolving Credit Agreement in June 2011. As ofDecember 31, 2011, the minimum liquidity position and minimum quarterly EBITDA covenant requires that theaggregate value of cash, cash equivalents and marketable securities shall not be less than the outstanding balanceon the Revolving Credit Agreement plus $2.5 million, and if at any time the aggregate value is less than theminimum liquidity position, a minimum quarterly EBITDA of $1.0 million, calculated as of the last day of eachcalendar quarter, is required. Based on our projections, we believe we will maintain compliance with our loancovenants through 2012, however if future operating results are less favorable than currently anticipated, we mayneed to seek further amendments to modify its loan covenants. If we are unable to modify the loan covenants onacceptable terms, we would intend to reduce spending levels or take other restructuring actions. The minimumworking capital covenant requires minimum working capital of $1.0 million at all times during the term of theagreement and the minimum cash balance covenant requires a minimum cash balance of $3.5 million or theamount available under the line is reduced to 75% of billed accounts receivable. We were in compliance with allfinancial covenants related to the Revolving Credit Agreement at December 31, 2011.
The Revolving Credit Agreement imposes certain restrictions on inContact’s ability, without the approval ofZions, to incur additional debt, make distributions to stockholders, or acquire other businesses or assets.
Promissory Note Payable to Zions
In October 2011, we entered into a promissory note payable (“Promissory Note”) to Zions for $2.5 million. Theinterest rate under the Promissory Note is 4.5% per annum above the ninety day LIBOR rate or the LIBOR ratefor a specified interest period as elected by us, adjusted as of the date of any change in the ninety day LIBOR orLIBOR. Interest under the Promissory Note is paid monthly in arrears, and principal is paid in 36 equal monthlyinstallments commencing on November 1, 2011. The financial covenants are the same as the Revolving CreditAgreement, except that if at any time the aggregate value of cash, cash equivalents and marketable securities isless than the minimum liquidity position, a minimum quarterly EBITDA of $1.1 million, calculated as of the lastday of each calendar quarter, is required. The Promissory Note is guaranteed by a subsidiary of the singleinvestor described in Note 9.
Long-term debt maturities, excluding capital lease obligation payments, consisted of the following as ofDecember 31, 2011 (in thousands):
Year ended December 31,2012 . . . . . . . . . . . . . . . . . . . . . . . . . . . . . . . . . . . . . . . . . . $ 8332013 . . . . . . . . . . . . . . . . . . . . . . . . . . . . . . . . . . . . . . . . . . 3,3332014 . . . . . . . . . . . . . . . . . . . . . . . . . . . . . . . . . . . . . . . . . . 695
Total long-term debt maturities . . . . . . . . . . . . . . . . . $4,861
Capital Lease Obligations
In March 2011, we entered into an equipment leasing facility commitment with Zions Credit Corporation (“ZionsCredit”). Under the terms of the leasing facility commitment, Zions Credit agreed to provide us with financing of
F-18

up to $3.0 million to lease computer related equipment for our business operations, which Zions Credit will leaseto us in the form of a capital lease. The term of the facility is 36 months upon acceptance of the leased propertyby us. The calculated interest rate is subject to change based on the three year LIBOR plus 4.5%. We had $1.7million of capital lease obligations related to this leasing facility at December 31, 2011 and $1.3 million of thisleasing facility had not been utilized at December 31, 2011. The final lease payments for the utilized portion ofthis facility will be in November 2014.
In February 2010, we entered into an equipment leasing facility with Zions Credit of up to $2.5 million. We haveutilized the entire $2.5 million of the leasing facility. The interest rate is 5.8% and the final lease payments willbe in December 2013. The balance of the capital lease obligations related to this leasing facility was $1.7 millionat December 31, 2011.
In June 2010, we entered into a capital lease obligation for certain software licensing, which required threeannual payments beginning in July 2010, totaling $536,000. The balance of the capital lease obligations related tothis lease was $177,000 at December 31, 2011.
In 2009, we entered into a commitment agreement with Zions Credit for an equipment leasing facility of up to$1.0 million. We had utilized the entire $1.0 million of the leasing facility as of December 31, 2009. The interestrate is 6.4% and the final lease payments will be in December 2012. The balance of the capital lease obligationsrelated to this leasing facility was $376,000 at December 31, 2011.
We entered into an equipment leasing facility with an equipment financing company (“Lessor”) in 2008. Underthe terms of the leasing facility, the Lessor agreed to provide us financing of $2.8 million to lease computerrelated equipment and software for our business operations, which the Lessor will lease to us in the form of acapital lease. The term of the facility was 30 months upon our acceptance of the leased property. The calculatedinterest rate is subject to change based on changes in the Treasury yield, installation period of the lease and theresidual value. We had utilized the full $2.8 million of the leasing facility at December 31, 2009 to acquirecomputer related equipment and software. During the year ended December 31, 2011, we extended the facility anadditional 12 months and paid $115,000 to the lessor so that the Company will receive title to the property leasedupon final payment of the extended lease in April 2012. The capital lease obligation related to the extension wasapproximately $69,000 at December 31, 2011 and no other amounts are due. Beginning January 1, 2009, we wererequired by the Lessor to provide a letter of credit equal to 30.0% of the $550,000 of additional borrowings madesubsequent to that date under the equipment leasing facility. Accordingly, we have classified the associated letterof credit balance of $166,000 as current restricted cash on the accompanying balance sheet at December 31,2011.
The following schedule shows the future minimum lease payments under capital lease obligations atDecember 31, 2011 (in thousands):
Year ended December 31,2012 . . . . . . . . . . . . . . . . . . . . . . . . . . . . . . . . . . . . . . . . . . $ 2,1732013 . . . . . . . . . . . . . . . . . . . . . . . . . . . . . . . . . . . . . . . . . . 1,4842014 . . . . . . . . . . . . . . . . . . . . . . . . . . . . . . . . . . . . . . . . . . 568
Total future minimum lease payments . . . . . . . . . . . 4,225Less amount representing interest . . . . . . . . . . . . . . . . . . . (257)
Total capital lease obligations . . . . . . . . . . . . . . . . . . 3,968Less current portion . . . . . . . . . . . . . . . . . . . . . . . . . . . . . (2,010)
Long-term capital lease obligations, net of currentportion . . . . . . . . . . . . . . . . . . . . . . . . . . . . . . . . . . $ 1,958
F-19
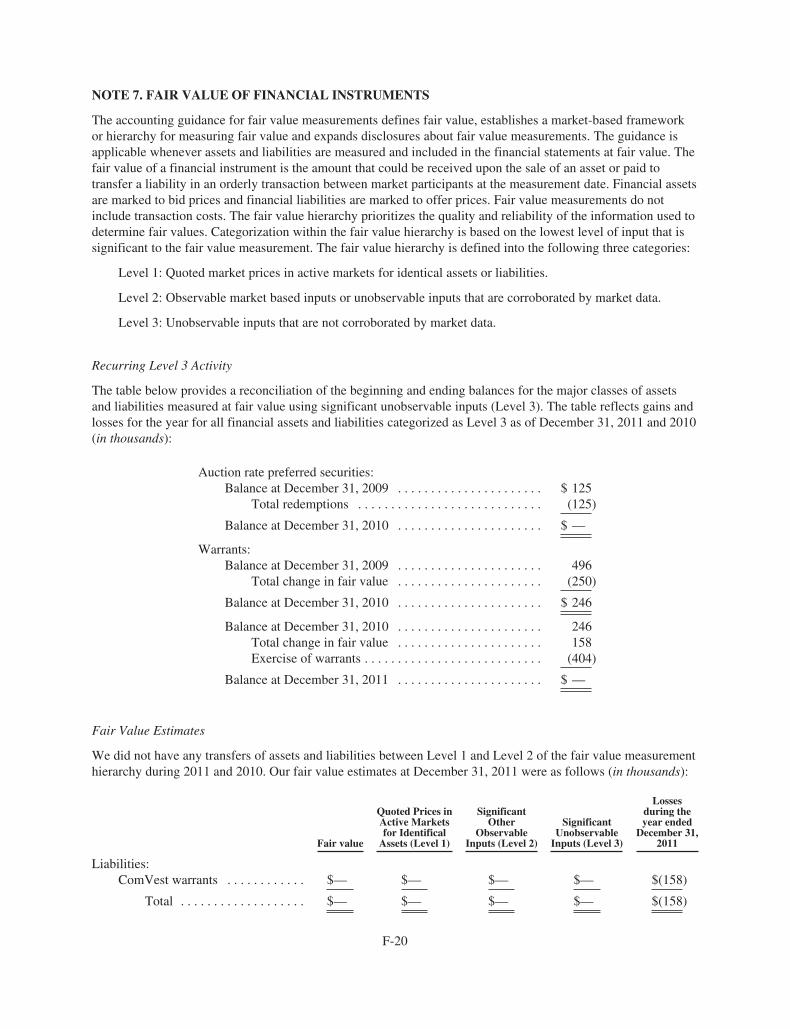
NOTE 7. FAIR VALUE OF FINANCIAL INSTRUMENTS
The accounting guidance for fair value measurements defines fair value, establishes a market-based frameworkor hierarchy for measuring fair value and expands disclosures about fair value measurements. The guidance isapplicable whenever assets and liabilities are measured and included in the financial statements at fair value. Thefair value of a financial instrument is the amount that could be received upon the sale of an asset or paid totransfer a liability in an orderly transaction between market participants at the measurement date. Financial assetsare marked to bid prices and financial liabilities are marked to offer prices. Fair value measurements do notinclude transaction costs. The fair value hierarchy prioritizes the quality and reliability of the information used todetermine fair values. Categorization within the fair value hierarchy is based on the lowest level of input that issignificant to the fair value measurement. The fair value hierarchy is defined into the following three categories:
Level 1: Quoted market prices in active markets for identical assets or liabilities.
Level 2: Observable market based inputs or unobservable inputs that are corroborated by market data.
Level 3: Unobservable inputs that are not corroborated by market data.
Recurring Level 3 Activity
The table below provides a reconciliation of the beginning and ending balances for the major classes of assetsand liabilities measured at fair value using significant unobservable inputs (Level 3). The table reflects gains andlosses for the year for all financial assets and liabilities categorized as Level 3 as of December 31, 2011 and 2010(in thousands):
Auction rate preferred securities:Balance at December 31, 2009 . . . . . . . . . . . . . . . . . . . . . . $ 125
Total redemptions . . . . . . . . . . . . . . . . . . . . . . . . . . . . (125)
Balance at December 31, 2010 . . . . . . . . . . . . . . . . . . . . . . $ —
Warrants:Balance at December 31, 2009 . . . . . . . . . . . . . . . . . . . . . . 496
Total change in fair value . . . . . . . . . . . . . . . . . . . . . . (250)
Balance at December 31, 2010 . . . . . . . . . . . . . . . . . . . . . . $ 246
Balance at December 31, 2010 . . . . . . . . . . . . . . . . . . . . . . 246Total change in fair value . . . . . . . . . . . . . . . . . . . . . . 158Exercise of warrants . . . . . . . . . . . . . . . . . . . . . . . . . . . (404)
Balance at December 31, 2011 . . . . . . . . . . . . . . . . . . . . . . $ —
Fair Value Estimates
We did not have any transfers of assets and liabilities between Level 1 and Level 2 of the fair value measurementhierarchy during 2011 and 2010. Our fair value estimates at December 31, 2011 were as follows (in thousands):
Fair value
Quoted Prices inActive Marketsfor IdentificalAssets (Level 1)
SignificantOther
ObservableInputs (Level 2)
SignificantUnobservableInputs (Level 3)
Lossesduring theyear ended
December 31,2011
Liabilities:ComVest warrants . . . . . . . . . . . . $— $— $— $— $(158)
Total . . . . . . . . . . . . . . . . . . . $— $— $— $— $(158)
F-20

Our fair value estimates at December 31, 2010 were as follows (in thousands):
Fair value
Quoted Prices inActive Marketsfor IdentificalAssets (Level 1)
SignificantOther
ObservableInputs (Level 2)
SignificantUnobservableInputs (Level 3)
Gains during theyear ended
December 31,2010
Liabilities:ComVest warrants . . . . . . . . . . $246 $— $— $246 $250
Total . . . . . . . . . . . . . . . . . $246 $— $— $246 $250
Auction Rate Preferred Securities
Auction Rate Preferred Securities (“ARPS”) were our only assets measured at fair value on a recurring basis inthe year ended December 31, 2009. We classified the investment in ARPS as a Level 3 investment as thesesecurities had significant unobservable inputs. The fair value of the investment in ARPS as of December 31,2009 was $125,000, calculated utilizing a discounted cash flow analysis. This analysis considered, among otheritems, the collateralization of the underlying securities, the expected future cash flows and the expectation ofwhen the security will be redeemed by the issuer, which was February 2010. In February 2010, all of theremaining ARPS were redeemed by the issuer and we received cash proceeds of $125,000.
Warrants
We had issued 385,000 warrants, which were exercised in May 2011, with provisions that protected holders froma decline in the stock price instrument if we issued equity shares for a price that was lower than the exercise priceof those instruments or issue new warrants or convertible instruments that had a lower exercise price. Inaccordance with accounting guidance, these warrants were recognized as liabilities and recorded at fair value oneach reporting date. We measured the estimated fair value of these warrants as of date of exercise, May 5, 2011,and recorded a $158,000 loss during the year ended December 31, 2011 to record the liabilities associated withthese warrants at their estimated fair value totaling $404,000 as of the date of exercise as compared to theirestimated fair value of $246,000 at December 31, 2010. The estimated fair value of these securities on the date ofexercise was the difference between the stock price on the date of exercise and the warrants’ exercise price. Theestimated fair value of the securities was calculated using a Black-Scholes valuation model, which approximateda lattice valuation model, at December 31, 2010. The assumptions used in the Black-Scholes model atDecember 31, 2010 were as follows: a volatility rate of 41.0%, a risk-free interest rate of 0.19%, an expected lifeof 0.39 years and no dividend yield.
Basis for Valuation
The carrying amounts reported in the accompanying consolidated balance sheets for cash and cash equivalents,accounts and other receivables, and trade accounts payable approximate fair value because of the immediate orshort-term maturities of these financial instruments. The fair values of the revolving credit note and promissorynotes payable were computed using a discounted cash flow model using estimated market rates adjusted for ourcredit risk as of December 31, 2011 and 2010. The fair value of the ComVest warrants were computed using aBlack-Scholes option pricing model. The carrying value and estimated fair value of our revolving credit note,promissory notes payable and ComVest warrants are as follows (in thousands):
December 31, 2011 December 31, 2010
CarryingValue
EstimatedFair Value
CarryingValue
EstimatedFair Value
Revolving credit note . . . . . . . . . . . . . . . . . . . . . . . . . . $2,500 $2,500 $7,270 $7,270Promissory notes . . . . . . . . . . . . . . . . . . . . . . . . . . . . . . $2,361 $2,361 $ 2 $ 2ComVest warrants . . . . . . . . . . . . . . . . . . . . . . . . . . . . $ — $ — $ 246 $ 246
F-21
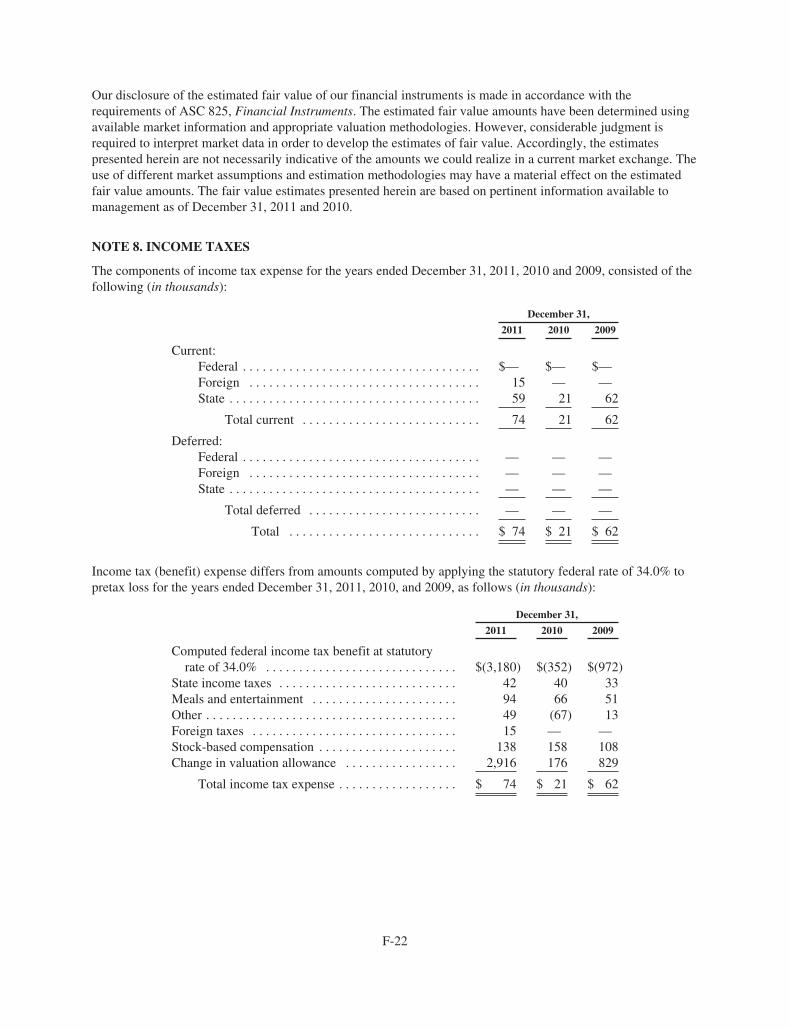
Our disclosure of the estimated fair value of our financial instruments is made in accordance with therequirements of ASC 825, Financial Instruments. The estimated fair value amounts have been determined usingavailable market information and appropriate valuation methodologies. However, considerable judgment isrequired to interpret market data in order to develop the estimates of fair value. Accordingly, the estimatespresented herein are not necessarily indicative of the amounts we could realize in a current market exchange. Theuse of different market assumptions and estimation methodologies may have a material effect on the estimatedfair value amounts. The fair value estimates presented herein are based on pertinent information available tomanagement as of December 31, 2011 and 2010.
NOTE 8. INCOME TAXES
The components of income tax expense for the years ended December 31, 2011, 2010 and 2009, consisted of thefollowing (in thousands):
December 31,
2011 2010 2009
Current:Federal . . . . . . . . . . . . . . . . . . . . . . . . . . . . . . . . . . . . $— $— $—Foreign . . . . . . . . . . . . . . . . . . . . . . . . . . . . . . . . . . . 15 — —State . . . . . . . . . . . . . . . . . . . . . . . . . . . . . . . . . . . . . . 59 21 62
Total current . . . . . . . . . . . . . . . . . . . . . . . . . . . 74 21 62
Deferred:Federal . . . . . . . . . . . . . . . . . . . . . . . . . . . . . . . . . . . . — — —Foreign . . . . . . . . . . . . . . . . . . . . . . . . . . . . . . . . . . . — — —State . . . . . . . . . . . . . . . . . . . . . . . . . . . . . . . . . . . . . . — — —
Total deferred . . . . . . . . . . . . . . . . . . . . . . . . . . — — —
Total . . . . . . . . . . . . . . . . . . . . . . . . . . . . . $ 74 $ 21 $ 62
Income tax (benefit) expense differs from amounts computed by applying the statutory federal rate of 34.0% topretax loss for the years ended December 31, 2011, 2010, and 2009, as follows (in thousands):
December 31,
2011 2010 2009
Computed federal income tax benefit at statutoryrate of 34.0% . . . . . . . . . . . . . . . . . . . . . . . . . . . . . $(3,180) $(352) $(972)
State income taxes . . . . . . . . . . . . . . . . . . . . . . . . . . . 42 40 33Meals and entertainment . . . . . . . . . . . . . . . . . . . . . . 94 66 51Other . . . . . . . . . . . . . . . . . . . . . . . . . . . . . . . . . . . . . . 49 (67) 13Foreign taxes . . . . . . . . . . . . . . . . . . . . . . . . . . . . . . . 15 — —Stock-based compensation . . . . . . . . . . . . . . . . . . . . . 138 158 108Change in valuation allowance . . . . . . . . . . . . . . . . . 2,916 176 829
Total income tax expense . . . . . . . . . . . . . . . . . . $ 74 $ 21 $ 62
F-22
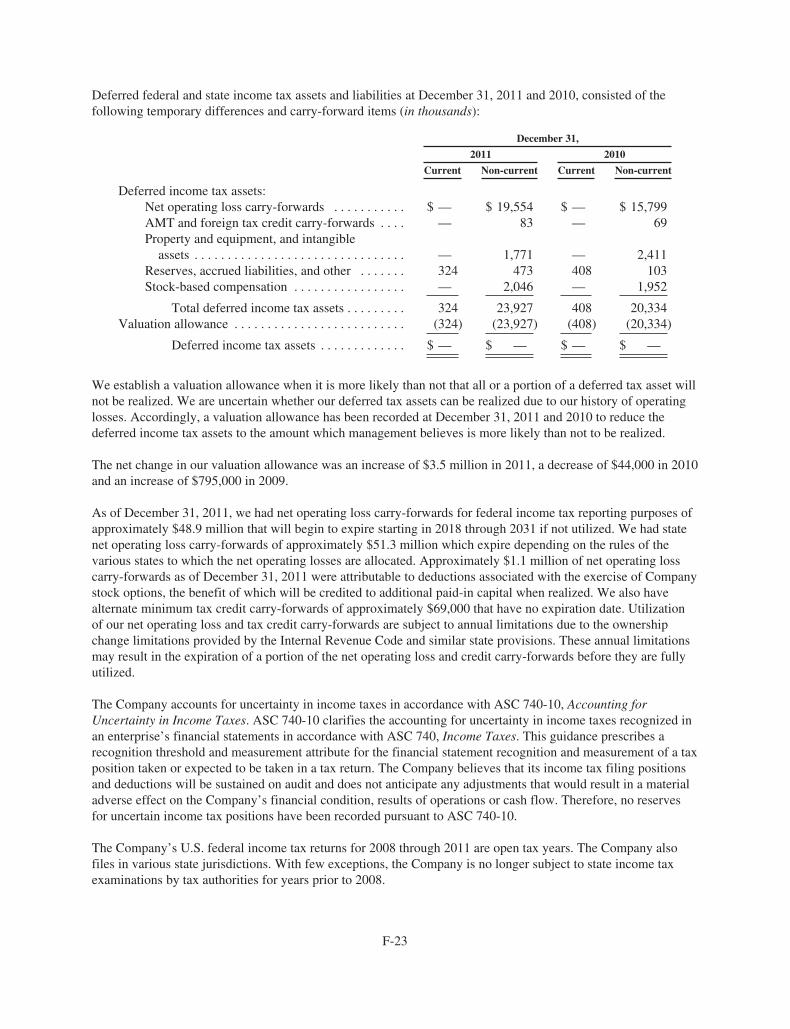
Deferred federal and state income tax assets and liabilities at December 31, 2011 and 2010, consisted of thefollowing temporary differences and carry-forward items (in thousands):
December 31,
2011 2010
Current Non-current Current Non-current
Deferred income tax assets:Net operating loss carry-forwards . . . . . . . . . . . $ — $ 19,554 $ — $ 15,799AMT and foreign tax credit carry-forwards . . . . — 83 — 69Property and equipment, and intangibleassets . . . . . . . . . . . . . . . . . . . . . . . . . . . . . . . . — 1,771 — 2,411
Reserves, accrued liabilities, and other . . . . . . . 324 473 408 103Stock-based compensation . . . . . . . . . . . . . . . . . — 2,046 — 1,952
Total deferred income tax assets . . . . . . . . . 324 23,927 408 20,334Valuation allowance . . . . . . . . . . . . . . . . . . . . . . . . . . (324) (23,927) (408) (20,334)
Deferred income tax assets . . . . . . . . . . . . . $ — $ — $ — $ —
We establish a valuation allowance when it is more likely than not that all or a portion of a deferred tax asset willnot be realized. We are uncertain whether our deferred tax assets can be realized due to our history of operatinglosses. Accordingly, a valuation allowance has been recorded at December 31, 2011 and 2010 to reduce thedeferred income tax assets to the amount which management believes is more likely than not to be realized.
The net change in our valuation allowance was an increase of $3.5 million in 2011, a decrease of $44,000 in 2010and an increase of $795,000 in 2009.
As of December 31, 2011, we had net operating loss carry-forwards for federal income tax reporting purposes ofapproximately $48.9 million that will begin to expire starting in 2018 through 2031 if not utilized. We had statenet operating loss carry-forwards of approximately $51.3 million which expire depending on the rules of thevarious states to which the net operating losses are allocated. Approximately $1.1 million of net operating losscarry-forwards as of December 31, 2011 were attributable to deductions associated with the exercise of Companystock options, the benefit of which will be credited to additional paid-in capital when realized. We also havealternate minimum tax credit carry-forwards of approximately $69,000 that have no expiration date. Utilizationof our net operating loss and tax credit carry-forwards are subject to annual limitations due to the ownershipchange limitations provided by the Internal Revenue Code and similar state provisions. These annual limitationsmay result in the expiration of a portion of the net operating loss and credit carry-forwards before they are fullyutilized.
The Company accounts for uncertainty in income taxes in accordance with ASC 740-10, Accounting forUncertainty in Income Taxes. ASC 740-10 clarifies the accounting for uncertainty in income taxes recognized inan enterprise’s financial statements in accordance with ASC 740, Income Taxes. This guidance prescribes arecognition threshold and measurement attribute for the financial statement recognition and measurement of a taxposition taken or expected to be taken in a tax return. The Company believes that its income tax filing positionsand deductions will be sustained on audit and does not anticipate any adjustments that would result in a materialadverse effect on the Company’s financial condition, results of operations or cash flow. Therefore, no reservesfor uncertain income tax positions have been recorded pursuant to ASC 740-10.
The Company’s U.S. federal income tax returns for 2008 through 2011 are open tax years. The Company alsofiles in various state jurisdictions. With few exceptions, the Company is no longer subject to state income taxexaminations by tax authorities for years prior to 2008.
F-23
NOTE 9. CAPITAL TRANSACTIONS
Issuances of Common Stock
In June 2011, we sold 7.2 million shares of common stock at $3.32 per share for a total of $23.9 million to asingle investor. Net proceeds of the offering, after expenses of $232,000, were $23.6 million.
We received proceeds of $1.6 million, $1.8 million and $484,000 from the exercise of 624,000, 864,000 and215,000 options and warrants during the years ended December 31, 2011, 2010 and 2009, respectively.
We issued 18,000, 45,000 and 68,000 shares of common stock valued at $67,000, $126,000 and $175,000 to athird party for investor relations services during the years ended December 31, 2011, 2010 and 2009,respectively.
In December 2009, we sold 3.4 million shares of common stock at $2.45 per share for a total of $8.4 million toan investment fund.
Net proceeds of the offering, after placement fees and expenses of $514,000, were $7.9 million.
Employee Stock Purchase Plan
We reestablished the ability for employees to participate in the 2005 Employee Stock Purchase Plan (“PurchasePlan”) commencing on October 1, 2010. The Purchase Plan provides that up to 1,000,000 shares of commonstock may be sold to participating employees and expires at the beginning of 2014. Each participating period isthree months in length. The purchase price a participant pays for the shares is equal to 85% of the closing marketbid price of the common stock on the first business day or the last business day of each participating period,whichever is lower. We issued 80,000 and 28,000 shares of common stock for proceeds of $225,000 and $53,000under the Purchase Plan to eligible employees during the years ended December 31, 2011 and 2010, respectively.Stock compensation expense recognized under the Purchase Plan was $72,000 and $17,000 during the yearsended December 31, 2011 and 2010. The Company had 892,000 shares of common stock available for issuanceunder the Purchase Plan at December 31, 2011. No employees participated in the plan during 2009.
Preferred Stock
The Board of Directors is authorized to issue shares of our authorized but unissued preferred stock in one or moreseries. With respect to any series, the Board of Directors is authorized to determine the number of shares thatconstitutes such series; the rate of dividend, if any, payable on shares of such series; whether the shares of suchseries shall be cumulative, non-cumulative, or any other characteristics, preferences, limitations, rights,privileges, immunities or terms. There was no preferred stock outstanding at December 31, 2011 or 2010.
NOTE 10. STOCK-BASED COMPENSATION
Stock-based compensation cost is measured at the grant date based on the fair value of the award granted andrecognized as expense using the graded-vesting method over the period in which the award is expected to vest.Stock-based compensation expense recognized during a period is based on the value of the portion of stock-basedawards that is ultimately expected to vest during the period. As stock-based compensation expense recognized inthe results for the year is based on awards ultimately expected to vest, it has been reduced for estimatedforfeitures.
We recognize the estimated compensation cost of service-based awards, net of estimated forfeitures, over thevesting term. We recognize the estimated compensation cost of performance-based awards, net of estimatedforfeitures. The awards are earned upon attainment of identified performance goals, some of which containdiscretionary metrics. As such, these awards are revalued based on our traded stock price at the end of each
F-24
reporting period. If the discretion is removed, the award will be classified as a fixed equity award. The fair valueof the awards will be based on the measurement date, which is the date the award becomes fixed. The awardswill be subsequently amortized over the remaining performance period.
We utilize the Black-Scholes model to determine the estimated fair value for grants of stock options andwarrants. The Black-Scholes model requires the use of highly subjective and complex assumptions to determinethe fair value of stock-based awards, including the option’s expected term, expected dividend yield, the risk-freeinterest rate and the price volatility of the underlying stock. The expected dividend yield is based on ourhistorical dividend rates. Risk-free interest rates are based on U.S. treasury rates. Volatility is based on historicalstock prices over a period equal to the estimated life of the option. We have issued stock options to employeesunder share-based compensation plans including the Long-Term Stock Incentive Plan, the 2008 Equity IncentivePlan and those granted by the Board of Directors and Compensation Committee. Stock options are issued at thecurrent market price on the date of grant and are generally subject to a three-year vesting period with acontractual term of five years.
The grant date fair value of the restricted stock and restricted stock unit awards was estimated using the closingmarket price of the Company’s common stock on the grant date, with the compensation expense amortized overthe vesting period of the restricted stock awards, net of estimated forfeitures.
Our stock-based compensation primarily consists of the following plans:
2008 Equity Incentive Plan: Effective July 1, 2008, we established the 2008 Equity Incentive Plan (“2008 Plan”).The 2008 Plan provides for a maximum of 3,272,500 shares of our common stock to be awarded to participantsand their beneficiaries. The shareholders approved and we amended the inContact 2008 Equity Incentive Planincreasing the number of common shares available for awards from 2,272,500 to 3,272,500 in June 2010. TheCompensation Committee (the “Committee”), as determined by the Board of Directors, determines anddesignates the eligible participants and awards to be granted under the 2008 Plan. The Committee may grantincentive stock options; non-qualified options; stock appreciation rights (“SAR”) and restricted stock units(“RSU”). The terms and exercise prices of options are established by the Committee; except that the exerciseprices cannot be less than 100% of the fair market value of a share of common stock on the date of grant. As ofDecember 31, 2011, incentive stock options and RSUs to purchase a total of 3,028,204 shares had been granted,and had either been exercised or were outstanding under the 2008 Plan.
Long-Term Stock Incentive Plan: Effective March 11, 1999, we established the Long-Term Stock Incentive Plan(“1999 Plan”). The 1999 Plan provides for a maximum of 1,200,000 shares of our common stock to be awardedto participants and their beneficiaries. The Committee, as determined by the Board of Directors, determines anddesignates the eligible participants and awards to be granted under 1999 Plan. The Committee may grantincentive stock options; non-qualified options; SARs; and on a limited basis, stock awards. The terms andexercise prices of options are established by the Committee; except that the exercise prices cannot be less than100% of the fair market value of a share of common stock on the date of grant. As of December 31, 2011, stockoptions to purchase a total of 941,854 shares had been granted, and had either been exercised or were outstandingunder the 1999 Plan.
Other Options: Our Board of Directors has from time to time authorized the grant of stock options to directors,officers, key employees and consultants as compensation and in connection with obtaining financing.
F-25
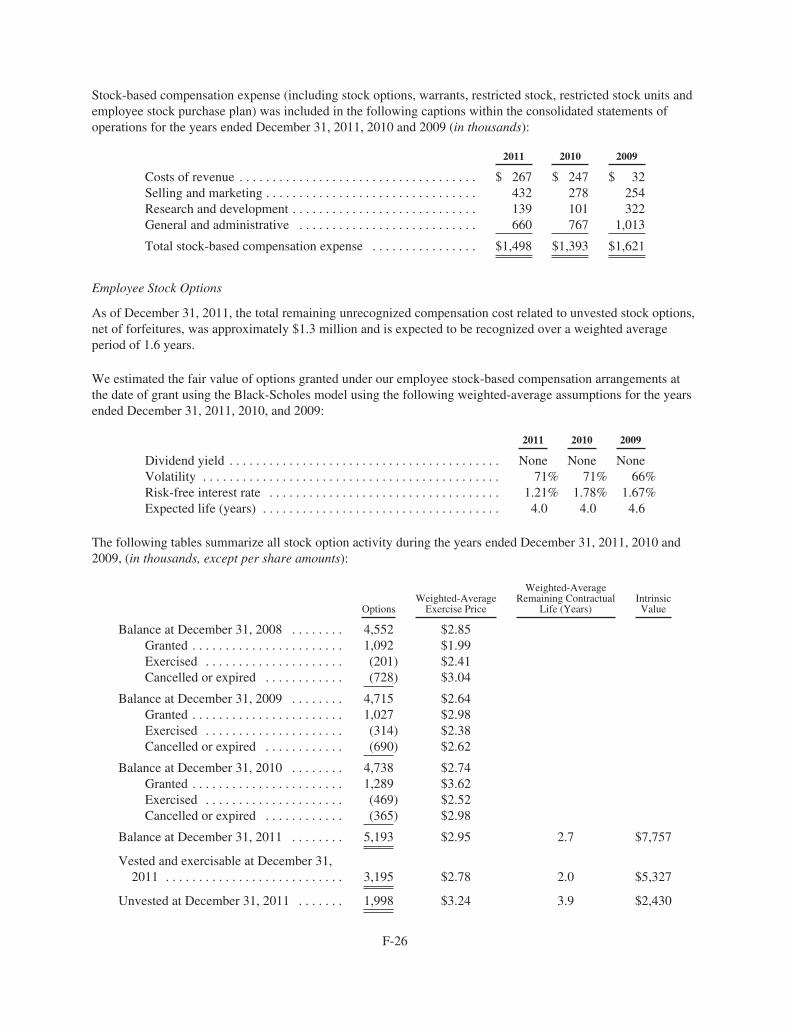
Stock-based compensation expense (including stock options, warrants, restricted stock, restricted stock units andemployee stock purchase plan) was included in the following captions within the consolidated statements ofoperations for the years ended December 31, 2011, 2010 and 2009 (in thousands):
2011 2010 2009
Costs of revenue . . . . . . . . . . . . . . . . . . . . . . . . . . . . . . . . . . . . $ 267 $ 247 $ 32Selling and marketing . . . . . . . . . . . . . . . . . . . . . . . . . . . . . . . . 432 278 254Research and development . . . . . . . . . . . . . . . . . . . . . . . . . . . . 139 101 322General and administrative . . . . . . . . . . . . . . . . . . . . . . . . . . . 660 767 1,013
Total stock-based compensation expense . . . . . . . . . . . . . . . . $1,498 $1,393 $1,621
Employee Stock Options
As of December 31, 2011, the total remaining unrecognized compensation cost related to unvested stock options,net of forfeitures, was approximately $1.3 million and is expected to be recognized over a weighted averageperiod of 1.6 years.
We estimated the fair value of options granted under our employee stock-based compensation arrangements atthe date of grant using the Black-Scholes model using the following weighted-average assumptions for the yearsended December 31, 2011, 2010, and 2009:
2011 2010 2009
Dividend yield . . . . . . . . . . . . . . . . . . . . . . . . . . . . . . . . . . . . . . . . . None None NoneVolatility . . . . . . . . . . . . . . . . . . . . . . . . . . . . . . . . . . . . . . . . . . . . . 71% 71% 66%Risk-free interest rate . . . . . . . . . . . . . . . . . . . . . . . . . . . . . . . . . . . 1.21% 1.78% 1.67%Expected life (years) . . . . . . . . . . . . . . . . . . . . . . . . . . . . . . . . . . . . 4.0 4.0 4.6
The following tables summarize all stock option activity during the years ended December 31, 2011, 2010 and2009, (in thousands, except per share amounts):
OptionsWeighted-AverageExercise Price
Weighted-AverageRemaining Contractual
Life (Years)IntrinsicValue
Balance at December 31, 2008 . . . . . . . . 4,552 $2.85Granted . . . . . . . . . . . . . . . . . . . . . . . 1,092 $1.99Exercised . . . . . . . . . . . . . . . . . . . . . (201) $2.41Cancelled or expired . . . . . . . . . . . . (728) $3.04
Balance at December 31, 2009 . . . . . . . . 4,715 $2.64Granted . . . . . . . . . . . . . . . . . . . . . . . 1,027 $2.98Exercised . . . . . . . . . . . . . . . . . . . . . (314) $2.38Cancelled or expired . . . . . . . . . . . . (690) $2.62
Balance at December 31, 2010 . . . . . . . . 4,738 $2.74Granted . . . . . . . . . . . . . . . . . . . . . . . 1,289 $3.62Exercised . . . . . . . . . . . . . . . . . . . . . (469) $2.52Cancelled or expired . . . . . . . . . . . . (365) $2.98
Balance at December 31, 2011 . . . . . . . . 5,193 $2.95 2.7 $7,757
Vested and exercisable at December 31,2011 . . . . . . . . . . . . . . . . . . . . . . . . . . . 3,195 $2.78 2.0 $5,327
Unvested at December 31, 2011 . . . . . . . 1,998 $3.24 3.9 $2,430
F-26
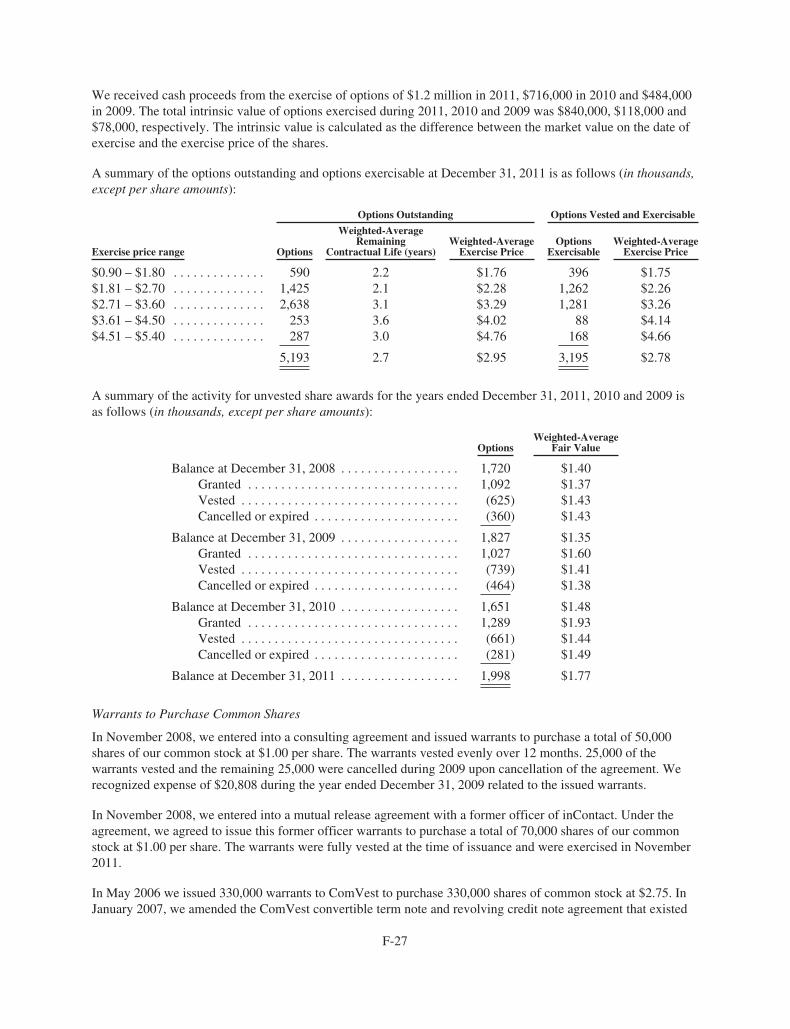
We received cash proceeds from the exercise of options of $1.2 million in 2011, $716,000 in 2010 and $484,000in 2009. The total intrinsic value of options exercised during 2011, 2010 and 2009 was $840,000, $118,000 and$78,000, respectively. The intrinsic value is calculated as the difference between the market value on the date ofexercise and the exercise price of the shares.
A summary of the options outstanding and options exercisable at December 31, 2011 is as follows (in thousands,except per share amounts):
Options Outstanding Options Vested and Exercisable
Exercise price range Options
Weighted-AverageRemaining
Contractual Life (years)Weighted-AverageExercise Price
OptionsExercisable
Weighted-AverageExercise Price
$0.90 – $1.80 . . . . . . . . . . . . . . 590 2.2 $1.76 396 $1.75$1.81 – $2.70 . . . . . . . . . . . . . . 1,425 2.1 $2.28 1,262 $2.26$2.71 – $3.60 . . . . . . . . . . . . . . 2,638 3.1 $3.29 1,281 $3.26$3.61 – $4.50 . . . . . . . . . . . . . . 253 3.6 $4.02 88 $4.14$4.51 – $5.40 . . . . . . . . . . . . . . 287 3.0 $4.76 168 $4.66
5,193 2.7 $2.95 3,195 $2.78
A summary of the activity for unvested share awards for the years ended December 31, 2011, 2010 and 2009 isas follows (in thousands, except per share amounts):
OptionsWeighted-Average
Fair Value
Balance at December 31, 2008 . . . . . . . . . . . . . . . . . . 1,720 $1.40Granted . . . . . . . . . . . . . . . . . . . . . . . . . . . . . . . . 1,092 $1.37Vested . . . . . . . . . . . . . . . . . . . . . . . . . . . . . . . . . (625) $1.43Cancelled or expired . . . . . . . . . . . . . . . . . . . . . . (360) $1.43
Balance at December 31, 2009 . . . . . . . . . . . . . . . . . . 1,827 $1.35Granted . . . . . . . . . . . . . . . . . . . . . . . . . . . . . . . . 1,027 $1.60Vested . . . . . . . . . . . . . . . . . . . . . . . . . . . . . . . . . (739) $1.41Cancelled or expired . . . . . . . . . . . . . . . . . . . . . . (464) $1.38
Balance at December 31, 2010 . . . . . . . . . . . . . . . . . . 1,651 $1.48Granted . . . . . . . . . . . . . . . . . . . . . . . . . . . . . . . . 1,289 $1.93Vested . . . . . . . . . . . . . . . . . . . . . . . . . . . . . . . . . (661) $1.44Cancelled or expired . . . . . . . . . . . . . . . . . . . . . . (281) $1.49
Balance at December 31, 2011 . . . . . . . . . . . . . . . . . . 1,998 $1.77
Warrants to Purchase Common Shares
In November 2008, we entered into a consulting agreement and issued warrants to purchase a total of 50,000shares of our common stock at $1.00 per share. The warrants vested evenly over 12 months. 25,000 of thewarrants vested and the remaining 25,000 were cancelled during 2009 upon cancellation of the agreement. Werecognized expense of $20,808 during the year ended December 31, 2009 related to the issued warrants.
In November 2008, we entered into a mutual release agreement with a former officer of inContact. Under theagreement, we agreed to issue this former officer warrants to purchase a total of 70,000 shares of our commonstock at $1.00 per share. The warrants were fully vested at the time of issuance and were exercised in November2011.
In May 2006 we issued 330,000 warrants to ComVest to purchase 330,000 shares of common stock at $2.75. InJanuary 2007, we amended the ComVest convertible term note and revolving credit note agreement that existed
F-27
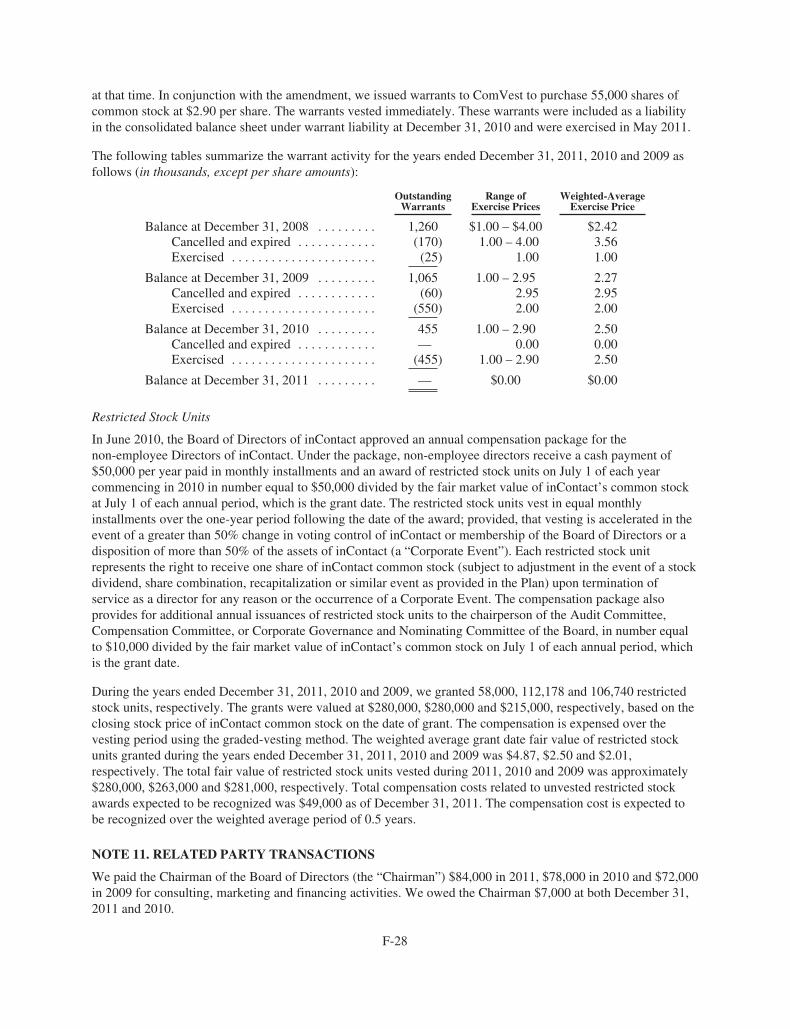
at that time. In conjunction with the amendment, we issued warrants to ComVest to purchase 55,000 shares ofcommon stock at $2.90 per share. The warrants vested immediately. These warrants were included as a liabilityin the consolidated balance sheet under warrant liability at December 31, 2010 and were exercised in May 2011.
The following tables summarize the warrant activity for the years ended December 31, 2011, 2010 and 2009 asfollows (in thousands, except per share amounts):
OutstandingWarrants
Range ofExercise Prices
Weighted-AverageExercise Price
Balance at December 31, 2008 . . . . . . . . . 1,260 $1.00 – $4.00 $2.42Cancelled and expired . . . . . . . . . . . . (170) 1.00 – 4.00 3.56Exercised . . . . . . . . . . . . . . . . . . . . . . (25) 1.00 1.00
Balance at December 31, 2009 . . . . . . . . . 1,065 1.00 – 2.95 2.27Cancelled and expired . . . . . . . . . . . . (60) 2.95 2.95Exercised . . . . . . . . . . . . . . . . . . . . . . (550) 2.00 2.00
Balance at December 31, 2010 . . . . . . . . . 455 1.00 – 2.90 2.50Cancelled and expired . . . . . . . . . . . . — 0.00 0.00Exercised . . . . . . . . . . . . . . . . . . . . . . (455) 1.00 – 2.90 2.50
Balance at December 31, 2011 . . . . . . . . . — $0.00 $0.00
Restricted Stock Units
In June 2010, the Board of Directors of inContact approved an annual compensation package for thenon-employee Directors of inContact. Under the package, non-employee directors receive a cash payment of$50,000 per year paid in monthly installments and an award of restricted stock units on July 1 of each yearcommencing in 2010 in number equal to $50,000 divided by the fair market value of inContact’s common stockat July 1 of each annual period, which is the grant date. The restricted stock units vest in equal monthlyinstallments over the one-year period following the date of the award; provided, that vesting is accelerated in theevent of a greater than 50% change in voting control of inContact or membership of the Board of Directors or adisposition of more than 50% of the assets of inContact (a “Corporate Event”). Each restricted stock unitrepresents the right to receive one share of inContact common stock (subject to adjustment in the event of a stockdividend, share combination, recapitalization or similar event as provided in the Plan) upon termination ofservice as a director for any reason or the occurrence of a Corporate Event. The compensation package alsoprovides for additional annual issuances of restricted stock units to the chairperson of the Audit Committee,Compensation Committee, or Corporate Governance and Nominating Committee of the Board, in number equalto $10,000 divided by the fair market value of inContact’s common stock on July 1 of each annual period, whichis the grant date.
During the years ended December 31, 2011, 2010 and 2009, we granted 58,000, 112,178 and 106,740 restrictedstock units, respectively. The grants were valued at $280,000, $280,000 and $215,000, respectively, based on theclosing stock price of inContact common stock on the date of grant. The compensation is expensed over thevesting period using the graded-vesting method. The weighted average grant date fair value of restricted stockunits granted during the years ended December 31, 2011, 2010 and 2009 was $4.87, $2.50 and $2.01,respectively. The total fair value of restricted stock units vested during 2011, 2010 and 2009 was approximately$280,000, $263,000 and $281,000, respectively. Total compensation costs related to unvested restricted stockawards expected to be recognized was $49,000 as of December 31, 2011. The compensation cost is expected tobe recognized over the weighted average period of 0.5 years.
NOTE 11. RELATED PARTY TRANSACTIONS
We paid the Chairman of the Board of Directors (the “Chairman”) $84,000 in 2011, $78,000 in 2010 and $72,000in 2009 for consulting, marketing and financing activities. We owed the Chairman $7,000 at both December 31,2011 and 2010.
F-28
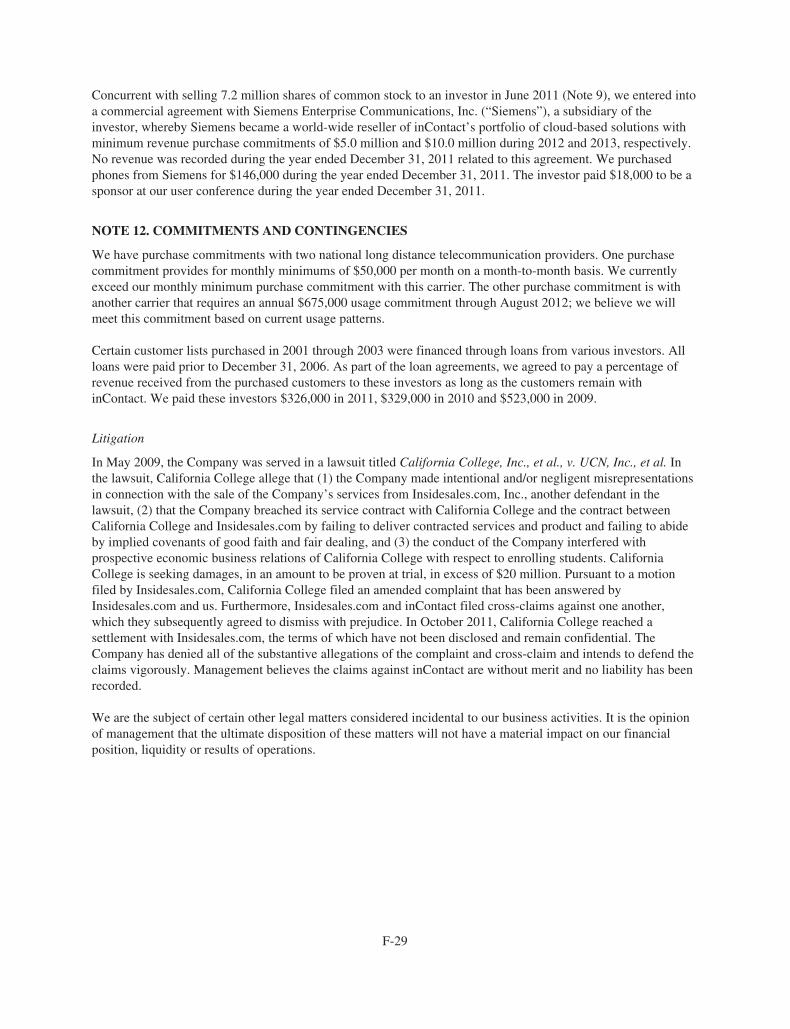
Concurrent with selling 7.2 million shares of common stock to an investor in June 2011 (Note 9), we entered intoa commercial agreement with Siemens Enterprise Communications, Inc. (“Siemens”), a subsidiary of theinvestor, whereby Siemens became a world-wide reseller of inContact’s portfolio of cloud-based solutions withminimum revenue purchase commitments of $5.0 million and $10.0 million during 2012 and 2013, respectively.No revenue was recorded during the year ended December 31, 2011 related to this agreement. We purchasedphones from Siemens for $146,000 during the year ended December 31, 2011. The investor paid $18,000 to be asponsor at our user conference during the year ended December 31, 2011.
NOTE 12. COMMITMENTS AND CONTINGENCIES
We have purchase commitments with two national long distance telecommunication providers. One purchasecommitment provides for monthly minimums of $50,000 per month on a month-to-month basis. We currentlyexceed our monthly minimum purchase commitment with this carrier. The other purchase commitment is withanother carrier that requires an annual $675,000 usage commitment through August 2012; we believe we willmeet this commitment based on current usage patterns.
Certain customer lists purchased in 2001 through 2003 were financed through loans from various investors. Allloans were paid prior to December 31, 2006. As part of the loan agreements, we agreed to pay a percentage ofrevenue received from the purchased customers to these investors as long as the customers remain withinContact. We paid these investors $326,000 in 2011, $329,000 in 2010 and $523,000 in 2009.
Litigation
In May 2009, the Company was served in a lawsuit titled California College, Inc., et al., v. UCN, Inc., et al. Inthe lawsuit, California College allege that (1) the Company made intentional and/or negligent misrepresentationsin connection with the sale of the Company’s services from Insidesales.com, Inc., another defendant in thelawsuit, (2) that the Company breached its service contract with California College and the contract betweenCalifornia College and Insidesales.com by failing to deliver contracted services and product and failing to abideby implied covenants of good faith and fair dealing, and (3) the conduct of the Company interfered withprospective economic business relations of California College with respect to enrolling students. CaliforniaCollege is seeking damages, in an amount to be proven at trial, in excess of $20 million. Pursuant to a motionfiled by Insidesales.com, California College filed an amended complaint that has been answered byInsidesales.com and us. Furthermore, Insidesales.com and inContact filed cross-claims against one another,which they subsequently agreed to dismiss with prejudice. In October 2011, California College reached asettlement with Insidesales.com, the terms of which have not been disclosed and remain confidential. TheCompany has denied all of the substantive allegations of the complaint and cross-claim and intends to defend theclaims vigorously. Management believes the claims against inContact are without merit and no liability has beenrecorded.
We are the subject of certain other legal matters considered incidental to our business activities. It is the opinionof management that the ultimate disposition of these matters will not have a material impact on our financialposition, liquidity or results of operations.
F-29
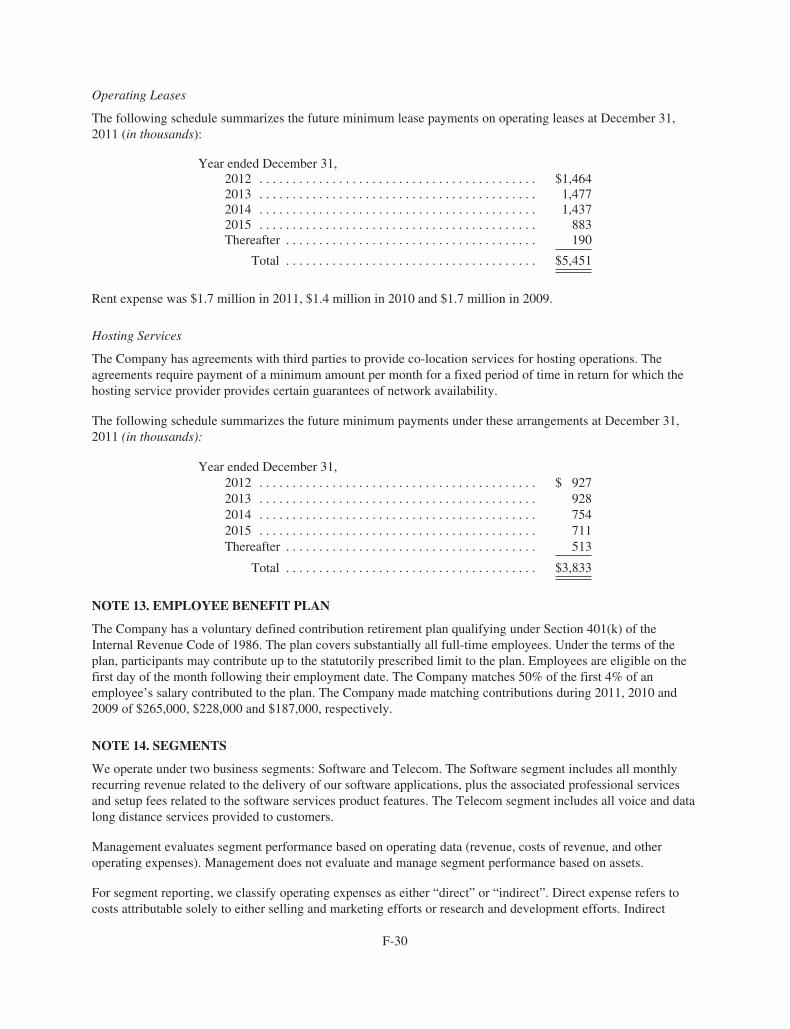
Operating Leases
The following schedule summarizes the future minimum lease payments on operating leases at December 31,2011 (in thousands):
Year ended December 31,2012 . . . . . . . . . . . . . . . . . . . . . . . . . . . . . . . . . . . . . . . . . . $1,4642013 . . . . . . . . . . . . . . . . . . . . . . . . . . . . . . . . . . . . . . . . . . 1,4772014 . . . . . . . . . . . . . . . . . . . . . . . . . . . . . . . . . . . . . . . . . . 1,4372015 . . . . . . . . . . . . . . . . . . . . . . . . . . . . . . . . . . . . . . . . . . 883Thereafter . . . . . . . . . . . . . . . . . . . . . . . . . . . . . . . . . . . . . . 190
Total . . . . . . . . . . . . . . . . . . . . . . . . . . . . . . . . . . . . . . $5,451
Rent expense was $1.7 million in 2011, $1.4 million in 2010 and $1.7 million in 2009.
Hosting Services
The Company has agreements with third parties to provide co-location services for hosting operations. Theagreements require payment of a minimum amount per month for a fixed period of time in return for which thehosting service provider provides certain guarantees of network availability.
The following schedule summarizes the future minimum payments under these arrangements at December 31,2011 (in thousands):
Year ended December 31,2012 . . . . . . . . . . . . . . . . . . . . . . . . . . . . . . . . . . . . . . . . . . $ 9272013 . . . . . . . . . . . . . . . . . . . . . . . . . . . . . . . . . . . . . . . . . . 9282014 . . . . . . . . . . . . . . . . . . . . . . . . . . . . . . . . . . . . . . . . . . 7542015 . . . . . . . . . . . . . . . . . . . . . . . . . . . . . . . . . . . . . . . . . . 711Thereafter . . . . . . . . . . . . . . . . . . . . . . . . . . . . . . . . . . . . . . 513
Total . . . . . . . . . . . . . . . . . . . . . . . . . . . . . . . . . . . . . . $3,833
NOTE 13. EMPLOYEE BENEFIT PLAN
The Company has a voluntary defined contribution retirement plan qualifying under Section 401(k) of theInternal Revenue Code of 1986. The plan covers substantially all full-time employees. Under the terms of theplan, participants may contribute up to the statutorily prescribed limit to the plan. Employees are eligible on thefirst day of the month following their employment date. The Company matches 50% of the first 4% of anemployee’s salary contributed to the plan. The Company made matching contributions during 2011, 2010 and2009 of $265,000, $228,000 and $187,000, respectively.
NOTE 14. SEGMENTS
We operate under two business segments: Software and Telecom. The Software segment includes all monthlyrecurring revenue related to the delivery of our software applications, plus the associated professional servicesand setup fees related to the software services product features. The Telecom segment includes all voice and datalong distance services provided to customers.
Management evaluates segment performance based on operating data (revenue, costs of revenue, and otheroperating expenses). Management does not evaluate and manage segment performance based on assets.
For segment reporting, we classify operating expenses as either “direct” or “indirect”. Direct expense refers tocosts attributable solely to either selling and marketing efforts or research and development efforts. Indirect
F-30
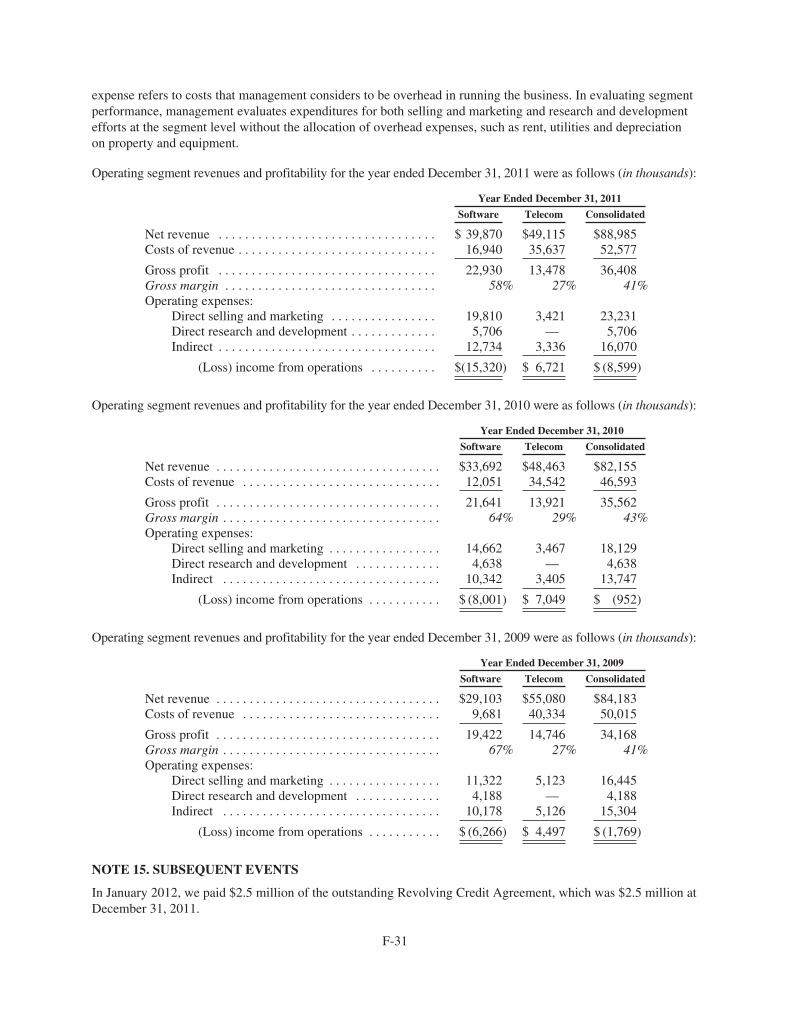
expense refers to costs that management considers to be overhead in running the business. In evaluating segmentperformance, management evaluates expenditures for both selling and marketing and research and developmentefforts at the segment level without the allocation of overhead expenses, such as rent, utilities and depreciationon property and equipment.
Operating segment revenues and profitability for the year ended December 31, 2011 were as follows (in thousands):
Year Ended December 31, 2011
Software Telecom Consolidated
Net revenue . . . . . . . . . . . . . . . . . . . . . . . . . . . . . . . . . $ 39,870 $49,115 $88,985Costs of revenue . . . . . . . . . . . . . . . . . . . . . . . . . . . . . . 16,940 35,637 52,577
Gross profit . . . . . . . . . . . . . . . . . . . . . . . . . . . . . . . . . 22,930 13,478 36,408Gross margin . . . . . . . . . . . . . . . . . . . . . . . . . . . . . . . . 58% 27% 41%Operating expenses:
Direct selling and marketing . . . . . . . . . . . . . . . . 19,810 3,421 23,231Direct research and development . . . . . . . . . . . . . 5,706 — 5,706Indirect . . . . . . . . . . . . . . . . . . . . . . . . . . . . . . . . . 12,734 3,336 16,070
(Loss) income from operations . . . . . . . . . . $(15,320) $ 6,721 $ (8,599)
Operating segment revenues and profitability for the year ended December 31, 2010 were as follows (in thousands):
Year Ended December 31, 2010
Software Telecom Consolidated
Net revenue . . . . . . . . . . . . . . . . . . . . . . . . . . . . . . . . . . $33,692 $48,463 $82,155Costs of revenue . . . . . . . . . . . . . . . . . . . . . . . . . . . . . . 12,051 34,542 46,593
Gross profit . . . . . . . . . . . . . . . . . . . . . . . . . . . . . . . . . . 21,641 13,921 35,562Gross margin . . . . . . . . . . . . . . . . . . . . . . . . . . . . . . . . . 64% 29% 43%Operating expenses:
Direct selling and marketing . . . . . . . . . . . . . . . . . 14,662 3,467 18,129Direct research and development . . . . . . . . . . . . . 4,638 — 4,638Indirect . . . . . . . . . . . . . . . . . . . . . . . . . . . . . . . . . 10,342 3,405 13,747
(Loss) income from operations . . . . . . . . . . . $ (8,001) $ 7,049 $ (952)
Operating segment revenues and profitability for the year ended December 31, 2009 were as follows (in thousands):
Year Ended December 31, 2009
Software Telecom Consolidated
Net revenue . . . . . . . . . . . . . . . . . . . . . . . . . . . . . . . . . . $29,103 $55,080 $84,183Costs of revenue . . . . . . . . . . . . . . . . . . . . . . . . . . . . . . 9,681 40,334 50,015
Gross profit . . . . . . . . . . . . . . . . . . . . . . . . . . . . . . . . . . 19,422 14,746 34,168Gross margin . . . . . . . . . . . . . . . . . . . . . . . . . . . . . . . . . 67% 27% 41%Operating expenses:
Direct selling and marketing . . . . . . . . . . . . . . . . . 11,322 5,123 16,445Direct research and development . . . . . . . . . . . . . 4,188 — 4,188Indirect . . . . . . . . . . . . . . . . . . . . . . . . . . . . . . . . . 10,178 5,126 15,304
(Loss) income from operations . . . . . . . . . . . $ (6,266) $ 4,497 $ (1,769)
NOTE 15. SUBSEQUENT EVENTS
In January 2012, we paid $2.5 million of the outstanding Revolving Credit Agreement, which was $2.5 million atDecember 31, 2011.
F-31

INCONTACT, INC.SCHEDULE II—VALUATION AND QUALIFYING ACCOUNTS(in thousands)
Allowance for uncollectible accounts receivable:
Balance atbeginningof year
Charged tocosts andexpenses
Write-offs,net of
recoveries
Balance atend
of year
Year ended December 31, 2011 . . . . . . . . . . . . . . . . $ 749 $350 $608 $ 491Year ended December 31, 2010 . . . . . . . . . . . . . . . . $1,371 $— $622 $ 749Year ended December 31, 2009 . . . . . . . . . . . . . . . . $1,871 $375 $875 $1,371
F-32


7730 S. Union Park Ave. Suite 500 Salt Lake City, UT 84047 | inContact.com