eiiieieeiiieeeee - dtic
TRANSCRIPT
I? D-0172 434 CORROSIVE-HERR OF BUOY CHAIN(U) COAST GUARD, RESEARCH 1/AND DEVELOPMENT CENTER GROTON CT C A KOHLER ET AL.JUL 86 CGR/DC-US/06 USC-D-21-S6
UNCLSSIFIED F/G11/ NL
II~
EIIIEIEEIIIEEEEE

111 1. 81 2. 5L2
11111 urn11111112.0111111L25 1.41 1111.
MICROCOPY RESOLUTION TEST CHARTNATINAL BURFAU OF STANOARDS-1963-A
L am4 %' \'
Report No.-":
CORROSIVE-WEAR OF BUOY CHAIN .
Craig A. Kohler, Daniel R. May,Thomas H. Briggs, Richard Brown
U.S. COAST GUARD RESEARCH AND DEVELOPMENT CENTERAVERY POINT, GROTON, CONNECTICUT 06340-6096
INTERIM REPORTJuly 1986
This document is available to the U.S. public through theNational Technical Information Service, Spuingfield, Virginia 22161
Prepared for:
U.S. Department Of TransportationUnited States Coast GuardOffice of Research and Development DTIC
Cusp Washington, DC 20593 ELECTE
SEP2 9 1986 ""
86 9 ?9 067Its--
ra 0o-6 7
NOTICE
This document is disseminated under the sponsorship of theDepartment of Transportation in the Interest of Informationexchange. The United States Government assumes noliability for its contents or use thereof.
The United States Government does not endorse products ormanufacturers. Trade or manufacturers' names appear hereinsolely because they are considered essential to the object ofthis report.
The contents of this report reflect the views of the CoastGuard Research and Development Center, which Isresponsible for the facts and accuracy of data presented.This report does not constitute a standard, specification, orregulation.
SAMUEL F. POWE -ITechnical DirectorU.S. Coast Guard Research and Development CenterAvery Point, Groton, Connecticut 06340-6096
-So.9
%'a
,,5,' . ,,, .,-. . .-.-... . . , .-.. , . .. , .-.. . ., .,,,, . . . . o . .. . . ° - -. ,, , . . .- , , , , . ,

Technical Report Documentation Page1. Report No. 2. Government Accession No. 3. Recipient's Catalog No.
CG-D-21-86
4. Title and Subtitle 5. Report DateJULY 1986
CORROSIVE-WEAR OF BUOY CHAIN 6. Performing Organization Code
8. Performing Organization Report No.7. Author(s)
Craig A. Kohler, Daniel R. May, Thomas H. Briggs, Richard Brown CGR&DC 05/86
9. Performing Organization Name and Address 10. Work Unit No. (TRAIS)U.S. Coast GuardResearch and Development Center 11. Contract or Grant No. '
Avery PointGroton, Connecticut 13. Type of Report and Period Covered N
12. Sponsoring Agency Name and Address
Department of Transportation INTERIMU.S. Coast GuardOffice of Research and Development 14. Sponsoring Agency CodeWashington, D.C. 20593 4.
15. Supplementary Notes
16. Abstract
Corrosive-wear, which is responsible for the majority of buoy chain degradation, was investigated in %.%
two laboratory studies. The objective of the first study was to isolate the two components, corrosionand wear, in order to determine each of their influences on the corrosive-wear process on steels. Thesecond study was designed to produce uniform wear on the steel's surface, providing more accuratedata on the steel's wear resistance and to determine the effects of alloy additions. The steel presently ,being used for buoy chain, which is similar in composition to ASTM 1022 steel, was compared to ASTM .
4140, 4340, 8740, and a heat-treated 4140 steel in order to identify a material which would provide a .. 'longer life buoy chain.
The results of the experiments showed that the wear component contributed material losses of oneto two orders of magnitude greater than the corrosion process. It was also determined that the 4340steel would be the most suitable material for longer life buoy chain. This alloy's high nickel content ,would reduce the potential for pitting attack, which can be extremely damaging to a mooring. Themicrostructure of the 4340, with a low ferrite to pearlite ratio and fine grain size, would provide an . .increased wear resistance of up to four times greater than the 1022 steel. Lair r C2. r ro<, i i'
17. Key Words 18. Distribution Statement
CORROSION ABRASION Document is available to the U.S. public throughWEAR BUOY the National Technical Information Service,STEEL Springfield, Virginia 22161CHAIN
19. Security Classif. (of this report) 20. SECURITY CLASSIF. (of this page) 21. No. of Pages 22. Price
UNCLASSIFIED UNCLASSIFIED
Form DOT F 1700.7 (8/72) Reproduction of form and completed page is authorizediii ,.' -,%t-'
ca
EnE
0 c0
6m m~ 0
V) 00 - N -
0 LU 0< 2
60 >j M0(N ((
LLo O~ 0- N %ON-O N 0'Y)
>~~ 0 jo c CL
6. (0
G) ~ U C JI-7 2 0 w
o 0
0--
cu C- .2o. E ~=n 'E En In
0 0
~~~ E 2 E E NEX E---E
Z Co)*0 czz L oz 6L stILL 19L t&6 9
1.D. i'hu1h111: I IIU3
Is9 8 765 4 3 2 1 inches1
0O 0) " NCV0~ E--E
En (U
O~ o i~o 00
I- E~~ En Enn
CD~E E 7C 2 r4 0 c 0
6. L0 LLoE 000o En 0
a). _ VJ U1 co( -vz i c0 c c 0 - U-) U)EE0 C)V) 0
Co~ ~~~ CC Ann 0~( (1)00(. SO ~ (
Coo0)0
o 00
0 -Ccc.-.
00 a. n c C .

TABLE OF CONTENTS
Page
1.0 INTRODUCTION .............................................. 1
1.1 Problem Statement ........................................ 11.2 Objective ................................................ 11.3 Background ................................................ I1.4 Chain Buoy Moorings ...................................... 21.5 Corrosive-Wear Principles ................................ 61.6 Buoy Chain Corrosion Studies ........................... 10
2.0 APPROACH ...................................................... 14
2.1 Simulating the Chain Wear Mechanism ..................... 142.2 Materials ................................................ 15
3.0 EXPERIMENT PROCEDURES ..................................... 24
3.1 Undisturbed Corrosion Tests .............................. 243.2 Corrosive-Wear Tests: Experiment A ....................... 273.3 Corrosive-Wear Tests: Experiment B ....................... 333.4 Microstructure Analysis .................................. 36 .' "
4.0 RESULTS AND DISCUSSION ..................................... 37 " '.
4.1 Undisturbed Corrosion Tests .............................. 374.2 Corrosive-Wear Tests: Experiment A ..................... 46 ..4.3 Corrosive-Wear Tests: Experiment B ..................... 63 .4.4 Microstructure Analysis .................................. 75
5.0 CONCLUSIONS ................................................... 80
5.1 A Final Look......................................... 2 .8.
. %
REFERENCES ......................................................... 85
APPENDIX A - Apparatus Components: Experiment B .................... A-I
Accession For '
NIS GFRA&IDTIC TABUnannouncedJustificatio
ByDistribution/
Availability CodesAvail and/or
Dist Special
v '%
.. ' . '-..o' ' - . ".' . ,- .' .. " " .- .... .... • %- ... ..- " . '. .9. % " .'. ." ,." % '% .. " - . .. " ,.'. - ." - - . " .. ' " . .j • ". - o,,..._..

LIST OF ILLUSTRATIONS
Figure Page
1. Buoy and Mooring ............................................. 4
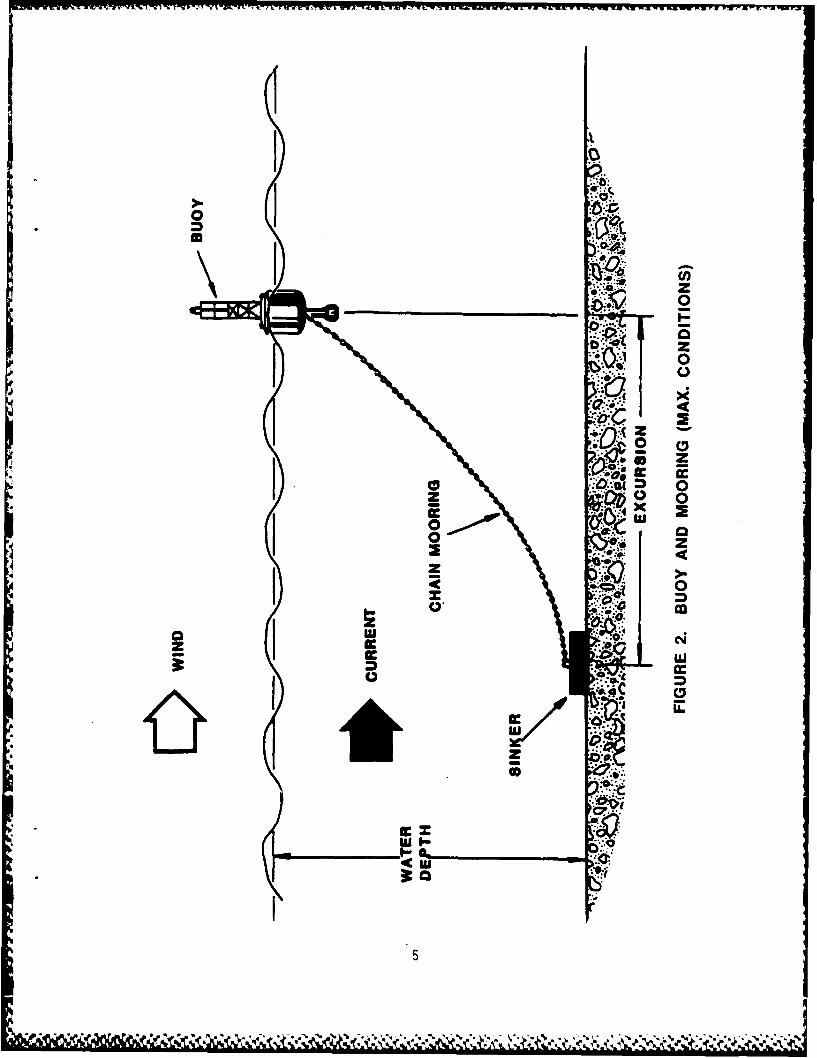
2. Buoy and Mooring (Max. Conditions) ........................... 5
3. Abraded Buoy Chain ........................................... 7
4. Abraded Buoy Chain ........................................... 7
5. Abraded Buoy Chain ........................................... 8
6. Abraded Buoy Chain ........................................... 87. Abraded Buoy Chain ........................................... 9
8. Abraded Buoy Chain ........................................... 9
9. Abraded Buoy Chain ........................................... 9
10. Graph Showing the Percentage Weight Loss vs Time for Four
Test Chains in Fundy Test "C" ........................... 13
11. Microstructure Photo of 1022 Steel (X288)..................18
12. Microstructure Photo of 1045 Steel (X288) .................... 20
13. Microstructure Photo of 1045 (H. Nag.) Steel (X 576) ......... 20
14. Microstructure Photo of 4140 Steel (X288): Experiment A ...... 21
15. Microstructure Photo of 4140 Steel (X288): Experiment B ...... 21
16. Microstructure Photo of 1022 HT Steel (X288) ................. 22
17. Microstructure Photo of 4140 HT Steel (X288) ................. 22
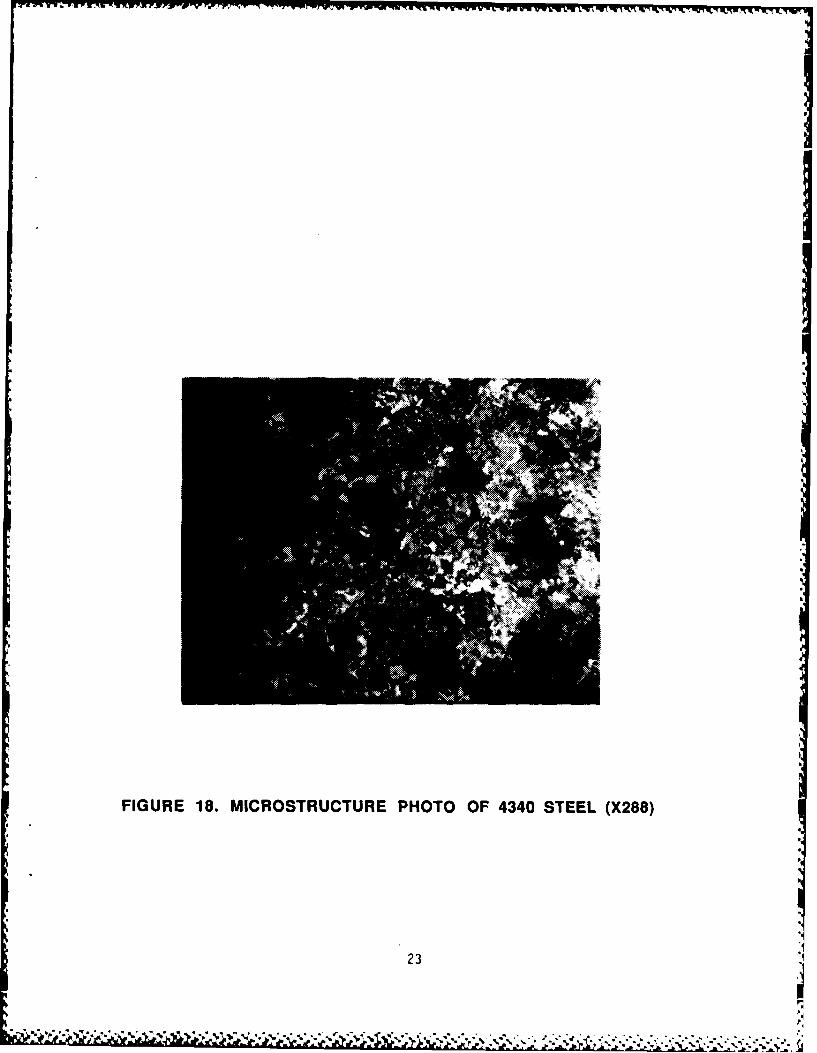
18. Microstructure Photo of 4340 Steel (X288) .................... 23
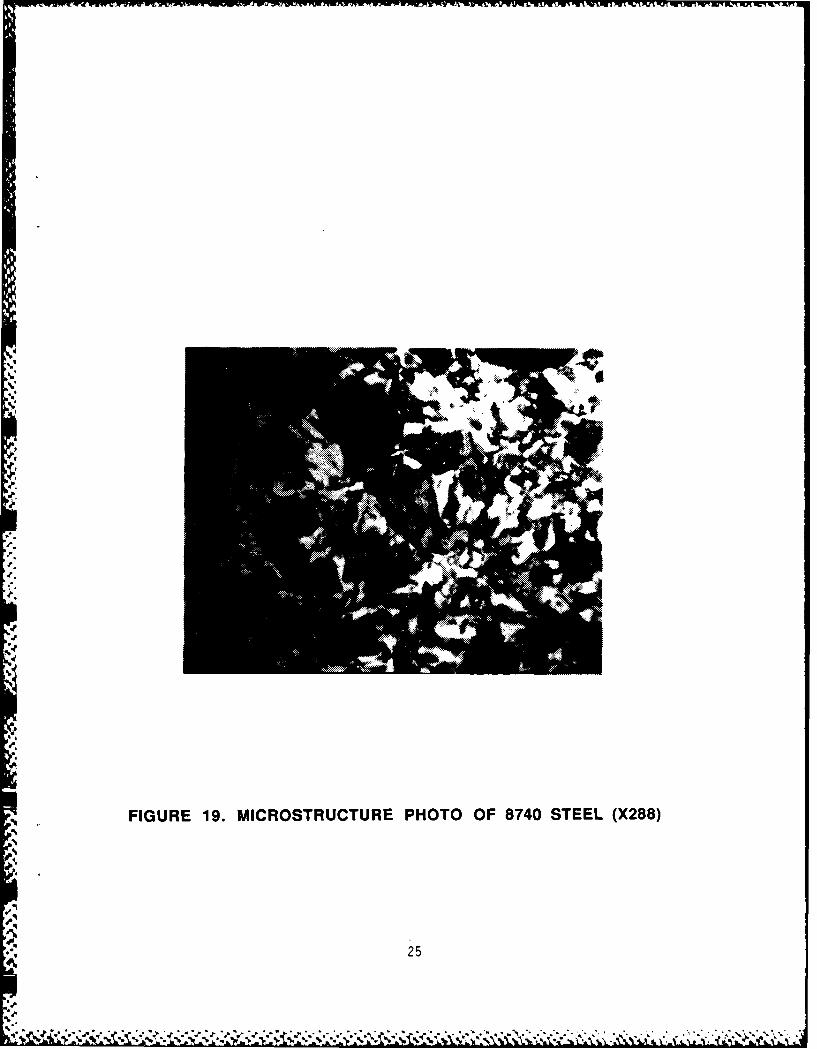
19. Microstructure Photo of 8740 Steel (X288) .................... 25
20. Tank and Motor Setup Apparatus: Experiment A ................. 30
21. Carriage and Specimen Holder Apparatus: Experiment A ......... 31
22. Corrosive-Wear Testing Apparatus: Experiment B ............... 34
23. Carriage and Specimen Holder: Experiment B ................... 35
24. CG 1022 Undisturbed Corrosion in Distilled Water ............. 38
25. CG 1022 Undisturbed Corrosion in Seawater .................... 39
26. CG 1022 (Heat-Treated) Undisturbed Corrosion in Seawater ..... 40
27. CG Ryerson 1045 Undisturbed Corrosion in Distilled Water ..... 41
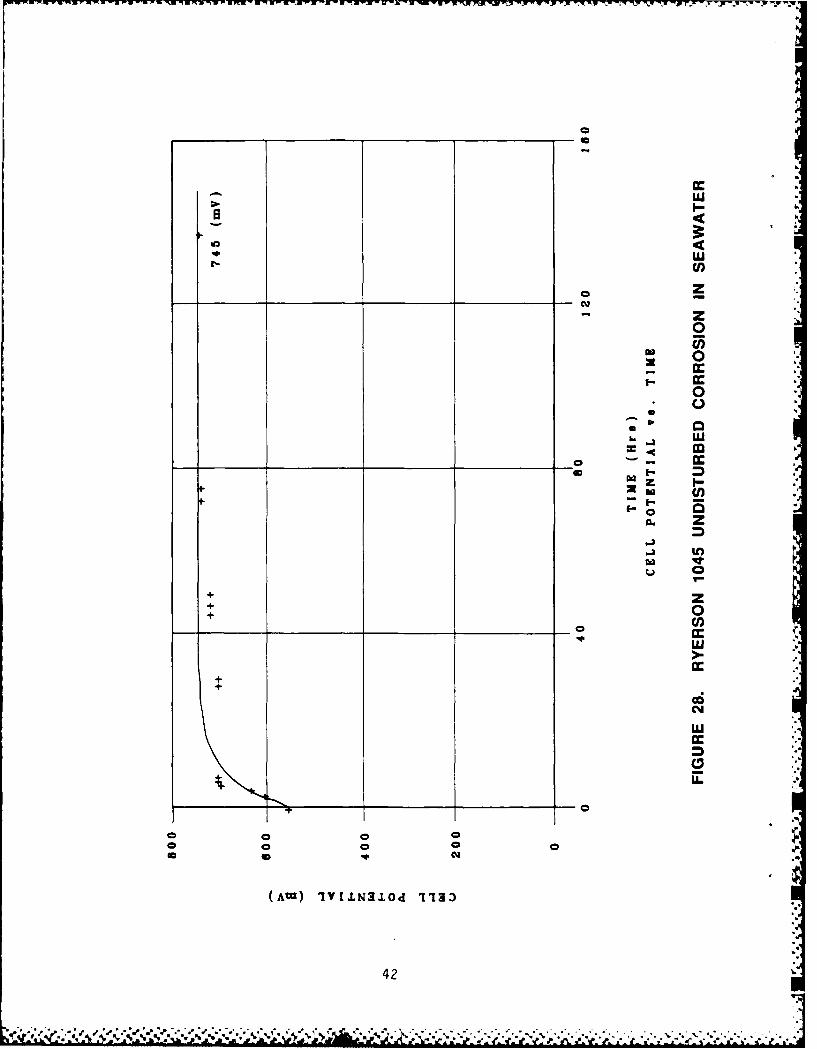
28. Ryerson 1045 Undisturbed Corrosion in Seawater ............... 42
29. Ryerson 4140 Undisturbed Corrosion in Distilled Water ........ 43
vi
: .%. . . . . . . ,- ' , * *J44.) *. -- ... ..". ,. ,, , , .... ,. . . ,. . . ..' , , . . .

LIST OF ILLUSTRATIONS (continued)
Figure Page
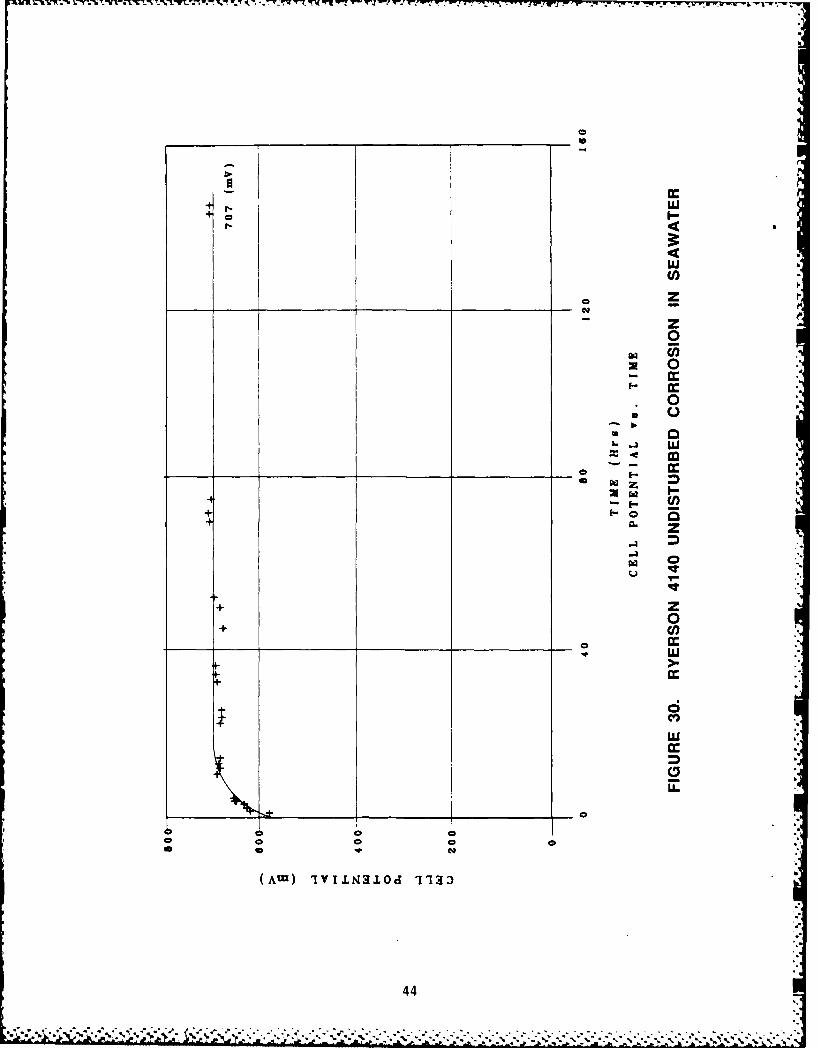
30. Ryerson 4140 Undisturbed Corrosion in Seawater ............... 44
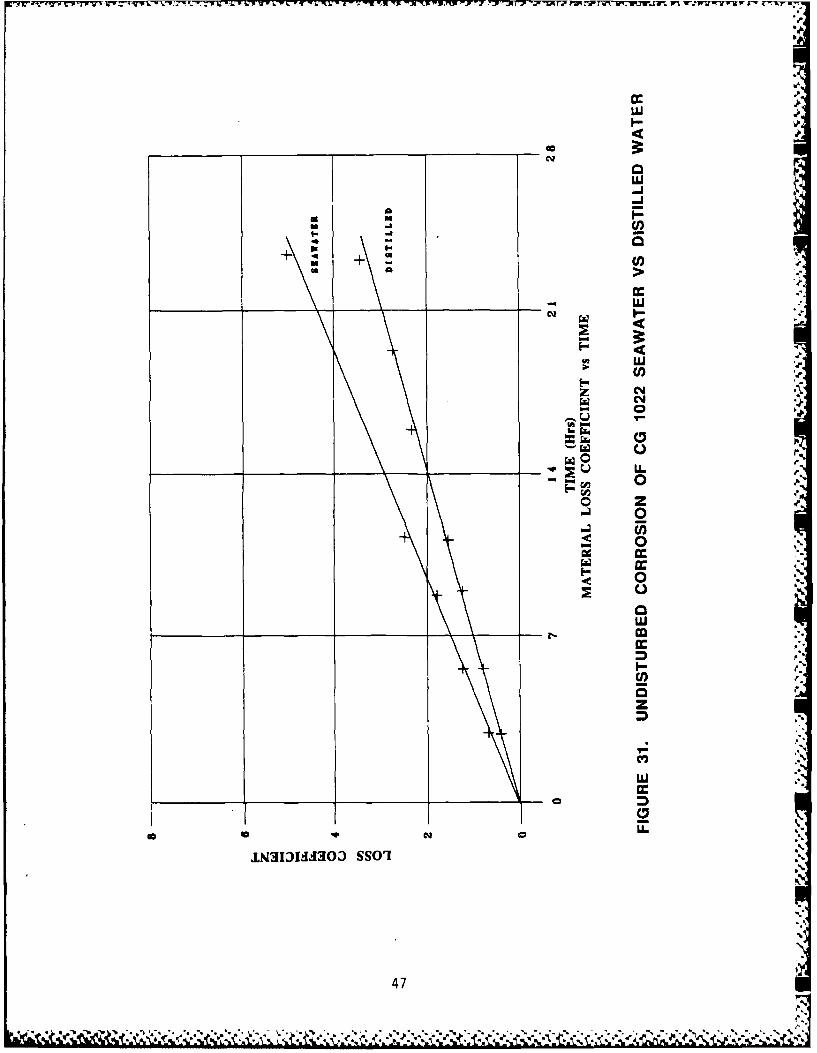
31. Undisturbed Corrosion of CG 1022 Seawater vs
Distilled Water ............................................. 47
32. CG 1022 Corrosive-Wear in Distilled Water .................... 49
33. CG 1022 Corrosive-Wear in Seawater ........................... 50
34. Ryerson 1045 Corrosive-Wear in Seawater ..................... 51
35. Ryerson 4140 Corrosive-Wear in Seawater ...................... 52
36. CG 1022 (Heat-Treated) Corrosive Wear in Seawater ............ 53
37. CG 1022 Corrosive-Wear in Distilled Water .................. 57
38. CG 1022 Corrosive-Wear in Seawater ....................... 58
39. Ryerson 1045 Corrosive-Wear in Seawater ................... 59
40. Ryerson 4140 Corrosive Wear in Seawater ...................... 60
41. CG 1022 (Heat-Treated) Corrosive-Wear in Seawater ............ 61 W.-
42. Corrosive-Wear of CG 1022 in Seawater ........................ 67
43. Corrosive-Wear of ASTh 4140 in Seawater ................... 68
44. Corrosive-Wear of Heat-Treated ASTM 4140 in Seawater ......... 69
45. Corrosive-Wear of ASTM 4340 in Seawater ...................... 70
46. Corrosive-Wear of ASTM 8740 in Seawater ................... 7147. EMhotoofN...................7.
47. SEM Photo of 1022 Abraded Surface (X530) ......... 7648. SEM Photo of 1022 HT Abraded Surface (X530) .................. 76 Z*L
49. SEM Photo of 4140 Abraded Surface (X530) ..................... 77 .- .-
50. SEM Photo of 1022 Corroded Surface (X530) .............. 77
51. SEM Photo of 1045 Corroded Surface (X540) .................. 78
52. SEM Photo of 4140 Corroded Surface (X525) .................... 78
53. SEM Photo of 1022 HT Corroded Surface (X530) ................. 79
54. SEM Photo of 1045 Interface Surface (X530) ................. 79
v.
vi i .. ;
i# .%" U.
-.,, ,,.
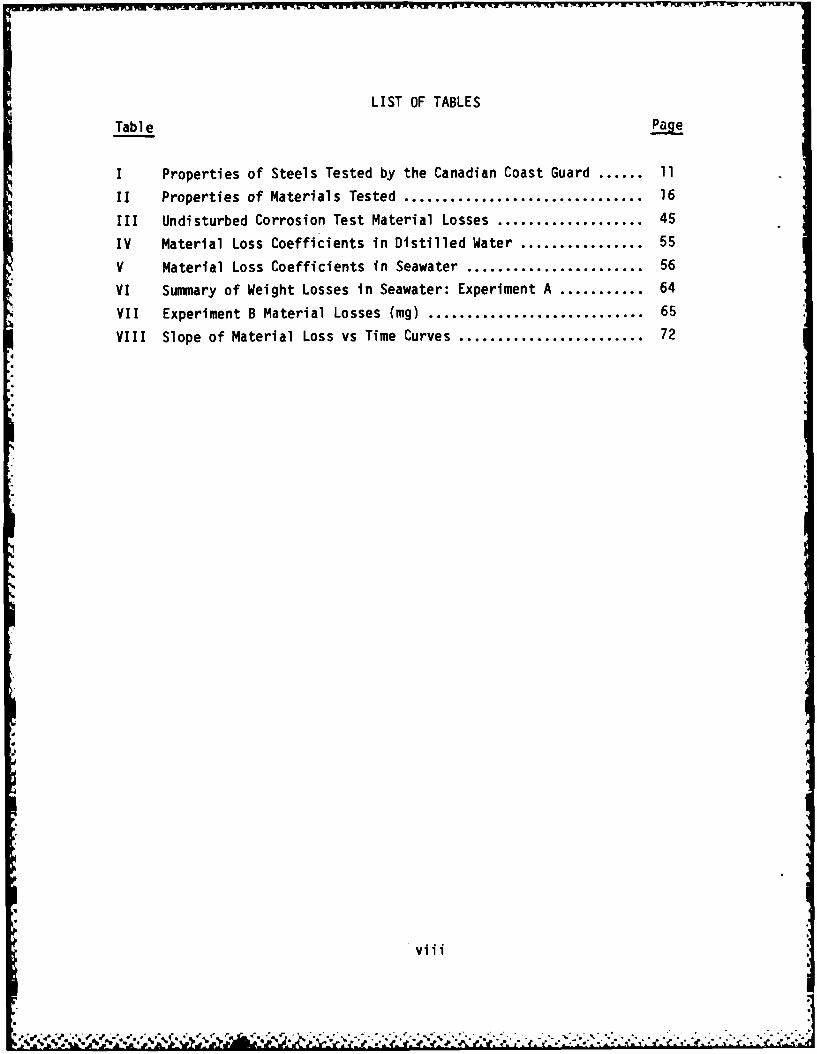
LIST OF TABLES
Table Page
I Properties of Steels Tested by the Canadian Coast Guard ....... 11
I1 Properties of Materials Tested .............................. 16
III Undisturbed Corrosion Test Material Losses ................... 45
IV Material Loss Coefficients in Distilled Water ................ 55
V Material Loss Coefficients in Seawater...................... 56
VI Summary of Weight Losses in Seawater: Experiment A ............ 64
VII Experiment B Material Losses (mg) ........................... 65
VIII Slope of Material Loss vs Time Curves....................... 72
viii
1.0 INTRODUCTION
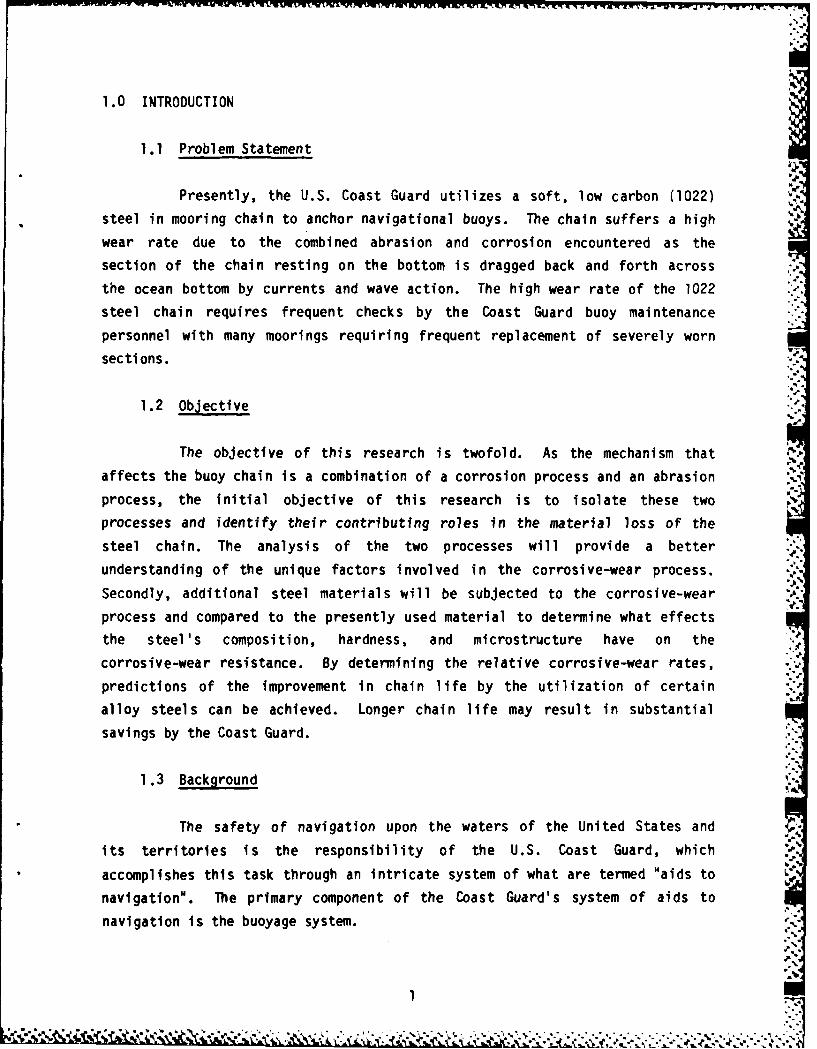
1.1 Problem Statement
Presently, the U.S. Coast Guard utilizes a soft, low carbon (1022)
steel in mooring chain to anchor navigational buoys. The chain suffers a high
wear rate due to the combined abrasion and corrosion encountered as the
section of the chain resting on the bottom is dragged back and forth across
the ocean bottom by currents and wave action. The high wear rate of the 1022
steel chain requires frequent checks by the Coast Guard buoy maintenance
personnel with many moorings requiring frequent replacement of severely worn
sections.
1.2 Objective
The objective of this research is twofold. As the mechanism that
affects the buoy chain is a combination of a corrosion process and an abrasion
process, the initial objective of this research is to isolate these two
processes and identify their contributing roles in the material loss of the
steel chain. The analysis of the two processes will provide a better
understanding of the unique factors involved in the corrosive-wear process.
Secondly, additional steel materials will be subjected to the corrosive-wear
process and compared to the presently used material to determine what effects
the steel's composition, hardness, and microstructure have on the
corrosive-wear resistance. By determining the relative corrosive-wear rates,
predictions of the improvement in chain life by the utilization of certain
alloy steels can be achieved. Longer chain life may result in substantial
savings by the Coast Guard.
1.3 Background
The safety of navigation upon the waters of the United States and
its territories is the responsibility of the U.S. Coast Guard, which
accomplishes this task through an intricate system of what are termed "aids to
navigation". The primary component of the Coast Guard's system of aids to
navigation is the buoyage system.
,'1

The importance of the buoy remaining on its charted position and
attached to its mooring cannot be understated. Buoys mark the "highways" of
the ocean in the same manner as painted lines and curbs mark roadways onland. They are relied and depended upon twenty-four hours a day by mariners
who expect uninterrupted service of accurat:'v placed buoys. If a buoy is
missing from its station, there is the potential for a breakdown in the safe
navigation of the marine industry. The possibility of a vessel grounding is
increased together with the possibility of a collision with another vessel.Each year vessel groundings and collisions result in millions of dollars
expended in the form of damage to vessels, pollution of the marine
environment, and in some cases, loss of life. Occasionally, lawsuits have
been brought against the U.S. Government and the Coast Guard in marine
accidents alleging missing or misplaced buoys resulting in the cause of the
mishap. Although invariably it is shown in most cases that human error is the
ultimate cause in marine casualties, nevertheless, the importance of the
buoyage system and ultimately the mooring system remains critical.
Today, the aids to navigation mission, including the system of
buoyage, employs eighty vessels and forty bases. Over 23,000 buoys arecurrently in service as of January 1984. The mission requires approximately
twenty percent of the Coast Guard's resources with a budget of $150 million
and a manning of over 8,500 persons [3].
1 .4 Chain Buoy Moorings
Although the system of buoyage has seen rapid technical progress,
the use of steel chain as the material in the mooring of the buoys has
essentially remained the same. The beginning of chain use is lost in history
and as with many other basic mechanisms, the inventor and the date of origin
are unknown. Steel chain was first used in the early moorings of navigational
buoys and has continued in use to the present day [4].
The chain presently used by the Coast Guard for buoy moorings is a
welded-link chain. Welded-link chain consists of interconnected endless loops
of elliptical shape. The loops are made in automatic forming machines that
cut the bar material to the correct blank length, bend the blank into the link
2
shape, thread another blank through the previously formed link, then repeat
the process. After forming, the links are put together in shots (lengths of
ninety feet) by one of several butt-welding processes.
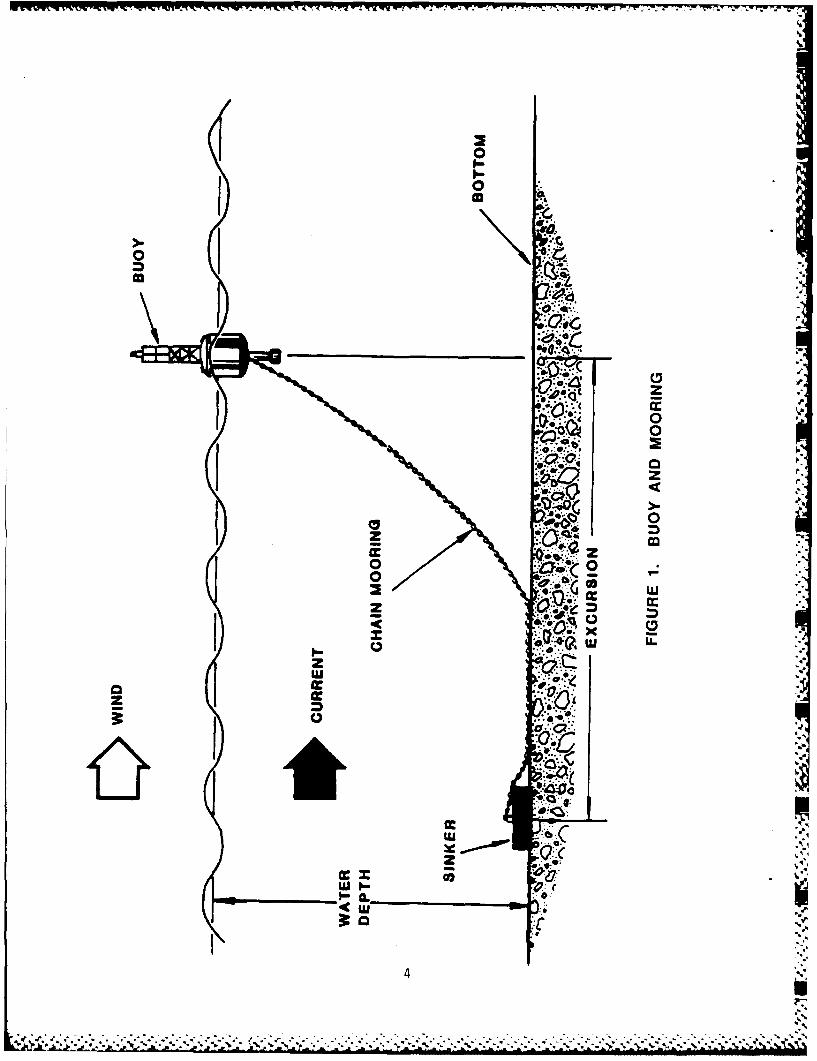
The complete mooring system includes the chain attached to the buoy
and a large concrete sinker. The buoy and its mooring system are shown in
Figure 1.
A buoy moored in this fashion in the marine environment is subjected
to wind, wave, and current forces which act directly on the buoy. The result
of these forces is that the buoy, connected to the concrete sinker via the
steel chain, is set into nearly constant movement. Even in extremely calm
weather conditions, the buoy is still subject to tidal currents and waves
caused by passing vessels. The constant movement of the buoy transmits motion
to the attached length of chain. Also, below the surface, subsurface currents
act on the chain and the concrete sinker. Both sections of the chain are
therefore nearly constantly in motion. The section suspended in seawater
follows the buoy while the section near the sinker is dragged along the sea
bottom.
When buoys are deployed, the length of chain used for the mooring is
determined by the particular type buoy being used, the water depth, the bottom
type, and the marine environment where the buoy is being placed. The marine
environment takes into account local winds, waves, and currents that can be
expected for that location. The mooring is designed so that under the most
severe designed environmental conditions, the entire length of chain is
completely off the bottom with no upward angle at the sinker [5] as shown in
Figure 2. As conditions diminish, subsequent amounts of chain will fall to
the ocean bottom. Normally, the average amount of chain used at most
locations is approximately two to three times the depth of water where the
buoy is being deployed.
The chain used by the Coast Guard is carefully tested to ensure that
the breaking strength of the chain safely exceeds the design loads anticipated
in the actual buoy moorings. However, once the chain is placed on station
with the buoy in the marine environment, the corrosive-wear process begins to
3
*.Irv 2- - 7 - . * --
It
01
0
a
00
00
cc~
cc~
wwCz0j
co 0_ _ _ _ _ _ _ 0
C4
zz
us F
a4

act on the chain. This process occurs when the chain is dragged across the
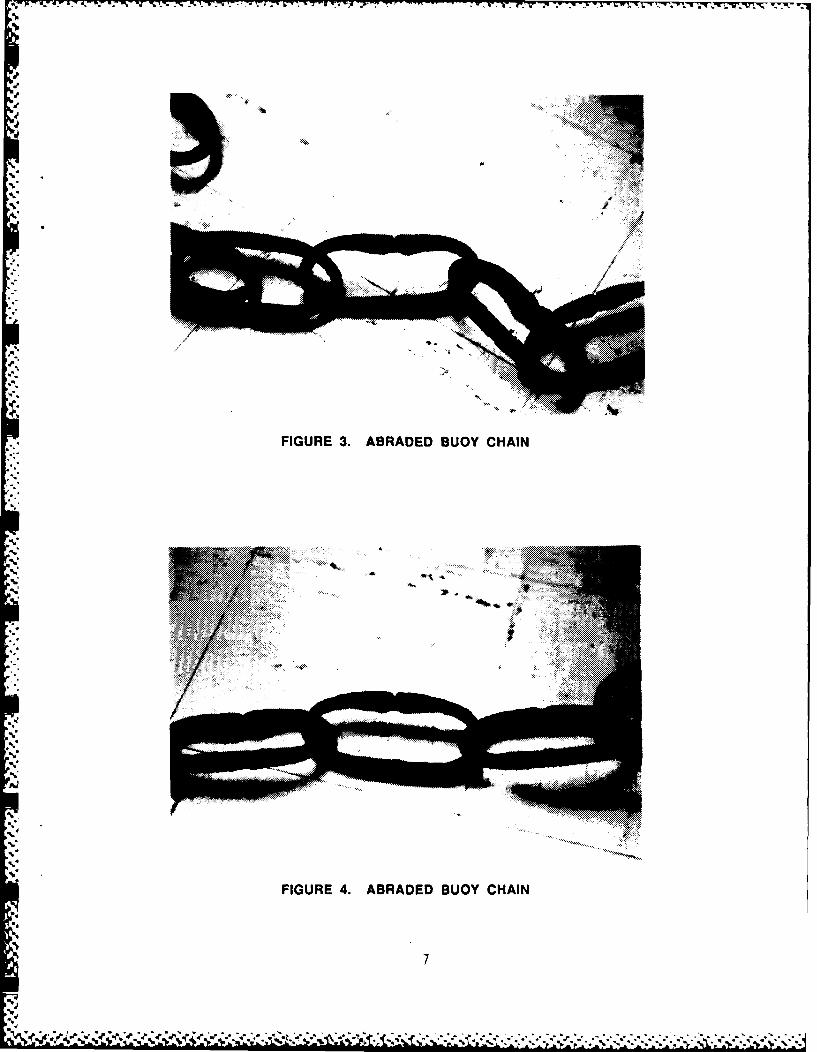
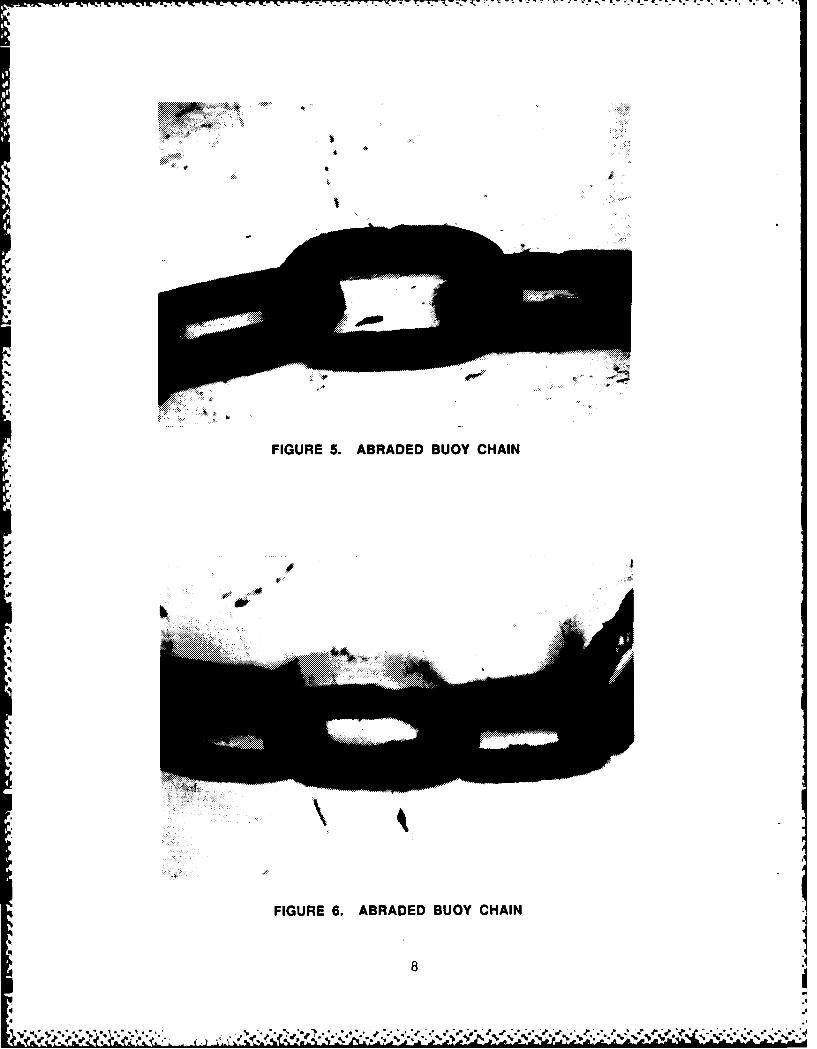
sea bottom during buoy motion. If severe enough, large amounts of material in
the bottom links of the mooring chain can be lost by corrosive-wear in
relatively short periods of time. Material loss can result in tensile
stresses on the link in excess of the link's breaking strength. Figures 3
through 9 graphically illustrate several buoy chain moorings which have
undergone severe reductions in area. If this occurs, there is a high
probability that ultimately a link will rupture due to the increased load felt
on the link. Failure of the link may also occur as a result of fatigue due to
the constant cyclic loading on the worn link. Because most moorings are lost
when a buoy breaks its chain, there has been little research into the possible
cause of the failure.
There is evidence that the early buoy and lighthouse tenders became
aware of this problem as early as the late 1800's. Although most buoy
moorings only required one inch to one and one-half inch diameter steel chain,
it was standard practice to place chain of two and one-quarter to two and
one-half inch diameter in the section of the mooring resting on the bottom,
which is referred to as the chafe section [4]. This was obviously done in
order to help compensate for the anticipated high loss of material and
subsequent reduction in area resulting in an increased load on the chain links.
Failure of the mooring chain results in the buoy being released and
set adrift. Not only does this reduce the effectivenes of the buoyage system
of safe navigation, it results in the possible damage or total loss of the
buoy.
1.5 Corrosive-Wear Principles
Corrosive-wear is a corrosion phenomenon involving two surfaces in
contact with each other while subjected to a corrosive medium. It results in
an accelerated rate of deterioration on a metal surface.
Wear involves two surfaces in contact with each other, usually with
one surface not as hard as the other and therefore subject to material loss
[6]. A driving mechanism is present to initiate motion between the two
6
61,7
pp
Ia.I,
a'
.14 44
'Sb. ->
4' 1
'S
P
-S
If
FIGURE 3. ABRADED BUOY CHAIN
paa-'a
'S
a-
* A;'
a.
-bSb
a'.
Al
a.
S'S.
S..
FIGURE 4. ABRADED BUOY CHAIN
5~
Sb
7
-p.,.55
'5"
- -. 5- S - a - - S - -5. % a* W..a~a a~a *~q*i'~~Sri
5a--a 4 ~ '
%TJ ~ ~ ~ ~ IGR S. ABRDE BUO CHAIN r.u q ~rf 7 -7 - 7 j; jff 7~
......
FIGURE 5. ABRADED BUOY CHAIN
-~ A.
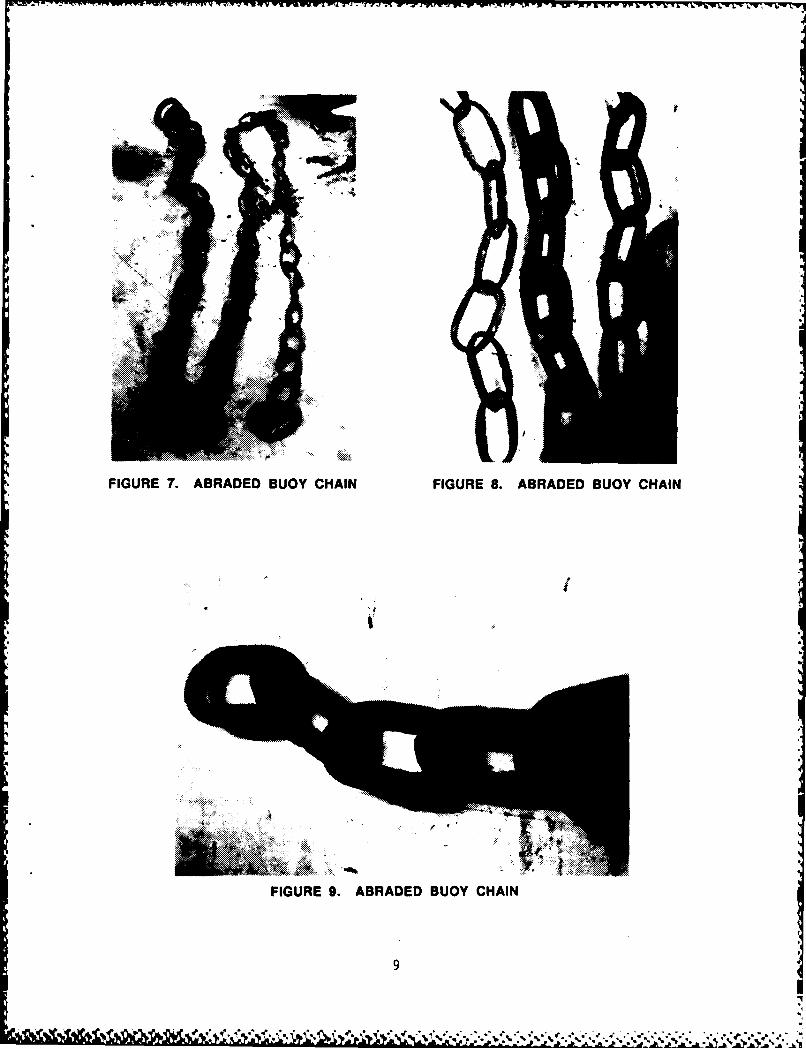
FIGURE 7. ABRADED BUOY CHAIN FIGURE 8. ABRADED BUOY CHAIN
FIGURE 9. ABRADED BUOY CHAIN
9.

surfaces, setting up the abrasion process. The attack by the corrosive medium
provides for a surface layer to form due to corrosion on the metal surface
which can be easily abraded from the surface. As each new layer of corrosion
products is formed, it too is eventually removed from the metal. The
continual process results in a high loss of metal material. When the surface
layer is removed, the newly exposed area of the metal is also subject to being
directly abraded as it remains in contact with the abrading surface.
The degradation of buoy chain occurs in the same fashion. As the
chain is moved about the ocean bottom, the soft porous layer on the links is
removed by the abrasive surface of a sandy or rocky bottom and falls away from
the steel links. The newly exposed metal area is then subject to a direct
abrading process with the sand or rock particles. When the chain does become
stationary, a new surface layer will form.
Most metals and alloys are susceptible to this type of
corrosive-wear mechanism or other similar forms of erosion-corrosion. Many
metals depend upon the formation of a surface layer for resistance to
corrosion in the phenomenon called passivation [7]. As the thin passivating
layer is removed by abrasion, these materials are normally rendered useless
since the abrasive mechanism destroys the protective layer.
Soft metals are usually more susceptible to the corrosive-wear
process than hard metals because they are more vulnerable to wear from the
abrasive component of the process. This is commonly true of the low carbon
content steels [7]. Inherently hard metals therefore usually provide better
protection than soft metals in an abrasion dominated process.
1.6 Buoy Chain Corrosion Studies
Problems with the corrosive wear of buoy chain have also been
investigated by the Canadian Coast Guard [8]. Commencing in 1954, a series of
five tests over an 8-year period were conducted in the Bay of Fundy. The
location was selected for its dynamic range of tides and strong currents. The
severity of the environment was emphasized by the loss of the first two test
buoys. The testing utilized various plain carbon and alloy steels on full
length and composite moorings as shown in Table I.
10
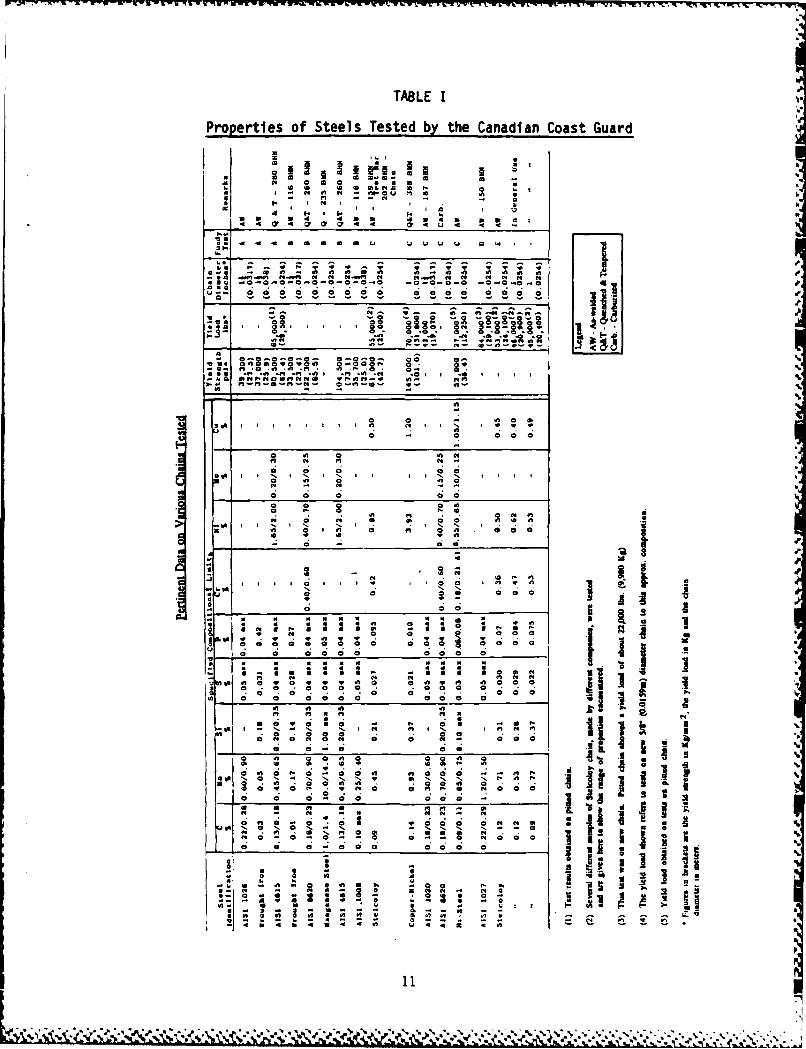
TABLE I
Properties of Steels Tested by the Canadian Coast Guard
IN
.04'
40~ ~ W4- 01 10-M 1 a4 oIn
* N~ --- -- -0 0--0-0 -0-0.0 -0
"0 INI2, 4 N N N
a4 00 0 0 ~ ~m 00. 00 4.0. 0 0~
S*ON OO WO O 0'00 0. a,2 a0i4iaN .0 N.N. . . N O . 0
V I N N ON N 4N N. N- Nfl 0-a
U2 0 -ci 0i N
00 0 0 00
0 0 0; 0 0 a
0' 0 0, ON ,a0; N 0 0
- 0 -C" 0 0 0
- 0
2. CJ 4 .4 m

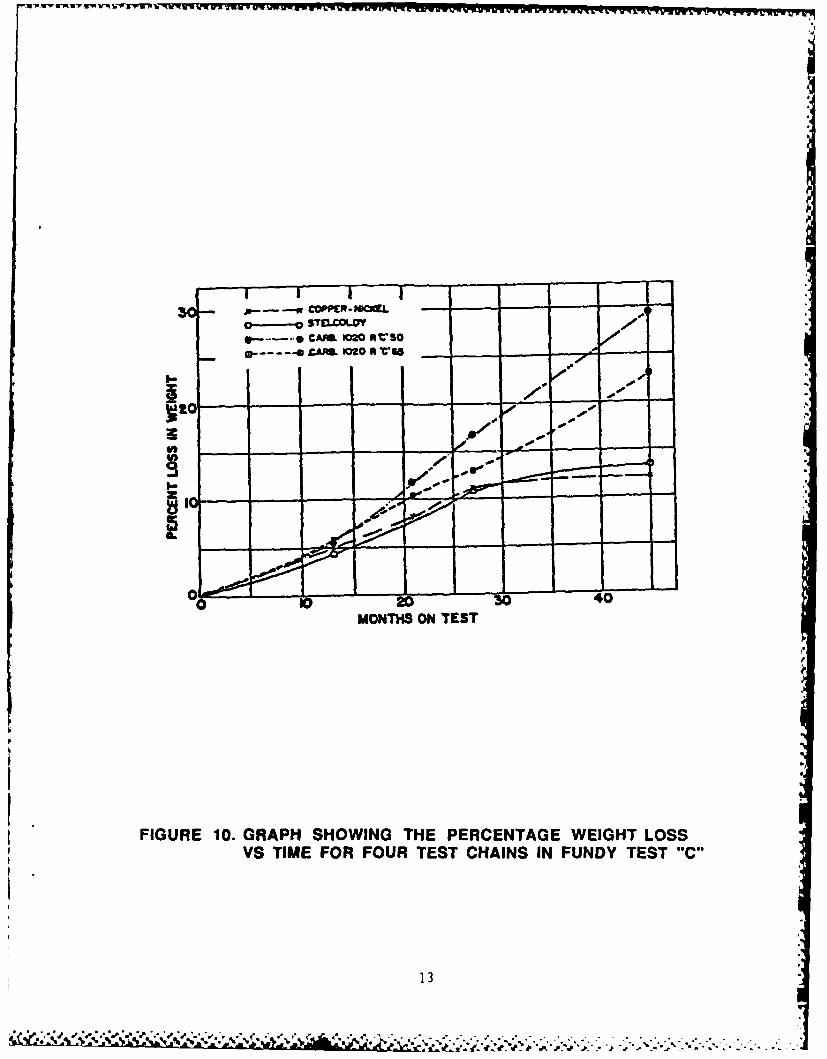
Although the testing was somewhat inconclusive, the materials that
showed the most promise were Stelcolony, which is available commercially, and
a higher content copper-nickel steel alloy. A comparison beteen these two
alloys and heat-treated AISI 1020 steel is shown in Figure 10. In the first
twenty-seven months the alloy steels lost approximately ten percent of their
weight. The AISI 1020 samples lost from thirteen to seventeen percent and
continued to corrode so that after forty-five months the losses were near
twenty-five percent. The reductions in weight loss over time for the alloy
steels (Cu-Ni and Stelcolony), as demonstrated in Figure 10, are attributed to
the passivity of the steels, which forms a tightly adherent oxide layer on the
surface. Barrel wear was not examined on these particular chains.
All the other alloy steels tested showed susceptibility to pitting.
The AISI 4615 exhibited extensive pitting after only six and one-half months.
In another test, chains of carburized AISI 8620 and AISI 1020 steel were. declared unserviceable after thirteen months of exposure. Pitting was also
evident on the Stelcolony samples. It was concluded that a nickel content of
at least 0.58% was necessary to reduce pitting corrosion significantly.
By examination of the chains following testing, it was determined
that the main causes of chain degradation were pitting corrosion, inter-link
wear, and barrel wear. Barrel wear occurs due to the abrasion of the sides of
the chain against a rough bottom surface. Inter-link wear is caused by the
friction between connecting links. It was concluded that future mooring chain
selection should be based primarily on general corrosion resistance and
especially pitting corrosion. Failure of the mooring may result from pitting
rather than overall weight loss. Secondly, the chain should have good wear
resistance especially on bottom sections where the barrel wear occurs. By
proper selection of alloy in elements, significant improvement in strength and
wear resistance can be obtained.
Following the Bay of Fundy test program, the Canadian Coast Guard
Implemented 1-1/8 inch diameter alloy steel chain replacing the 1-1/4 and
1-1/2 inch diameter mild steel chains on many buoy moorings across Canada.
Results have been highly favorable in most cases with certain exceptions.
Intergranular corrosion of the alloy chain was observed in a few isolated
cases. This was attributed to either improper bar rolling at the steel plant
12-aI
-~ -w - - LIM FVTV - -
3-
MO0h ONTS
FIGURE ~ CA 10. GRPmHWIGTEPRCNAEWEGTLSVS TIME ZFOlZRVU ETCHISI UNYTS C
000
* *-.,9 %* % % % V*. ~ V ~ ~ Y - - *.- ../ . 001 lop .v .
or the presence of certain chemicals in the water. Prevention could be
accomplished through post-forming heat treatment.
Largely, it was observed that the alloy steel chain, with great
strength and wear resistance or even equivalent performance to mild steel,
allowed for buoy mooring down-sizing to obtain equal or better station life at
a reduced cost.
2.0 APPROACH
2.1 Simulating the Chain Wear Mechanism
Before selecting the alternative steels to compare with the
presently used 1022 steel, the task of designing the test apparatus was
undertaken. The uniqueness of the corrosive-wear mechanism affecting buoy
mooring chain makes it a difficult process to simulate.
Ideally, full-scale field tests on actual buoys would provide the
most reliable data; however, these tests would require at least two full years
under ideal conditions. An accelerated model of this process would provide
valuable data in a relatively short period of time.
From Coast Guard buoy tender reports it was clear that the
dominating factor in the process is the constant movement of the steel chain
across the abrasive bottom. This movement not only removes the protective
oxide layer formed on the chain links, it also directly abrades the steel
links themselves. To simulate this type movement, a horizontal displacement
motor was selected to provide the driving force for movement of the steel
specimens during the tests. The motor provided a back and forth reciprocal
motion similar to the motion actual chain moorings experience. A motor with a
relatively low rpm ratio was chosen so as to provide a realistic approach to
the actual frequency movement of the buoy chain. The Bodine motor chosen
operated at 29 rpm, thus the steel specimen is cycled across the abrasive
field approximately once every two seconds. This would correspond to a
mooring chain attached to a buoy experiencing waves with 2-second periods.
For most buoys, the wave periods associated with the maximum environmental
conditions range from one second to ten seconds. Thus, with the use of the
14

Bodine motor at 29 rpm, the abrasion process, which is dependent on frequency,
simulated a realistic situation that would occur to an actual buoy chain
mooring under its near maximum design conditions.
Depending on the location where the buoy is stationed, the attached
chain may rest on a sandy, muddy, rocky, or combination type bottom. Over the
years, reports from Coast Guard field units have indicated that rocky and
sandy type bottoms produce increased wear on chain moorings over soft or muddy
bottoms. To simulate a sandy or rocky type bottom, an abrasive surface with
approximately the same hardness and particle size should be used since wear
rates are dependent on these factors. Since the testing utilized the same
type of abrasive for each specimen, the abrasive characteristics were not
critical.
Simulation of the chain wear mechanism was carried out in two
different laboratory testing schemes. The first set of experiments were
conducted in 1984 and will be referred to in the subsequent text as Experiment
A. The second set of tests completed in 1985 will be referred to as
Experiment B.
2.2. Materials
The steels selected for use in Experiment A for comparison with the
presently used 1022 steel were 1045 and 4140 grade steels. These two grade
steels were chosen to investigate the effect of increasing carbon content with
the 1045 steel and the effect of alloying at about the same carbon content
with the 4140 steel. A third approach was to examine the effect on a
martensitic structure by heat-treating the 1022 steel. Table II provides all
pertinent data on the selected steels.
Selection of the two comparison steels was geared towards providing
similar type material composition yet increasing the structural strength and
hardness. It is theorized that a similar but structurally harder material
will provide a lesser wear rate due to an increase in wear resistance. By
heat-treating the 1022 steel, a martensitic microstructure was obtained, thus
also producing a structurally harder material than the original 1022 steel.
15
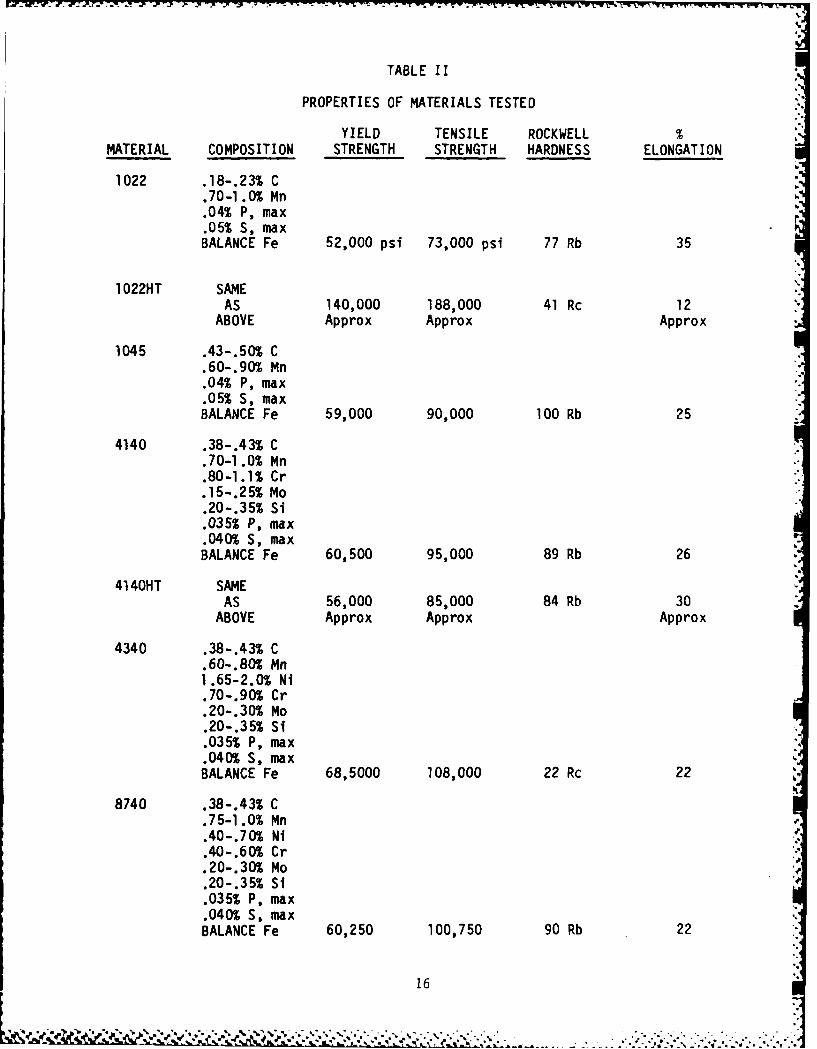
TABLE II
PROPERTIES OF MATERIALS TESTED
YIELD TENSILE ROCKWELL %MATERIAL COMPOSITION STRENGTH STRENGTH HARDNESS ELONGATION
1022 .18-.23% C.70-1.0% Mn.04% P, max ,.05% S, maxBALANCE Fe 52,000 psi 73,000 psi 77 Rb 35
1022HT SAMEAS 140,000 188,000 41 Rc 12
ABOVE Approx Approx Approx
1045 .43-.50% C.60-.90% Mn.04% P, max.05% S, maxBALANCE Fe 59,000 90,000 100 Rb 25
4140 .38-.43% C.70-1.0% Mn.80-1.1% Cr.15-.25% Mo.20-.35% Si.035% P, max.040% S, maxBALANCE Fe 60,500 95,000 89 Rb 26
4140HT SAMEAS 56,000 85,000 84 Rb 30
ABOVE Approx Approx Approx
4340 .38-.43% C.60-.80% Mn1 .65-2.0% Ni.70-.90% Cr.20-.30% Mo.20-.35% Si.035% P, max.040% S, maxBALANCE Fe 68,5000 108,000 22 Rc 22
8740 .38-.43% C.75-1.0% Mn.40-.70% Ni.40-.60% Cr.20-.30% Mo.20-.35% Si.035% P, max.040% S, maxBALANCE Fe 60,250 100,750 90 Rb 22
16
.ru , im VIw r - Tv - -VJ. * -Tr.WV a -. --- '.:-; -- .- y m wv
In Experiment B the steels were selected in order to determine the
effects of various alloy additions on hardness and microstructure. The
following alloy steels were chosen to compare with the presently used 1022
steel: ASTM 4140, heat-treated 4140, 4340, and 8740. All the alloy steels
contain approximately the same amount of carbon. Their respective properties
are also shown in Table II.
Presently, the Coast Guard purchases steel in quarterly contracts
through a specification for mooring U.S. Coast Guard buoys, Specification No.
377. Qualified steels for use in the production of the buoy chain are
referenced to a Federal military specification. The military specification
used, MIL-S-16974, is for any grade carbon or alloy steel as long as the steel
meets the proof load and breaking load requirements in the buoy mooring
specifications. All the comparison steels chosen would be appropriate"qualified" steels for buoy mooring chain according to these two
specifications.
The 1022 steel used in this research was obtained through several
unused links of one and one-quarter inch diameter chain provided by the Coast
Guard. Specimens were cut from the linear sections of the links. Specimens
from the other steels were cut from bar stocks of the same diameter as the
chain links and were obtained from local manufacturers.
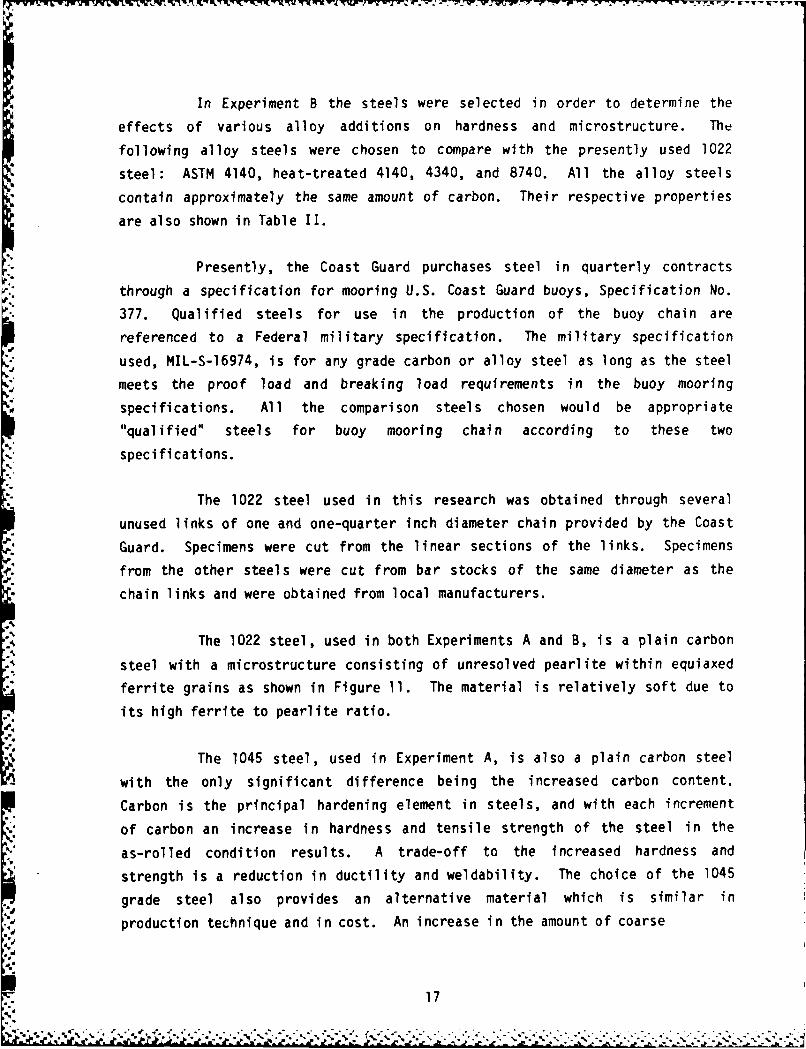
The 1022 steel, used in both Experiments A and B, is a plain carbon
steel with a microstructure consisting of unresolved pearlite within equiaxedferrite grains as shown in Figure 11. The material is relatively soft due to
its high ferrite to pearlite ratio.
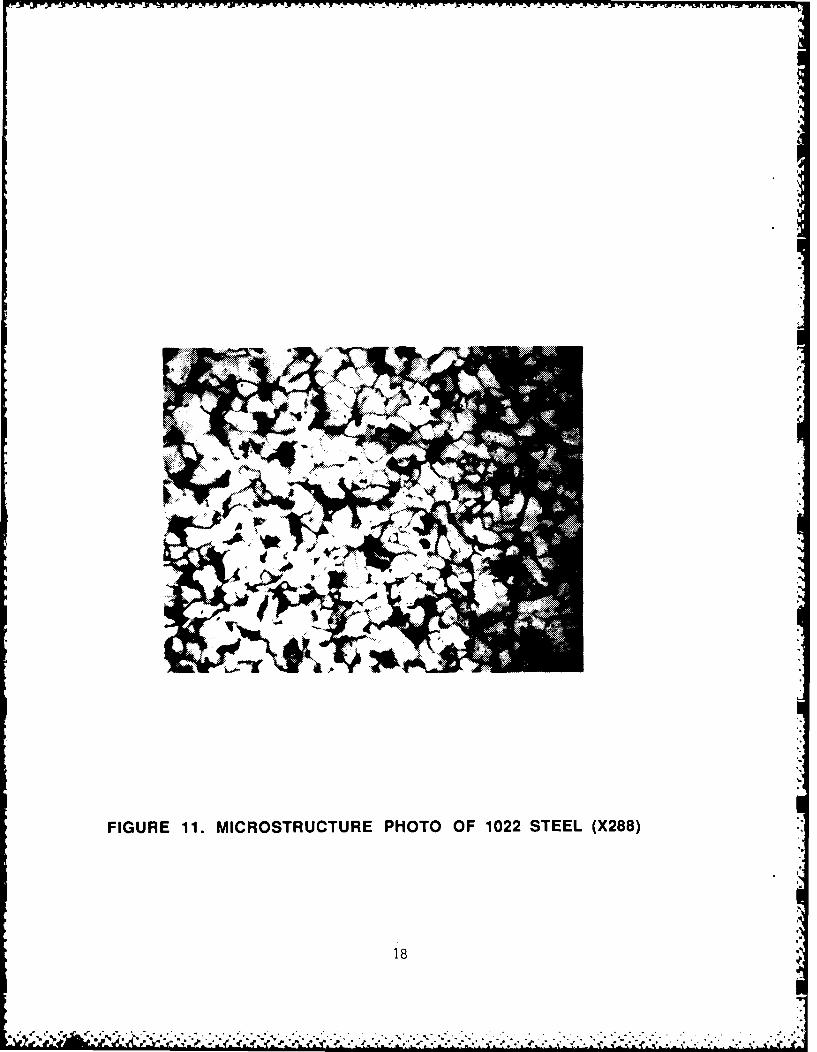
The 1045 steel, used in Experiment A, is also a plain carbon steel
with the only significant difference being the increased carbon content.
Carbon is the principal hardening element in steels, and with each increment
of carbon an increase in hardness and tensile strength of the steel in the
as-rolled condition results. A trade-off to the increased hardness and
strength is a reduction in ductility and weldability. The choice of the 1045
grade steel also provides an alternative material which is similar in
production technique and in cost. An increase in the amount of coarse
17
W~~ ~ 4-v ~' . - j ~ ~. ~,
FIGURE 11. MICROSTRUCTURE PHOTO OF 1022 STEEL (X288)
18
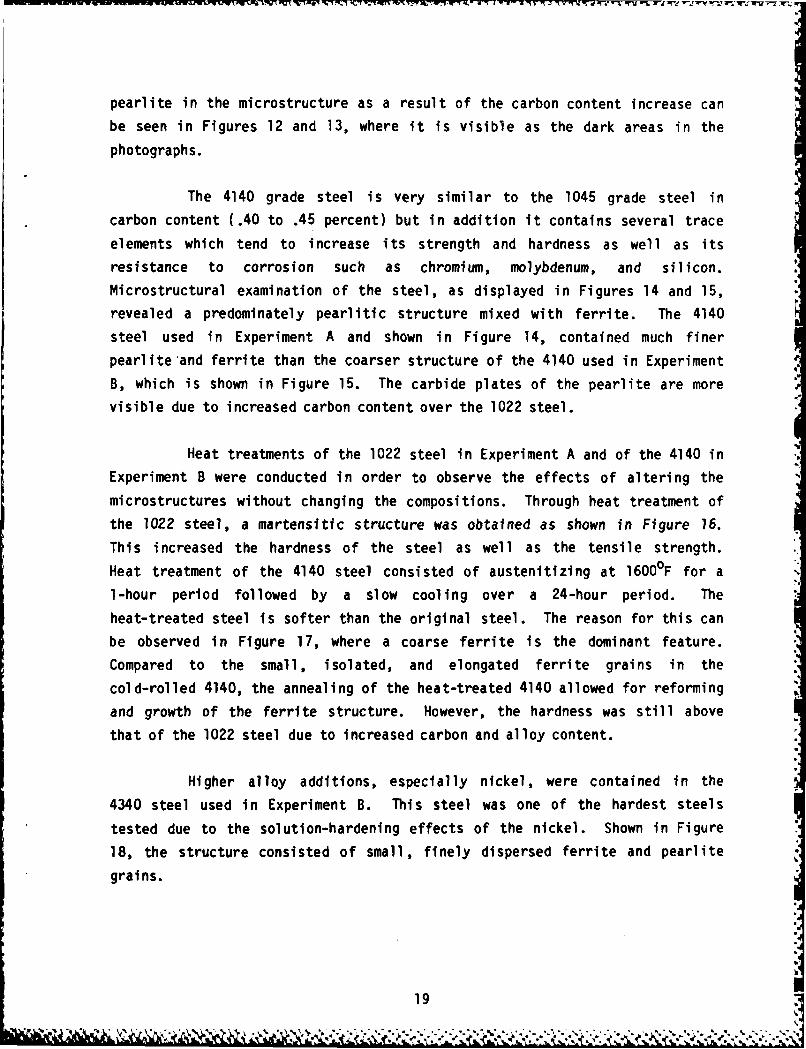
pearlite in the microstructure as a result of the carbon content increase can
be seen in Figures 12 and 13, where it is visible as the dark areas in the
photographs.
The 4140 grade steel is very similar to the 1045 grade steel in
carbon content (.40 to .45 percent) but in addition it contains several trace
elements which tend to increase its strength and hardness as well as its
resistance to corrosion such as chromium, molybdenum, and silicon.
Microstructural examination of the steel, as displayed in Figures 14 and 15,
revealed a predominately pearlitic structure mixed with ferrite. The 4140
steel used in Experiment A and shown in Figure 14, contained much finer
pearlite and ferrite than the coarser structure of the 4140 used in Experiment
B, which is shown in Figure 15. The carbide plates of the pearlite are more
visible due to increased carbon content over the 1022 steel.
Heat treatments of the 1022 steel in Experiment A and of the 4140 in
Experiment B were conducted in order to observe the effects of altering the
microstructures without changing the compositions. Through heat treatment of
the 1022 steel, a martensitic structure was obtained as shown in Figure 16.
This increased the hardness of the steel as well as the tensile strength.
Heat treatment of the 4140 steel consisted of austenitizing at 1600°F for a
1-hour period followed by a slow cooling over a 24-hour period. The
heat-treated steel is softer than the original steel. The reason for this can
be observed in Figure 17, where a coarse ferrite is the dominant feature.
Compared to the small, isolated, and elongated ferrite grains in the
cold-rolled 4140, the annealing of the heat-treated 4140 allowed for reforming
and growth of the ferrite structure. However, the hardness was still above
that of the 1022 steel due to increased carbon and alloy content.
Higher alloy additions, especially nickel, were contained in the
4340 steel used in Experiment B. This steel was one of the hardest steels
tested due to the solution-hardening effects of the nickel. Shown in Figure
18, the structure consisted of small, finely dispersed ferrite and pearlite
grains.
19"
19?
---------
FIUE1.MCOTUTR POOO 05SEL(28
.*FIGURE 1. MICROSTRUCTURE PHOTO OF 1045 A STEEL (X 6)
20
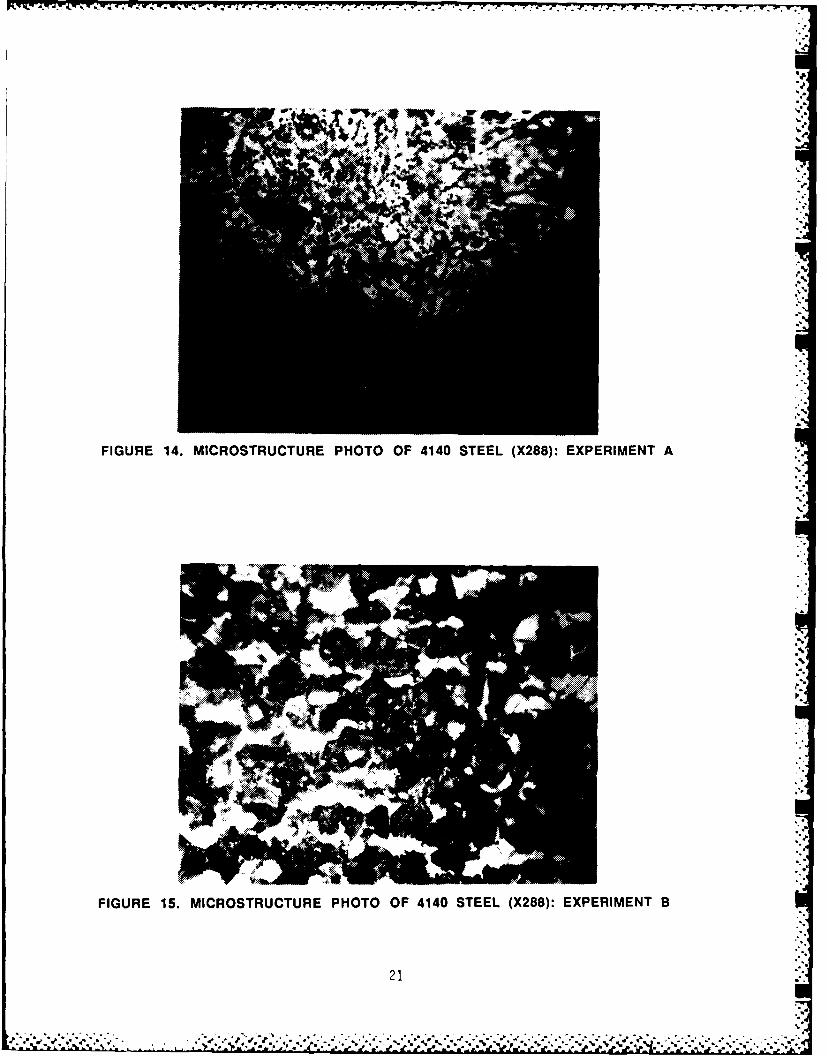
FIGURE 14. MICROSTRUCTURE PHOTO OF 4140 STEEL (X288): EXPERIMENT A
215

FIGURE 16. MICROSTRUCTURE PHOTO OF 1022 HT STEEL (X288)
AL-:
FIGURE 17. MICROSTRUCTURE PHOTO OF 4140 HT STEEL (X288)
22
r~ le 716irw V ' W V W V V. 9-V FV V -l~ 'W K 4 O % MC lu lou( -T I
FIGURE 18. MICROSTRUCTURE PHOTO OF 4340 STEEL (X288)
23

Another material tested in Experiment B was an 8740 grade steel. Of
approximately the same composition as the 4340, except for a reduced nickel
content, the material was slightly softer. The structure of the 8740 steel is
shown in Figure 19. The microstructure resembled that of the 4140 steel, with
approximately the same ferrite grain size, volume fraction, and mechanical
properties.
3.0 EXPERIMENT PROCEDURES
3.1 Undisturbed Corrosion Tests
Undisturbed corrosion tests were conducted in Experiment A to
provide a basis for analysis of the corrosion aspect involved in the
corrosive-wear mechanism. The tests involved allowing a selected steel
specimen to corrode undisturbed while immersed in volumes of distilled water
or seawater.
Steel specimens of one and one-quarter inch diameter and
approximately seven-eighths inches long were prepared by surfacing one face
side of each specimen to a smooth finish. This was performed by the use of a
Buehler Roll Grinder. Four different SIC grit size paper were used: 240,
320, 400, and 600 mesh. A smooth finish on one face was achieved by grinding
the specimen on each size grit paper starting with the 240 size and continuing
to finish with the 600 size.
Once a smooth finish was achieved, the remaining unprepared surface
area of the specimen was painted with a protective insulating coating. The
protective coating used was a mixture of a rubber-based tool grip compound
thinned by a turpentine-based thinner. The mixture was prepared by pouring
several ounces of the tool grip compound into a petri dish and then adding the
thinner to arrive at the desired consistency.
Prior to the start of the test and after the specimen's coating had
sufficiently dried, the specimen was weighed by use of an analytical balance.
A total of six weight measurements were taken and then averaged to determine
the pre-test weight. The balance was initially zeroed and then re-zeroed
after every two successive measurements.
24
525
A smal 1 specimen holder was designed and constructed of
non-conducting plastic material to hold the specimen during the test. The
holder consisted of a hollowed-out shell that the steel specimen fit up into
leaving only the unprotected prepared surface exposed. A small plastic set
screw on the side of the shell held the specimen in place. The shell was
attached to a one-quarter inch diameter plastic rod from which it was
suspended into the test bath.
The undisturbed corrosion tests were conducted using baths of
distilled water and baths of seawater and with all four materials being
tested: 1022, heat-treated 1022, 1045, and 4140 steels. The seawater used
for the tests was obtained from the Narragansett Bay and had a pH of 8.3.
Each bath of distilled water and seawater was prepared by drawing
approximately 500 ml from the respective reservoirs into a glass beaker.
On one side of each specimen approximately one-quarter inch from the
prepared surface, a 3/32-inch hole was drilled and tapped. This served as the
point where a small wire was attached via a brass 3/32-inch screw to provide
an electrical connection. Once the connection was made and the screw secured,
the connection was painted with a thin layer of the prepared protective
coating mixture.
Prior to the start of the test, a standard calomel electrode was
placed into the bath. The electrode lead was connected into the input side of
a data bank. The electrical connection leading from the steel specimen was
used to read the output voltage from the data bank. A direct voltage
potential reading was recorded as well as an offset reading referenced to the
calomel electrode. Data sheets were prepared for each test to record all
voltage potentials, weights, and other pertinent data.
To initiate the test, the specimen holder with attached steel
specimen was suspended in the bath. Voltage potential readings were recorded
at periodic intervals during the test. Each test was allowed to proceed until
a well-stabilized voltage reading was achieved, usually within 120 to 180
hours.
26

At the termination of the test, the specimen holder containing the
specimen was removed from the bath. The steel specimen was removed from the
holder and the attached electrical wire and screw removed from the specimen.
The specimen was cleaned with warm tapwater and all oxide particles were
brushed away. The specimen was then sprayed with methanol to drive off the
water moisture and allowed to dry.
After the specimen was completely dry it was weighed on the
analytical balance in the same manner as it had prior to the test. Six
measurements were taken and averaged to arrive at a final post-test weight.
The total material weight loss and the ending voltage potentials were recorded
on each specimen's data sheet.
3.2 Corrosive-Wear Tests: Experiment A
A plastic rectangular tank eighteen inches by twelve inches by
twelve inches deep served as the reservoir for the distilled water and Z
seawater used in the tests. A continuous duty Bodine electric motor was
attached to the tank to deliver the driving force required for movement of the
steel specimens. The motor was fitted with a plastic cam to provide the
horizontal back-and-forth motion desired for the steel specimens. The 1/20
horsepower motor operated at 29 rpm and with a stroke of 4-3/4 inches. An
acrylic 3/4-inch diameter rod served as a shaft and attached to the motor
drive cam via a plastic arm and rod holder. The 2-1/2 foot shaft led from the
motor across the top of the tank reservoir and was supported by two sets of
dual 1-inch diameter plastic ball bearings. The sets of ball bearings were
mounted on each side of the tank and provided for smooth unobstructed movement
of the shaft. A small weight was attached to the end of the shaft which
extended over the outside edge of the tank. The weight served to balance the
shaft due to the weight of the cam and rod holder at the other end of the
shaft.
A plastic carriage rode on the shaft and provided a platform from
which the steel specimens could be suspended. The carriage consisted of a
3-1/2 inch by 1-3/4 inch rectangular base through which the shaft passed and a
triangular 7-1/2 inch long arm extending down into the tank reservoir. The
27
same specimen holder used for the undisturbed corrosion tests was used for the
corrosive-wear tests.
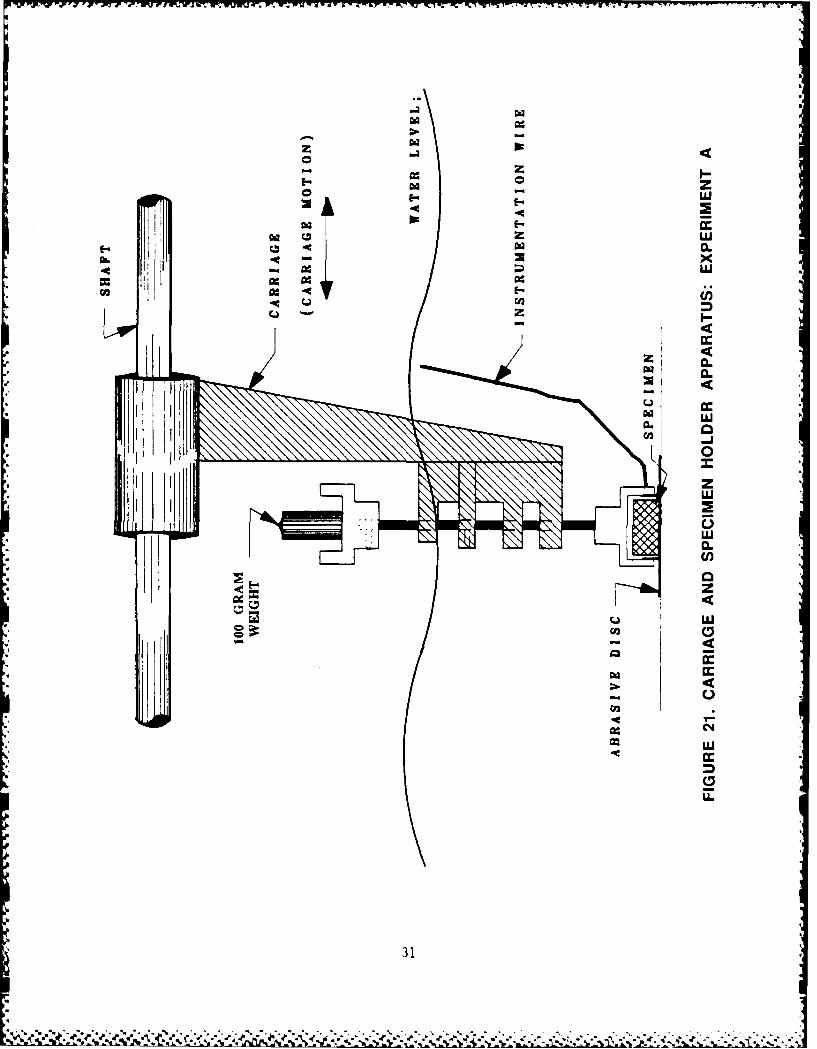
To attach the holder and specimen to the carriage, an additional
support piece was designed and constructed of plastic. This piece mounted
onto the lower end of the triangular arm of the carriage and provided three
supports through which the 1/4-Inch diameter rod of the specimen holder
passed. The holes of the support were bored so that the 1/4-Inch rod of the
specimen holder could slide freely up and down through the supports. A
sliding guide piece was attached between the two top supports. This piece,
which mounted to the 1/4-inch rod of the specimen holder through a drilled
hole and set screw, allowed the specimen holder to move only up and down as a
steel specimen was moved across the abrasive. The guide piece allowed for a
steady controlled back-and-forth motion of the steel specimen across the
abrasive.
Mounted on the top of the 1/4-inch diameter rod of the specimen
holder was a plastic hollowed-out shell similar to the shell which was used to
hold the steel specimens. This shell served as a platform for weights to be
placed in order to transfer a load to the steel specimen as it was abraded.
Although different weights could have been placed on the platform shell, a
standard weight of 100 grams was used for all of the tests. All equipment of
the carriage apparatus and specimen holder were constructed of plastic or
non-metallic materials so as not to interfere with the potential voltage
readings being observed. Plastic screws were used to secure the various
components wherever possible. Several metallic screws were required on some
pieces. However, once secured in place, they were thoroughly coated with the
protective rubber-based mixture used to coat the steel specimens.
Inside the tank, an abrasive disc was used as the abrasive mechanism
to which the steel specimens were subjected. The type disc used was a 10-inch
diameter aluminum oxide abrasive cut-off wheel. After each test, the disc was
repositioned to subject a fresh area to the abrasion process. The disc was
replaced with a new disc once all available areas of the disc were used.
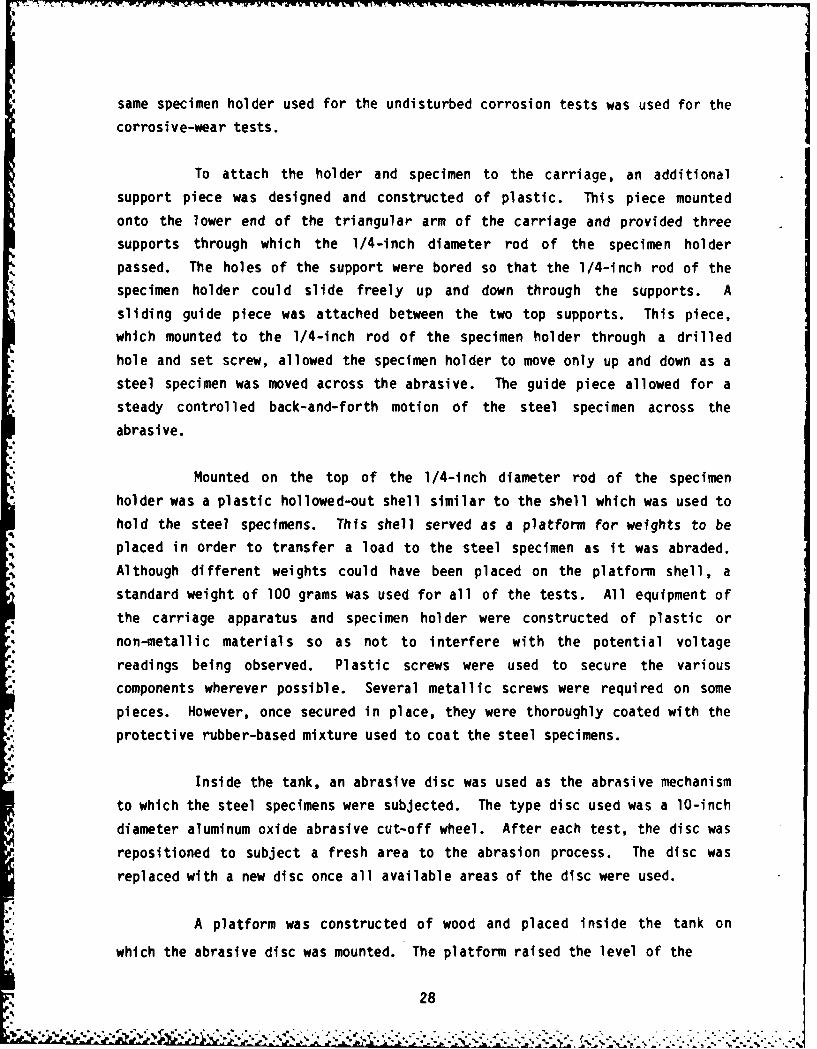
A platform was constructed of wood and placed inside the tank on
which the abrasive disc was mounted. The platform raised the level of the
28
disc up to the approximate position of the bottom of the specimen holder.
Once the platform was positioned inside the tank, it was leveled and secured.
The abrasive disc was held in place on the platform by two standard
construction bricks. Figure 20 shows the motor and tank set-up and Figure 21
shows an enlarged view of the carriage and specimen holder.
At the start of each corrosive-wear test, the tank was filled to a
level of approximately 3/4 full. Depending on the type test being conducted,
the tank was filled with either distilled water or seawater from two large
reservoirs housed within the laboratory. The level of the water in the tank
allowed for a depth over the abrasive disc of approximately 3-1/2 inches. A
standard calomel electrode was mounted to one side of the tank and suspended
into the bath.
The steel specimens used for the corrosive-wear tests were prepared
in the same manner as the specimens used for the undisturbed corrosion tests.
Each specimen was prepared on the roll grinder, coated with a thin layer of
the protective mixture and welghea prior to the start of a test as before. To
initiate the test, the steel specimen being tested was placed into the
specimen holder which was raised above the water level of the tank. The steel
specimen was secured in place with a plastic set screw. An electrical
connection to the specimen was now made by attaching a small wire with a screw
into the side of the specimen as had been done in the undisturbed corrosion
tests. A 3/32-inch brass screw held the wire into the hole which had been
drilled and tapped into the side of the specimen. Once the connection was* secured, it was painted with a thin layer of the prepared protective coating
mixture.
As in the undisturbed tests, the calomel electrode wire lead was
connected into the input side of the data bank. The electrical connection
leading from the steel specimen was then connected into the second input side
of the data bank. A multi-meter was used to read the output voltage from the
data bank. When the electrical connection coating had sufficiently dried, the
specimen holder was lowered into the bath and the 100 gram load was placed on
the top of the specimen holder platform. To start the test the motor was then
switched on.
29

I-zLU
LU* a.3*6a LUN
I-
E r - - - -
N a.I.. N E a.
~rj a.
I.~.LU
~LJr"
U 'N zU l~.IN I- I z*0 4 I-
ciC~dLU
I 0
7---A
0
Or~U.,UCa
* -~
30
I-0
0 -
,c wI-U
*j z
0
*LU
U
CC)
4
31

Each test was allowed to run for a predetermined period of time.
During the test, voltage potential readings were recorded at one-half and one
hour intervals. A direct voltage potential reading was recorded as well as an
offset reading referenced to the calomel electrode. Similar data sheets to
the ones used for the undisturbed corrosion tests were used to record the
voltage potentials, the weight measurements and any other pertinent data.
The test concluded when the predetermined period of time for the
test expired. A last set of voltage readings were recorded and the motor was
switched off. The carriage was lifted out of the water and the specimen was
removed from the holder. The electrical wire and the screw were removed so
that the specimen could be cleaned. The specimen was cleaned by immersion
under running warm tap water and all oxide particles were brushed away. The
specimen was then sprayed with methanol to drive off the water moisture and
allowed to dry. At the end of each test the tank was drained and cleaned
prior to the start of another test.
Once the specimen was completely dry, it was weighed to arrive at a
post-test weight. Weight measurements were taken by the same procedure that
was used for the undisturbed tests. The total material weight loss for the
time duration of the test was recorded on the specimen's data sheet.
Initially, corrosive-wear tests were performed using 1022 steel
specimens submerged in distilled water and then in seawater. The distilled
water tests were conducted so as to isolate the corrosive nature of the
seawater and to observe its role in the corrosive-wear mechanism. The results
of the distilled water abrasion tests would be compared with that of the
seawater tests to determine its contributing role. The 1022 steel specimens
were tested for durations of 3, 6, 15 and 24-hour periods in distilled water
and for durations of 3, 6, 9, 12, and 24-hour periods in seawater.
Additional corrosive-wear tests were conducted with the two
comparison steels and with the heat-treated 1022 steel in seawater. Steel
specimens of 1045, heat-treated 1022, and 4140 were tested for durations of 3,
6, 9, 12, and 24-hour periods in the seawater environment. These tests were
conducted to compare the wear loss rates and potentials of the three different
steel specimens with that obtained in the 1022 tests.
32

3.3 Corrosive-Wear Tests: Experiment B
The apparatus and procedures used to test the various steels in
Experiment B differed from that of Experiment A in several ways. In
Experiment A, due to the nature of the apparatus, there were variations in the
abraded areas of the specimen's surface. This resulted in the use of a wear
coefficient in order to account for differences in abraded surface area. The
apparatus in Experiment B was specifically designed to eliminate this problem
by producing specimens with uniformly worn surfaces. Voltage potential
measurements were not taken in Experiment B since they were determined not to
be a valid indication of the corrosive-wear properties of a steel. The
elaborate surface preparations used in Experiment A were discontinued since it
was found not to be a significant factor affecting the wear rates.
The apparatus used in Experiment B, shown in Figures 22 and 23,
consisted of an aluminum base plate, electric motor, drive shaft, bellow
seals, linear bearings, shaft bushing guides, and a plastic tank which
contained seawater, whetstone, whetstone platform, and specimen carriage.
Sketches of the individual components are given in Appendix A.
The design features of the apparatus allowed only for reciprocating
motion of the specimen on the whetstone. Linear bearings supported the weight
of the drive shaft and also restricted the shaft movements to linear and
rotational motions. Horizontal keyways cut into both sides of the drive shaft
at each end contained teflon keys which passed through the teflon shaft
bushing guides. These restricted rotation of the shaft. The teflon specimen
carriage was attached to the shaft by four screws which tightened the carriage
around the shaft. A pin passing through the carriage and shaft insured that
no motion of the carriage occurred along or about the shaft. The specimen
carriage also contained an aluminum key which matched keyways cut into the
steel specimens. Movement of the specimen was limited to a vertical motion.
The steel spring in the specimen carriage controlled the vertical motion and
kept the specimen in contact with the whetstone.
The corrosive-wear testing of the materials commenced with the
weighing of the specimens. The Gram-atic balance was zeroed initially and
33
.. . . . .

A
*1~
4
44
-J
4
J
FIGURE 22. CORROSIVE-WEAR TESTING APPARATUS: EXPERIMENT B
S
34
~ ~ ~ V - - -:~ *~ ~ ** ***.,~S~* .~ * At ~ 4~

FIGURE 23. CARRIAGE AND SPECIMEN HOLDER: EXPERIMENT B
35
re-zeroed after two successive measurements. After a total of six
measurements were obtained, the masses were averaged yielding the value for
the specimen's initial mass.
The spring was placed into the specimen carriage followed by the
steel specimen. A fresh whetstone was then placed on top of the whetstone
platform. The carriage was placed in position and the set pin inserted. The
plastic tank was filled with seawater to a level just below the drive shaft.
The seawater was obtained from the Narragansett Bay and had a pH of
approximately 8.3.
Testing of the steels was conducted for periods of 3, 6, 9, 12, and
24 hours. A new specimen and whetstone were used for each run. After each 24
hours of successive testing, the seawater was drained from the tank, the tank
was flushed out, and then refilled.
Following each run, the specimens were removed from the carriage.The specimens were washed with tap water, then sprayed with methanol.
Following a drying period of approximately thirty minutes, the specimens were
re-weighed using the same procedure a previously described. After the final
masses were recorded, the amount of material removed from the specimens was
obtained by subtracting the initial from final masses. The material loss from
each specimen was then plotted as a function of time for each steel.
3.4 Microstructure Analysis
To observe the microstructure of an abraded surface of a particlular
steel specimen, electron microscopy was utilized. This allowed for a detailed
analysis of how the corrosive-wear mechansim affected each grade steel
specimen. The type scanning electron microscope (SEM) used was a Cambridge
Stereoscan model S4.
The SEM was used to observe the microstructure of all four materials
In Experiment A subjected to the corrosive-wear mechanism, including the 1022,
heat-treated 1022, 1045, and 4140 steels. Polaroid Type 55 land film was used
to photograph specific surfaces observed.
36.1
4.0 RESULTS AND DISCUSSION
4.1 Undisturbed Corrosion Tests
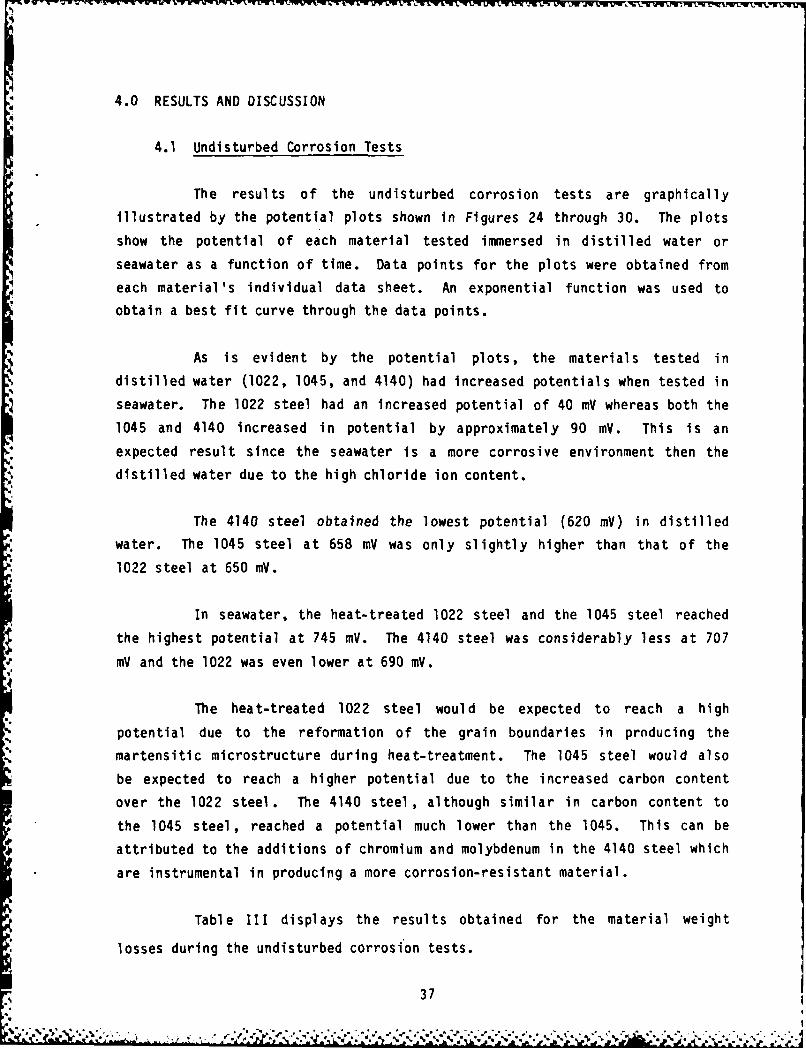
The results of the undisturbed corrosion tests are graphically
illustrated by the potential plots shown in Figures 24 through 30. The plots
show the potential of each material tested immersed in distilled water or
seawater as a function of time. Data points for the plots were obtained from
each material's individual data sheet. An exponential function was used to
obtain a best fit curve through the data points.
As is evident by the potential plots, the materials tested in
distilled water (1022, 1045, and 4140) had increased potentials when tested in
seawater. The 1022 steel had an increased potential of 40 mV whereas both the
1045 and 4140 increased in potential by approximately 90 mV. This is an
expected result since the seawater is a more corrosive environment then the
distilled water due to the high chloride ion content.
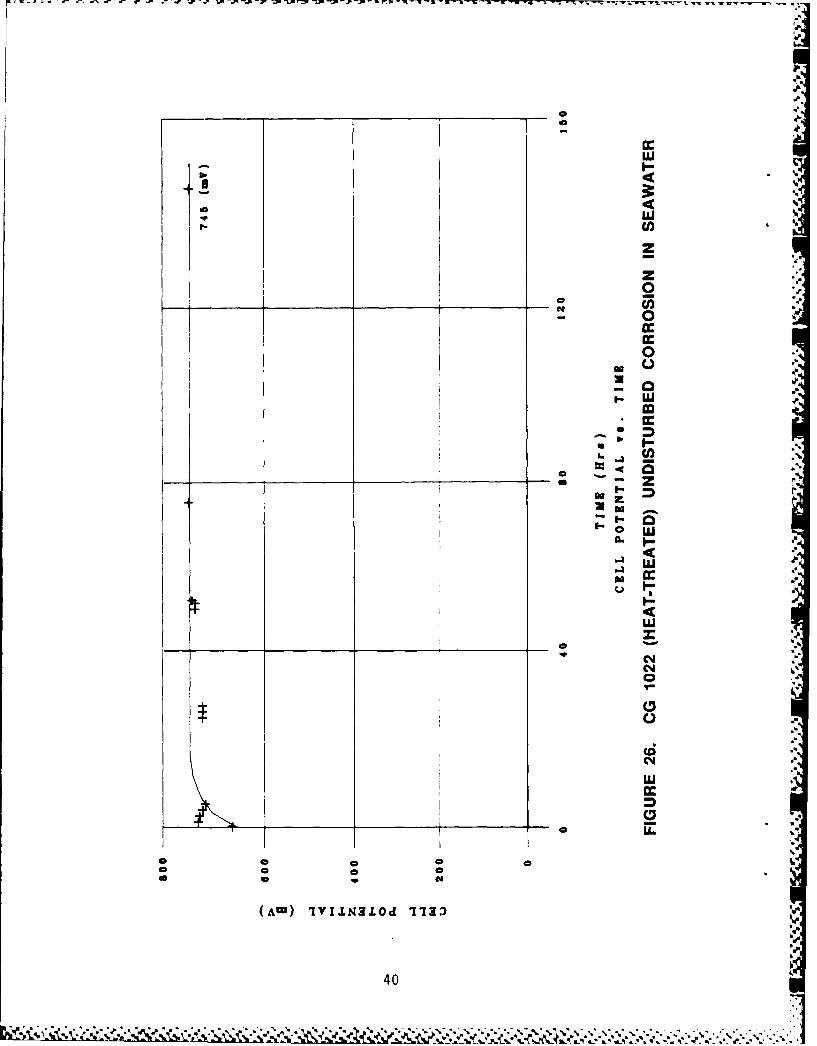
The 4140 steel obtained the lowest potential (620 mV) in distilled
water. The 1045 steel at 658 mV was only slightly higher than that of the
1022 steel at 650 mV.
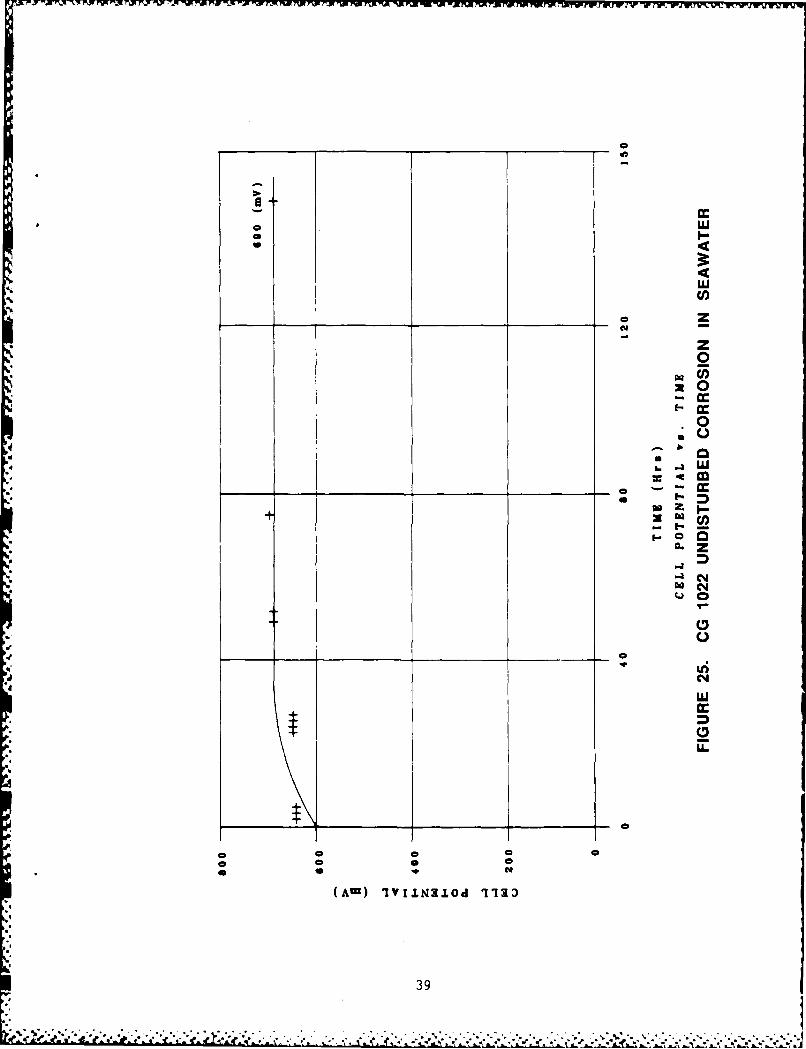
In seawater, the heat-treated 1022 steel and the 1045 steel reached
the highest potential at 745 mV. The 4140 steel was considerably less at 707
mV and the 1022 was even lower at 690 mV.
The heat-treated 1022 steel would be expected to reach a high
potential due to the reformation of the grain boundaries in producing the
martensitic microstructure during heat-treatment. The 1045 steel would also
be expected to reach a higher potential due to the increased carbon content
over the 1022 steel. The 4140 steel, although similar in carbon content to
the 1045 steel, reached a potential much lower than the 1045. This can be
attributed to the additions of chromium and molybdenum in the 4140 steel which
are instrumental in producing a more corrosion-resistant material.
Table III displays the results obtained for the material weight
losses during the undisturbed corrosion tests.
. 37

icc
00
00
" i"0w
I-
00
o
a.a
Z
*~
0C °,
4 -C4
(AM ) "IVIIN310d 1713
38
..
o LuI
LU
* z
0CC
0
J 0
C-
0
0
_ _ _ _ _ _ _ _ _ -
(AM) IVIIN310d 1IRD
39
L4AA
00
LLU- I-co
C4
4 '
400
I-
-i
CoSC
0
-~ z
z
0
c..
CC
CC
(AM) I IIN31d 113
a~a, -1
eI-IJo
ac
C z0
ad 0* CC)
0
_ _ _ __ _ _ _ _
0 ccz10
LO
+ z+ 0
ID Cn
___ (AM) ________ _ 113
42.ii

a-e
wI-
- 0wU -I
0 F* U,o -
-N 0
zz
b2 0
0
* 0U
8..
* 0______ ______ o ~ w
*
I-I- o0.
-~ z-IbiU
V.
'9 I z__________ 0 0
U'
+ w
* ai+ C~J
w
0
i
a C 0 0
A 0 0 a 0* 0 * .~. N
(Am) lVIIt4ZlOd 11Z~
d.9
43
q
+ I
ui
- z0
S0
0
C .* M
-- U)+ Ele
+ z
400
44

4
TABLE III
UNDISTURBED CORROSION TEST MATERIAL LOSSES
MATERIAL ENVIRONMENT TYPE MATERIAL LOSS CELL POTENTIAL
1022 Distilled Water 11.3 g/hr* 650 mV
1022 Seawater 14.6 690
1045 Distilled Water 13.9 658
1045 Seawater 15.3 745
4140 Distilled Water 14.7 620
4140 Seawater 14.2 707
1022HT Seawater 16.4 745
- -_5*' *(x 10 )
S " HT: Heat-treated at 1650 deg. F for 30 min. and water quenched.
45

For the 1022 steel, the amount of material lost in the seawater was
substantially higher than that lost in the distilled water, which would be
expected. Approximately twenty-nine percent more material was lost on an
hourly basis in the seawater environment. Figure 31 illustrates the distilled
water and seawater environment comparison projected over a twenty-four hour
period on a loss/area basis.
As with the 1022 steel, the 1045 steel also experienced a higher
loss per hour rate in the seawater environment. The increase at ten percent
was not nearly as high as the 1022 steel. "
The 4140 steel had essentially similar material loss rates for both
environments. Although the distilled water rate is slightly higher than the
seawater rate, a difference of only (.5) is not relatively significant as
compared to the differences obtained in the 1045 and 1022 steels.
The 1045 and 4140 steels both experienced higher material loss rates
than the 1022 steel in both the distilled water and the seawater
environments. A heat-treated 1022 specimen was tested in the seawater
environment in order to compare it to the original 1022 steel. The material
loss rate for this heat-treated steel was higher then that of the original
1022 steel in seawater as well as the 1045 and 4140 steels in seawater.
By examining the undisturbed-corrosion results, a relationship
between cell potential and material loss was observed. Higher cell
potentials, which indicate higher oxidation rates, would result in a higher
material loss as observed. There are several factors which determine
oxidation rate such as material composition and microstructure which must be
investigated furthur to determine the extent of their influence.
4.2 Corrosive-Wear Tests: Experiment A
The corrosive-wear tests produced results in two specific areas.
First, the testing of the 1022 steel in distilled water and seawater provided
insight into what extent the medium affects the corrosive-wear process.
Secondly, the corrosive-wear testing on the 1045, 4140, and heat-treated 1022
46
- ~ ~'T V)~ 1 U'' ~ ~ .1~ ~ ~ -~ . -- .~ V ~ ~ M X ~<.'~U '~7 . .~ ~ . ~.W JN~W'~W~.WU cc
C.'.
w
+ 4 U
- w
C13
U, -
C)
0
IN3134930 zso
47
steels provided a basis for comparing them with the presently used 1022 steel
in order to determine which materials display the best performance when
subjected to conditions of corrosive-wear.
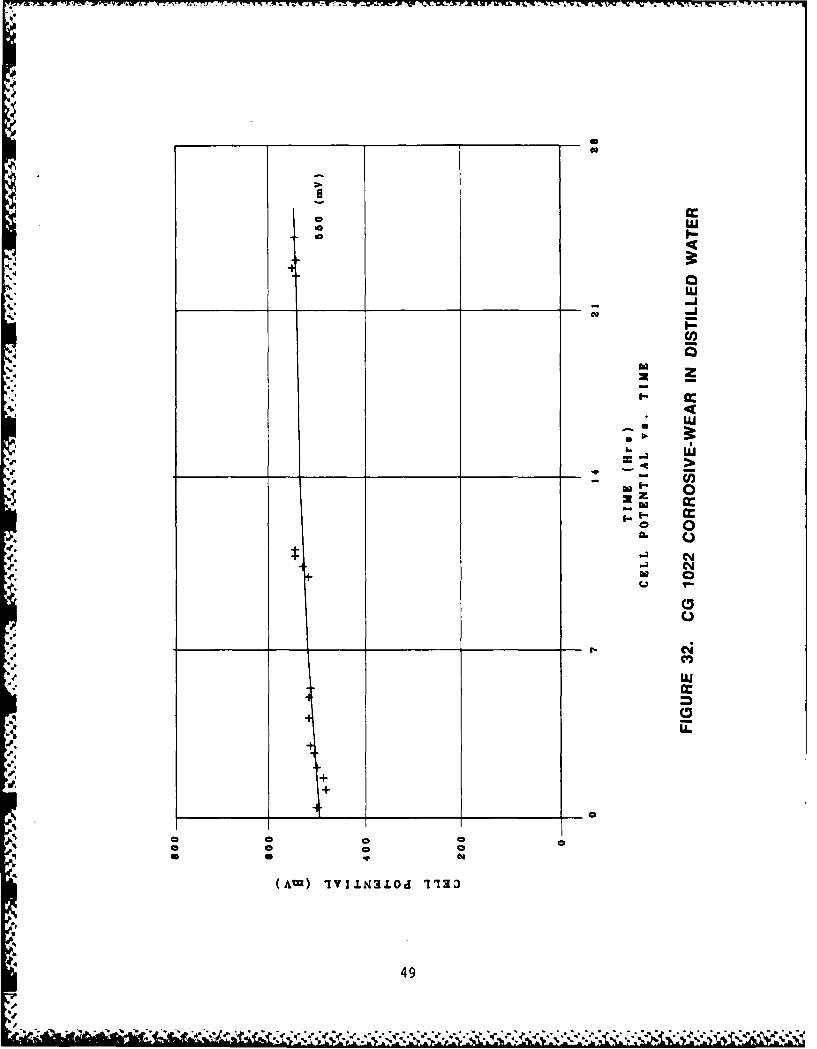
In Figure 32, the corrosive-wear cell potential plot of the 1022
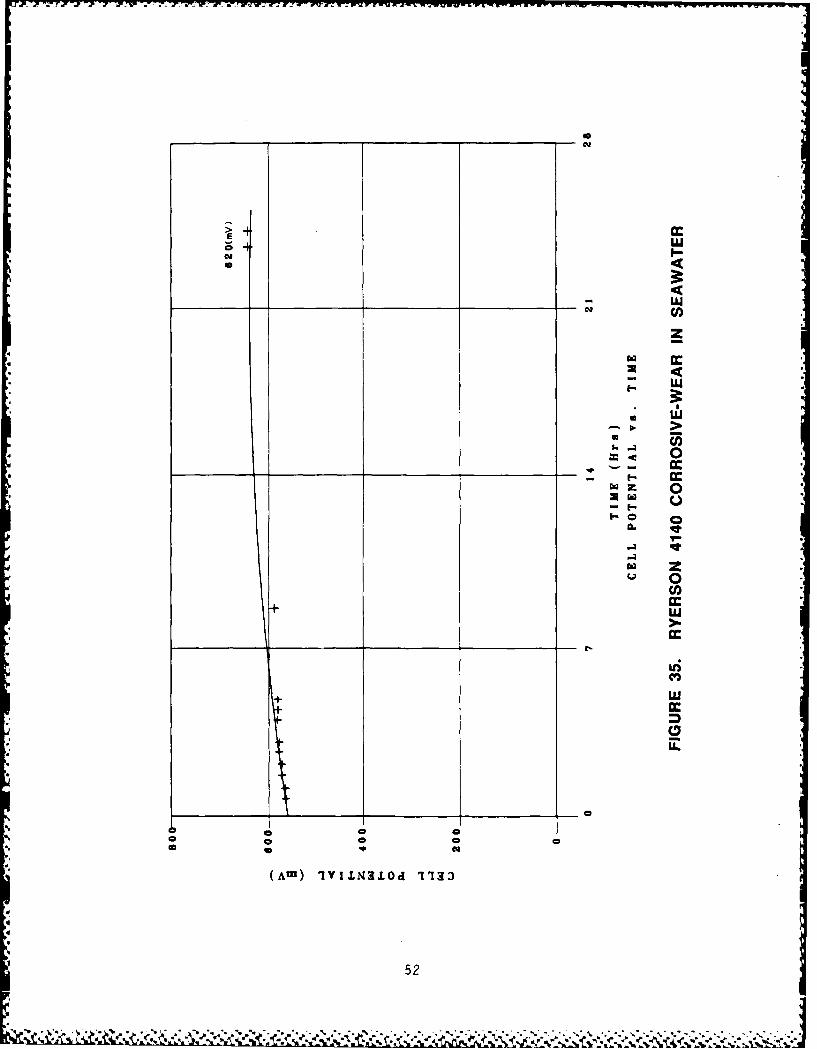
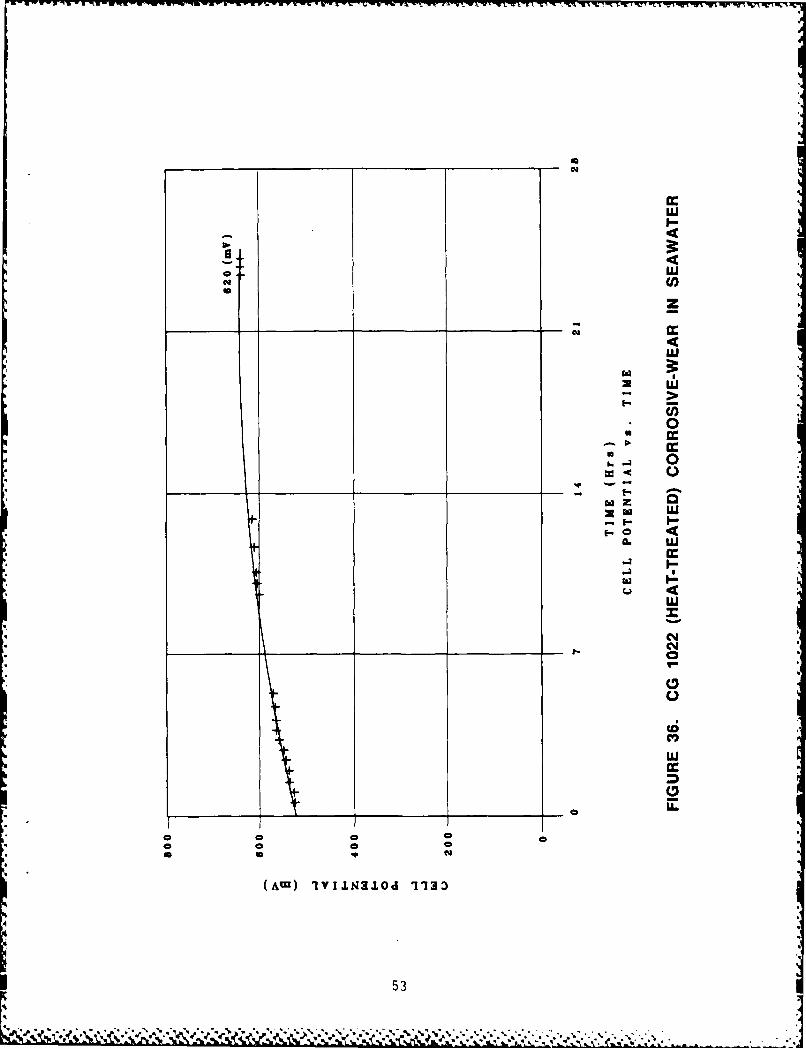
steel in distilled water over a twenty-four hour period is given. In Figures
33 through 36, the corrosive-wear cell potential plots of the 1022, 1045,
4140, and heat-treated 1022 steels in seawater are given over a twenty-fourhour period. As with the other cell potential plots described previously, the
HP9816 graphics computer and HP9872A plotter were used to generate the graphs
with an exponential function utilized to provide a best fit curve through the
data points.
" As evident in the plots of the corrosive-wear tests, a stabilized
potential was reached at a much faster rate than in the undisturbed corrosion
tests. This results in a relatively flat curve compared to the curves of the
undisturbed corrosion tests.
The corrosive-wear test of the 1022 steel in distilled water reached
a much lower potential than the potential it had reached in the undisturbed
corrosion test in distilled water. A potential drop on nearly 100 m (650 mV
for undisturbed compared to 551 mV for corrosive-wear) was obtained. The
seawater corrosive-wear test resulted in a likewise decrease in potential than
the undisturbed corrosion test in seawater; however, only a 20 mV difference
(690 mV for undisturbed compared to 670 mV for corrosive-wear) was obtained
between these two tests.
The three comparative steels also obtained lower potentials in the
corrosive-wear tests than in the undisturbed tests. The 4140 steel obtained a
drop of 87 m whereas the 1045 steel and the heat-treated 1022 steel each
decreased by 125 mV. Thus, the potentials obtained by all four materials in
the seawater corrosive-wear tests were less than what was obtained with the
same four materials in the undisturbed corrosion tests in seawater. This
lowering of the potential is apparently due to the wear process. It has been
shown that decreasing potential during combined wear and corrosion was
indicative of an increasing weight loss of a material [9]. As the specimen is
48I
o LU
LU
cn40
x LU
CC
C1
b 0
C#)
Cl
-449

_ __z_ _ _ _ 1_ _ _ _ _ _ _ _ _ _ _ _ _ C;
aL
UA
aX go
-1 0.
0QJC
500

L'U
4c,
00
LU
(Alu IVINZI~ 113
510
0 I-OD
z
x
4 ~ 0
* ui
52
ID-
X w
N CN
00
IVIINSod 113
53N
moved across the abrasive any stabilized ilm on the surface of the specimen
is removed and fresh metal is exposed. Thus, the process of forming a new
film layer begins once again.
In comparing the three alternative materials (the 1045, 4140, and
heat-treated 1022 steels) to the original 1022 steel, they all obtain similar
type plots although they all reached lower potentials than the 1022 steel.
Also, the potential plots of the 1045, 4140, and heat-treated 1022 steels are
all similar to each other in that they all stabilize at a potential of
approximately 620 mY.
Tables IV and V provide the material loss data of each specimen
during its specified test duration time. Because each specimen contacted the
abrasive surface in a slightly different manner, the amount of pressure
applied to the abraded surface of the specimen varied during each specimen
test. The applied pressure (P) on the abraded surface can be calculated using
*the equation:
P (dynes/cm2 ) = Applied Load / Abraded Surface Area
Since the applied load was constant (98,100 dynes) for all the specimens, the
applied pressure was only dependent on the abraded surface area. This
necessitated the measurement of the amount of area abraded on each specimen at
the conclusion of its test. In order to make direct comparisons between
steels, a loss coefficient (L) was developed based on the expression:
L (g/cm ) = Mass Loss (g) / Abraded Surface Area
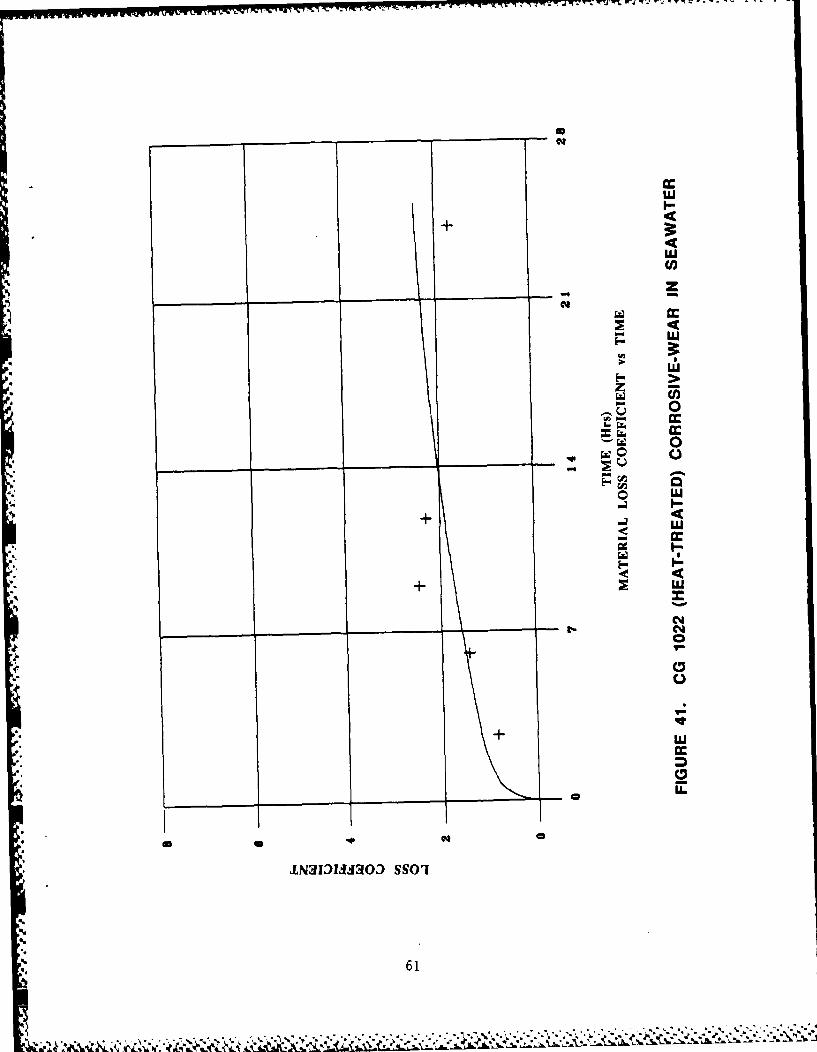
In Figures 37 through 41, the material loss coefficients are plotted
as a function of time for each steel tested. The graphs were generated in the
same manner as previous graphs; however, a power function polynomial was used
to obtain the best fit curve through the data points.
Of particular importance is the shape of the curves for each
material. There appears to be an incubation period which is characterized by
a rapid increase in the material loss coefficent. This phenomena is usually
54N 1.
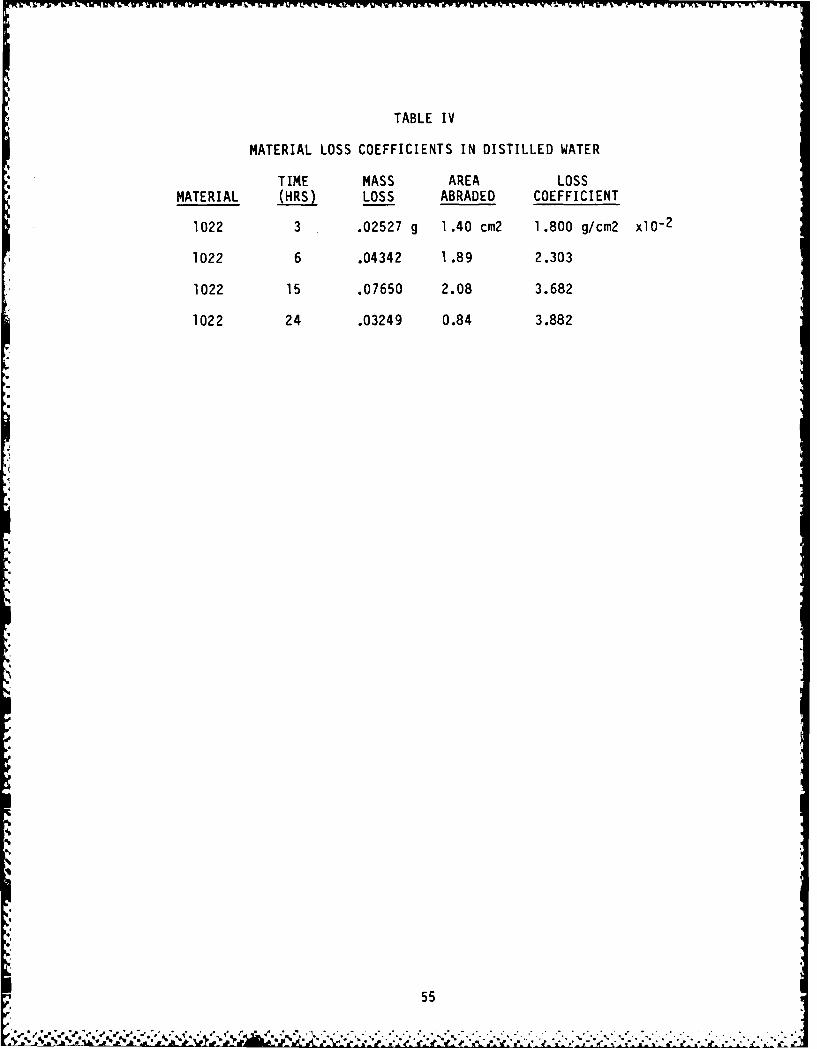
TABLE IV
MATERIAL LOSS COEFFICIENTS IN DISTILLED WATER
TIME MASS AREA LOSSMATERIAL (HRS) LOSS ABRADED COEFFICIENT
1022 3 .02527 g 1.40 cm2 1.800 g/cm2 x10 -2
1022 6 .04342 1.89 2.303
1022 15 .07650 2.08 3.682
1022 24 .03249 0.84 3.882
,%
-I
55

* .- 7 * . 7- ---
TABLE V
MATERIAL LOSS COEFFICIENTS IN SEAWATER
TIME MASS AREA LOSSMATERIAL (HRS) LOSS ABRADED COEFFICIENT
1022 3 .02435 g 1.65 cm2 1.476 g/cm2 x10 2
1022 6 .03044 1.36 2.2391022 9 .03783 1.12 3.3841022 12 .04067 1 .38 2.9451022 24 .06455 1.12 5.771
1022HT 3 .01813 2.03 0.8921022HT 6 .03075 2.18 1.4111022HT 9 .03613 1 .49 2.4261022HT 12 .03850 1.69 2.2781022HT 24 .09840 5.58 1 .763
1045 3 .01863 2.19 0.8531045 6 .01778 0.95 1.8751045 9 .01976 0.76 2.6141045 12 .02964 0.76 3.9211045 24 .07043 1.01 6.942
4140 3 .02975 2.43 1 .2264140 6 .02094 3.07 0.6834140 9 .04040 2.83 1 .428
:3 4140 12 .04998 4.61 1.0854140 24 .07323 5.86 1 .250
HT: Heat-treated at 1650 deg. F for 30 min. and water quenched.
56

LU
+ LU
U)
-j
z
LU
020
+ 0
C)n
-~ LU
LU
CMj
CV)4.. C..
4..
4.O A33Ssl
4.. LU
2.,.( af

I--
3:_ _ _ _ _ -U)
z
0~ 0
0 c04 _ _ _ _ _ 0
0Cl4
C,4
CC
* 58

LY)
z
Sw
00
Vl)
w
cc
59

I.-
z
SLU
0
CC
600
* %[rywvr ;
PUT,-T Ol -N WnikL
cqJ
I-
CQ
0
LI
+L
ccI
61~

characteristic of a wear process due to the abrasive cutting grooves into the
material being abraded. Following the incubation stage is a steady state
region. During this phase the surface of the specimen undergoes consistent
wear due to the reduction of asperities on the abrasive thus eliminating
groove cutting on the abraded surface. Wear can occur through delamination of
the subsurface [10]. It is this region that characterizes the wear which
occurs most often on a metal surface.
The plots of material loss coefficients versus time of the four
materials provide the most significant results. Each plot provides an
indication of that material's rate of loss of material when subjected to the
corrosive-wear process. Although actual slope values are given for each
curve, they are only indications as to the general steepness of the curves in
the steady-state wear region. Materials with higher slopes would indicate
higher corrosive-wear rates occuring on the surface. Therefore, materials
with smaller slopes would suggest a material of better performance and thus
better suited for use in the corrosive-wear process, such as experienced by
buoy chains.
The material loss coefficient plots of the 1022 steel in distilled
water and in seawater (Figures 37 and 38) are quite similar in form. The
distilled water test was of lower profile than the seawater test and begins a
slight decline indicating a leveling off in the rate of loss of material in
the process. This was not observed in the seawater test. The lower profile
and the leveling off observed in the distilled water test resulted in a curve
with a slope of less than that seen in the seawater test curve.
The greater rate of loss of material in the seawater environment
confirms what is expected by theory and what has been experienced in actual
practice. Due to the corrosive nature of the seawater, it would be expected
to result in higher loss of material, thus, higher material loss
coefficients. Reports from Coast Guard buoy maintenance crews have reported
similar effects. It appears that chain on buoys moored in rivers or in
brackish water do not suffer the severe loss of material that chain moorings
of ocean seawater buoys do.
05
62
. .. .P. 7.
Comparing the slopes obtained from the material loss coefficient
curves shows that the 4140 performed the best when exposed to corrosive-wear.
This exceeded the performance of the presently used 1022 steel, as did the
heat-treated 1022. Both these steels displayed the incubation and
steady-state wear periods. The 1045 steel did not show an incubation period;
however, steady-state wear occured continuously at a higher rate than the 1022
steel.
It is interesting to note the order of magnitude of the material
losses obtained in the corrosive-wear tests with that obtained in the
undisturbed corrosion tests. Table VI contains a summary of the material
losses obtained in the undisturbed corrosion tests and the corrosive-wear
tests expressed as losses per area on an hourly basis. The material losses in
the undisturbed corrosion tests are one to two orders of magnitude less than
the corrosive-wear tests. This would indicate that at the frequency used for
this research, the material loss is essentially due to the wear rather than
the corrosion process.
4.3 Corrosive-Wear Tests: Experiment B
The corrosive-wear testing, in this experiment, yielded material
loss measurements of the steel specimens for a given amount of exposure time.
The results for each of the steels tested are presented in Table VII. This
data provides a method of comparing other steels with the material presently
use for Coast Guard buoy chain, 1022 steel. Corrosion potential measurements,
performed in Experiment A, were not taken in this experiment since it was
previously determined that abrasive-wear was the major loss mechanism of
corrosive-wear.
Visual observations of the abraded surfaces of the specimens and
whetstones revealed that wear occurred across the entire face of the
specimens. Thus, the abraded area was constant for all specimens and
eliminated the need for determining the abraded areas of the specimens. The
wear patterns observed were identical regardless of material tested or
exposure time. The wear pattern that occured in the center of the specimen in
the direction of motion was different from the wear that occurred along the
63* .*~. ~ **. .* % ,-.:2--*\~~ *d-*x .,.
.. ,...,. .: .;..-, ,... .. . . ...... ,,...-., .. ,.......,..-...,. .. ,,.....,.... ... ,.,. ,,.. ..... .. _.. .... ,..... ,...:,

TABLE VI
SUMMARY OF WEIGHT LOSSES IN SEAWATER: EXPERIMENT A
MATERIAL ENVIRONMENT TYPE MATERIAL LOSS (x10-5 )
1022 UNDISTURBED CORROSION 1 .84 g/cm2-hr
1045 UNDISTURBED C uRROSION 1.93
4140 UNDISTURBED CORROSION 1 .79
1022HT UNDISTURBED CORROSION 2.07
1022 CORROSIVE-WEAR 240.46
1045 CORROSIVE-WEAR 289.25
4140 CORROSIVE-WEAR 52.08
1022HT CORROSIVE-WEAR 73.46
64
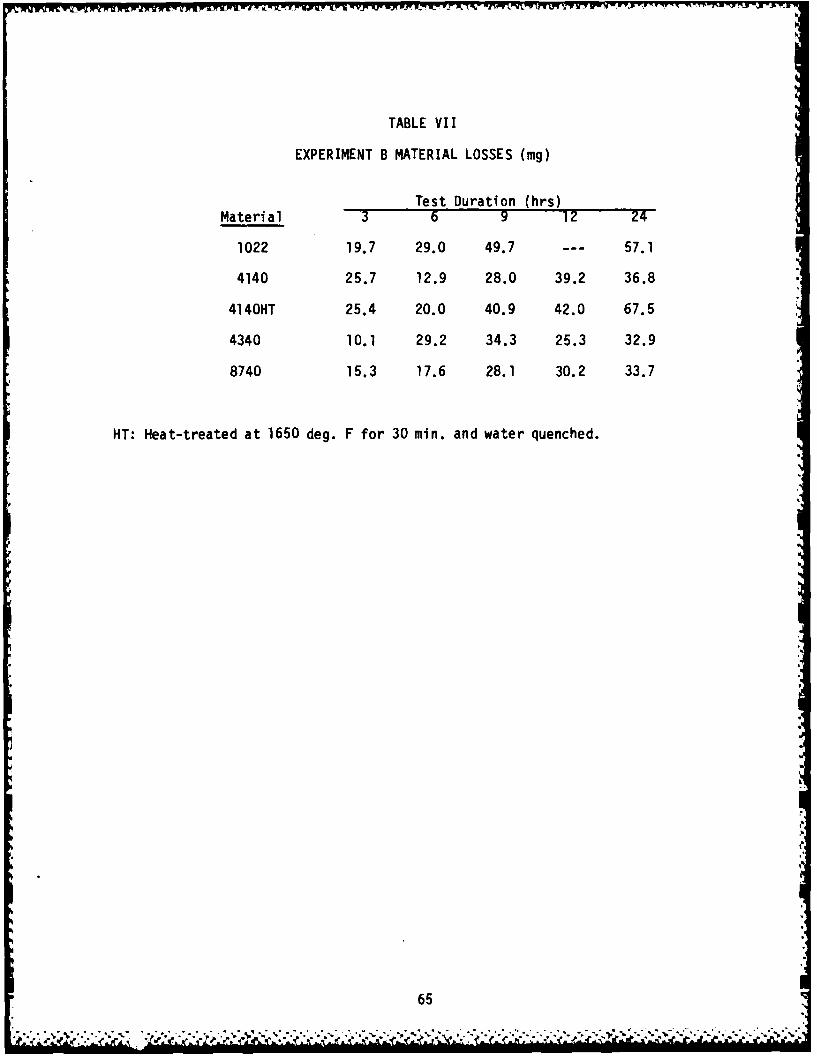
TABLE VII
EXPERIMENT B MATERIAL LOSSES (mg)
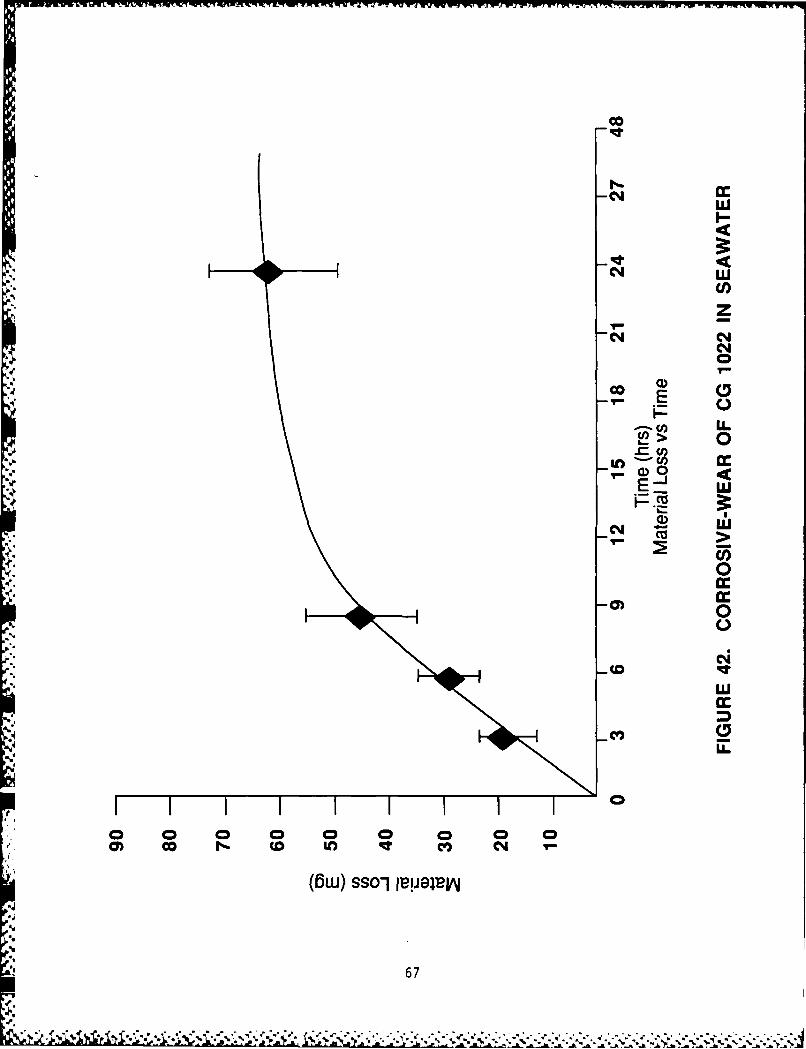
Test Duration (hrs)Material 3 6 9 _12 24
1022 19.7 29.0 49.7 -- 57.1
4140 25.7 12.9 28.0 39.2 36.8
4140HT 25.4 20.0 40.9 42.0 67.5
4340 10.1 29.2 34.3 25.3 32.9
8740 15.3 17.6 28.1 30.2 33.7
NT: Heat-treated at 1650 deg. F for 30 min. and water quenched.
65

edges. This was attributed to the presence of abrasive and specimen wear
particles which were forced out from the center of the specimen as it moved
along the whetstone like the bow of a ship forcing water aside.
The graphs of material loss as a function of exposure time for each
steel are given in Figures 42 through 46. As with Experiment A, there were
two distinct regions on the graphs. An initial incubation period of
approximately 12 hours occurs with each steel. This region is characterized
by high wear rates due to the abrasion process. Fresh abrasive removes
relatively large amounts of material in this stage. This region could be
termed a "conditioning" region where the metal surface is changing so as to
accomodate the abrasive surface for minimum abrasion. Following the
incubation period is a region of steady-state wear. It is this region which
is of major importance for buoy chain application since the majority of the
lifetime of a buoy chain is spent in the steady-state wear region. The
steady-state wear region therefore provides an indication as to which
materials will provide longer life. The steady-state wear rates are
determined by the slope of the material loss versus time curve in that
region. The wear rates of each steel are given in Table VIII. Smaller slopes
have lower wear rates and would indicate them to be more suitable for
corrosive-wear prevention.
The material presently used for mooring chain, 1022 steel, showed a
slope of (0.46). The material which exhibited the lowest steady-state wear
was the 4340 steel. Having a slope of (0.10) its wear rate was approximately
four and one-half times less than the 1022 steel. The 4140 steel showed half
the wear rate of the 1022 steel with a slope of (0.19); however, when
heat-treated, the wear rate was three times higher than the 1022 steel. The
8740 steel was similar to that of the 4140 steel with a slope of (0.21).
The results indicate that the 4340 steel would be the most desirable
material for buoy chain, followed by the 4140 cold-rolled, then the 8740
steel. The 1022 steel is relatively poor in comparison with the alloy steels,
except when the 4140 steel was heat-treated.
The results from Experiment B were consistent with those fromExperiment A. The materials which showed the lowest wear rates were the 4340,
66
WWUreh I tVI~ 1*P.fl' fl fllr .,i. ~w"r WU LW .ur~WV f n rinJ s - ,..* ~ c.
cm WC,,
z
0
CD C~- E
) U> 0
00 4
0
CV)
co r- w
(6w 0slliil
67I
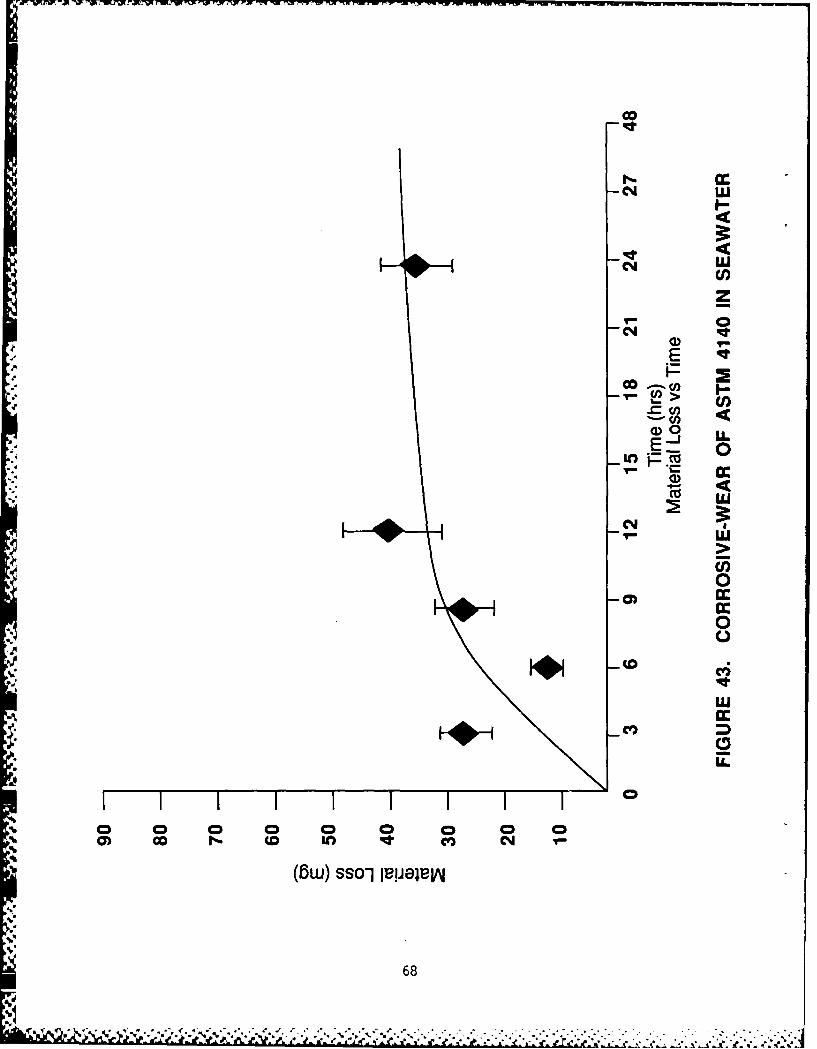
C4 C4
z- C
E
.=cnLL
a00cc
LU
u
0
0
* CDi
u
0 0 0 0 0 00D U0 rrn VD) CMJ
(6w) ssoli iuielvv
68

r.LUCM Clo
0
CM-
E wiI-.
CDO0
.r LU
I--
LzU.0m)
Li
0
0
CII0
LU
0e 0 0 0 0 0
(6w) sso-1 IBIpeILDj
69

LUCM U)
z
eq*
- n .
- U.
0(0
0I-.-'CC
CC
700
Q.

-Tw~ W~ WWW'W R -4 p 11 r zV .-1V-;! I. -. W. T -1 -7 . p
ts
0
z040
Cl N
cnJ U.00 0
LO E -
ooC*4D
CV),
o 0 0 0 0 0 0 0CO CD It Cl4
(6w) ssoi uIe~jv
71
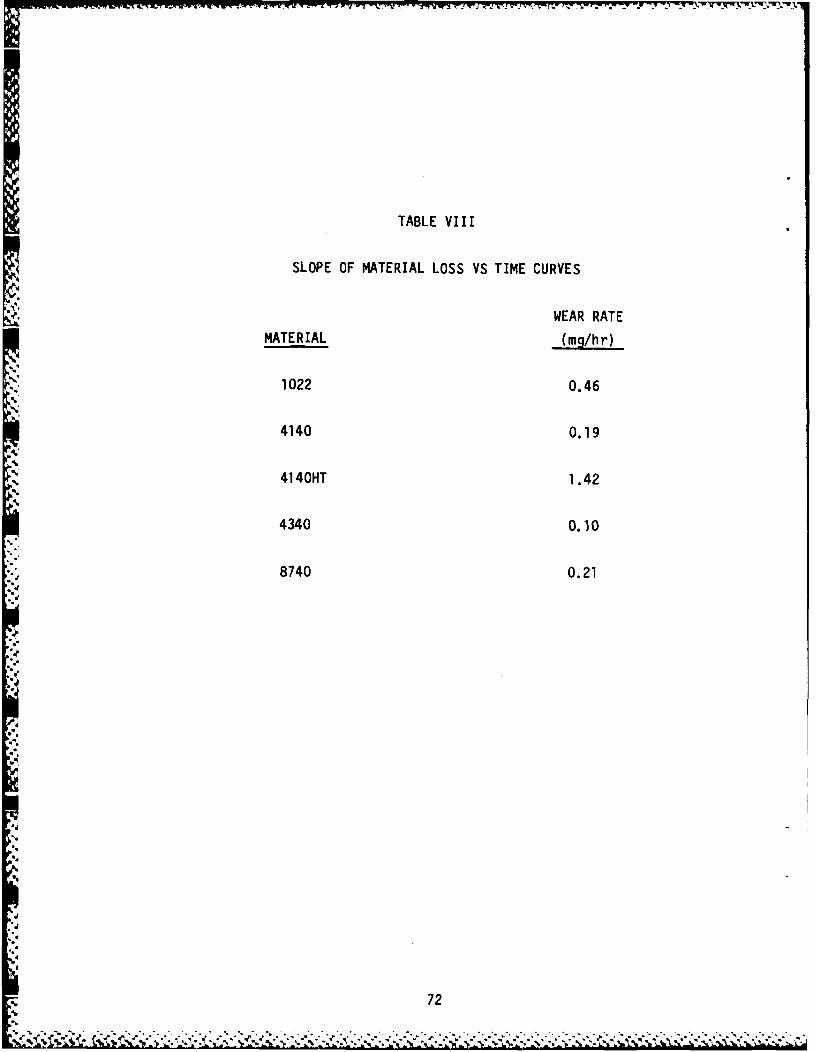
TABLE VIII
SLOPE OF MATERIAL LOSS VS TIME CURVES
WEAR RATE
MATERIAL (mg/hr)
1022 0.46
4140 0.19
'U 4140HT 1.42
4340 0.10
8740 0.21
U72
4
U..
'U
P,72
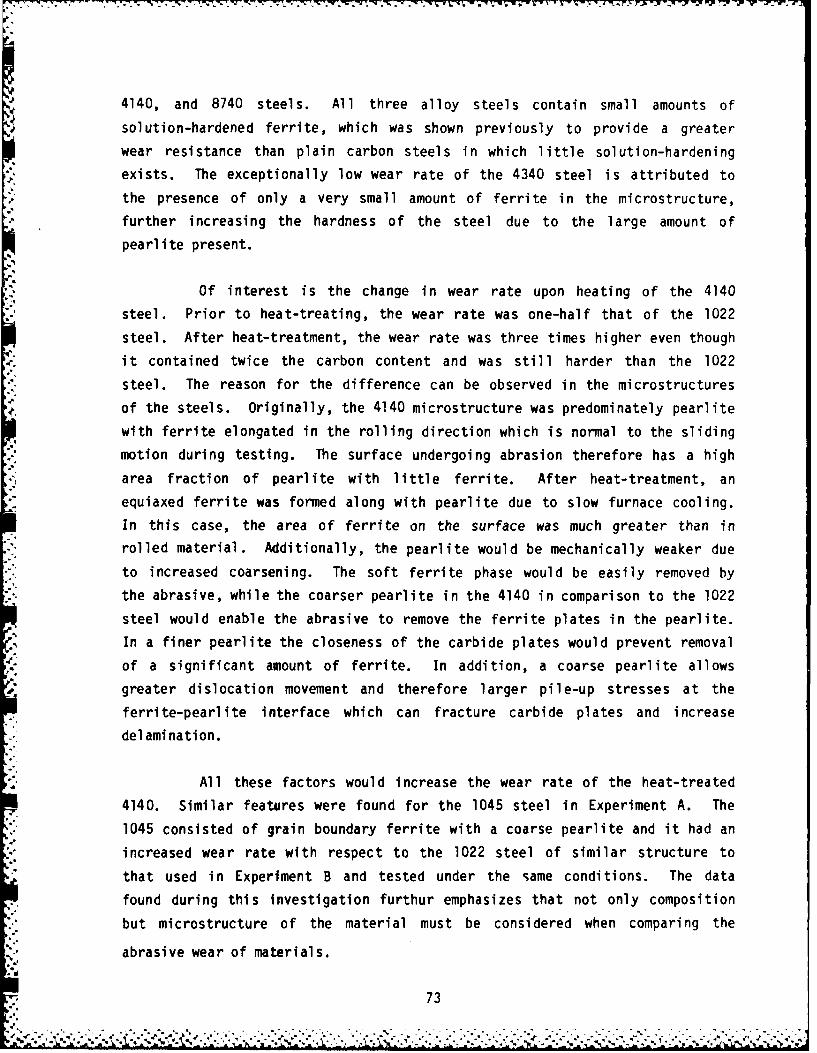
4140, and 8740 steels. All three alloy steels contain small amounts of
solution-hardened ferrite, which was shown previously to provide a greater
wear resistance than plain carbon steels in which little solution-hardening
exists. The exceptionally low wear rate of the 4340 steel is attributed to
the presence of only a very small amount of ferrite in the microstructure,
further increasing the hardness of the steel due to the large amount of
pearlite present.
Of interest is the change in wear rate upon heating of the 4140
steel. Prior to heat-treating, the wear rate was one-half that of the 1022
steel. After heat-treatment, the wear rate was three times higher even though
it contained twice the carbon content and was still harder than the 1022
steel. The reason for the difference can be observed in the microstructures
of the steels. Originally, the 4140 microstructure was predominately pearlite
with ferrite elongated in the rolling direction which is normal to the sliding
motion during testing. The surface undergoing abrasion therefore has a high
area fraction of pearlite with little ferrite. After heat-treatment, an
equiaxed ferrite was formed along with pearlite due to slow furnace cooling.
In this case, the area of ferrite on the surface was much greater than in
rolled material. Additionally, the pearlite would be mechanically weaker due
to increased coarsening. The soft ferrite phase would be easily removed by
the abrasive, while the coarser pearlite in the 4140 in comparison to the 1022
steel would enable the abrasive to remove the ferrite plates in the pearlite.
In a finer pearlite the closeness of the carbide plates would prevent removalof a significant amount of ferrite. In addition, a coarse pearlite allows
greater dislocation movement and therefore larger pile-up stresses at the
ferrite-pearlite interface which can fracture carbide plates and increase
delamination.
All these factors would increase the wear rate of the heat-treated
4140. Similar features were found for the 1045 steel in Experiment A. The
1045 consisted of grain boundary ferrite with a coarse pearlite and it had an
increased wear rate with respect to the 1022 steel of similar structure to
that used in Experiment B and tested under the same conditions. The data
found during this investigation furthur emphasizes that not only composition
but microstructure of the material must be considered when comparing the
abrasive wear of materials.
73
5 s~..(
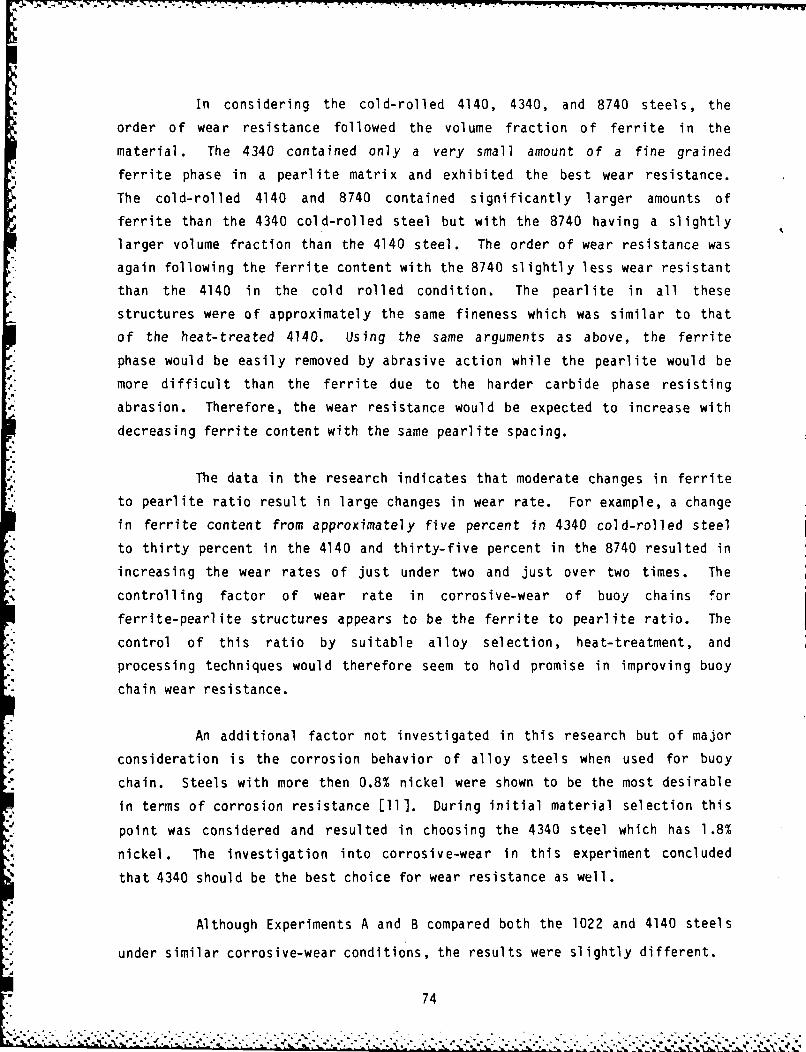
ru I..-. . z W
In considering the cold-rolled 4140, 4340, and 8740 steels, the
order of wear resistance followed the volume fraction of ferrite in the
material. The 4340 contained only a very small amount of a fine grained
ferrite phase in a pearlite matrix and exhibited the best wear resistance.
The cold-rolled 4140 and 8740 contained significantly larger amounts of
ferrite than the 4340 cold-rolled steel but with the 8740 having a slightly
larger volume fraction than the 4140 steel. The order of wear resistance was
again following the ferrite content with the 8740 slightly less wear resistant
than the 4140 in the cold rolled condition. The pearlite in all these
structures were of approximately the same fineness which was similar to that
of the heat-treated 4140. Using the same arguments as above, the ferrite
phase would be easily removed by abrasive action while the pearlite would be
more difficult than the ferrite due to the harder carbide phase resisting
abrasion. Therefore, the wear resistance would be expected to increase with
decreasing ferrite content with the same pearlite spacing.
The data in the research indicates that moderate changes in ferrite
to pearlite ratio result in large changes in wear rate. For example, a change
in ferrite content from approximately five percent in 4340 cold-rolled steel
to thirty percent in the 4140 and thirty-five percent in the 8740 resulted in
increasing the wear rates of just under two and just over two times. The
controlling factor of wear rate in corrosive-wear of buoy chains for
ferrite-pearlite structures appears to be the ferrite to pearlite ratio. The
control of this ratio by suitable alloy selection, heat-treatment, and
processing techniques would therefore seem to hold promise in improving buoy
chain wear resistance.
An additional factor not investigated in this research but of major
consideration is the corrosion behavior of alloy steels when used for buoychain. Steels with more then 0.8% nickel were shown to be the most desirable
in terms of corrosion resistance [11]. During initial material selection this
point was considered and resulted in choosing the 4340 steel which has 1.8%
nickel. The investigation into corrosive-wear in this experiment concluded
that 4340 should be the best choice for wear resistance as well.
Although Experiments A and B compared both the 1022 and 4140 steels
under similar corrosive-wear conditions, the results were slightly different.
74
;* 74: ' - : -" ' . - -" ."' . - * '-.''-,";, , . ":" ' .. : '.-,., :".> .y " ,'L,:' :''..., ,--
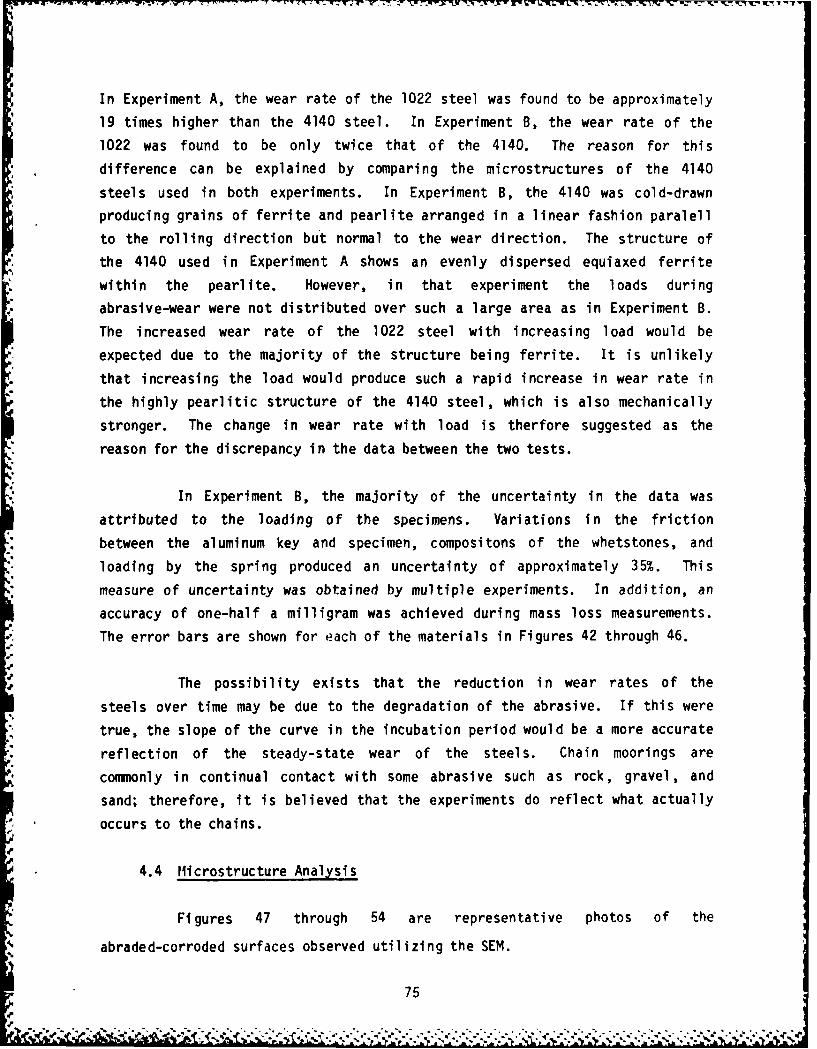
In Experiment A, the wear rate of the 1022 steel was found to be approximately
19 times higher than the 4140 steel. In Experiment B, the wear rate of the
1022 was found to be only twice that of the 4140. The reason for this
difference can be explained by comparing the microstructures of the 4140
steels used in both experiments. In Experiment B, the 4140 was cold-drawn
producing grains of ferrite and pearlite arranged in a linear fashion paralell
to the rolling direction but normal to the wear direction. The structure of
the 4140 used in Experiment A shows an evenly dispersed equiaxed ferrite
within the pearlite. However, in that experiment the loads during
abrasive-wear were not distributed over such a large area as in Experiment B.
The increased wear rate of the 1022 steel with increasing load would be
expected due to the majority of the structure being ferrite. It is unlikely
that increasing the load would produce such a rapid increase in wear rate in
the highly pearlitic structure of the 4140 steel, which is also mechanically
stronger. The change in wear rate with load is therfore suggested as the
reason for the discrepancy in the data between the two tests.
In Experiment B, the majority of the uncertainty in the data was
attributed to the loading of the specimens. Variations in the friction
between the aluminum key and specimen, compositons of the whetstones, and
loading by the spring produced an uncertainty of approximately 35%. This
measure of uncertainty was obtained by multiple experiments. In addition, an
accuracy of one-half a milligram was achieved during mass loss measurements.
The error bars are shown for each of the materials in Figures 42 through 46.
The possibility exists that the reduction in wear rates of the
steels over time may be due to the degradation of the abrasive. If this were
true, the slope of the curve in the incubation period would be a more accurate
reflection of the steady-state wear of the steels. Chain moorings are
commonly in continual contact with some abrasive such as rock, gravel, and
sand; therefore, it is believed that the experiments do reflect what actually
occurs to the chains.
4.4 licrostructure Analysis
Figures 47 through 54 are representative photos of the
abraded-corroded surfaces observed utilizing the SEM.
754,

--- - ----
FIGURE 47. SEM PHOTO OF 1022 ABRADED SURFACE (X530)
FIGURE 48. SEM PHOTO OF 1022 HT ABRADED SURFACE (X530)
U 76
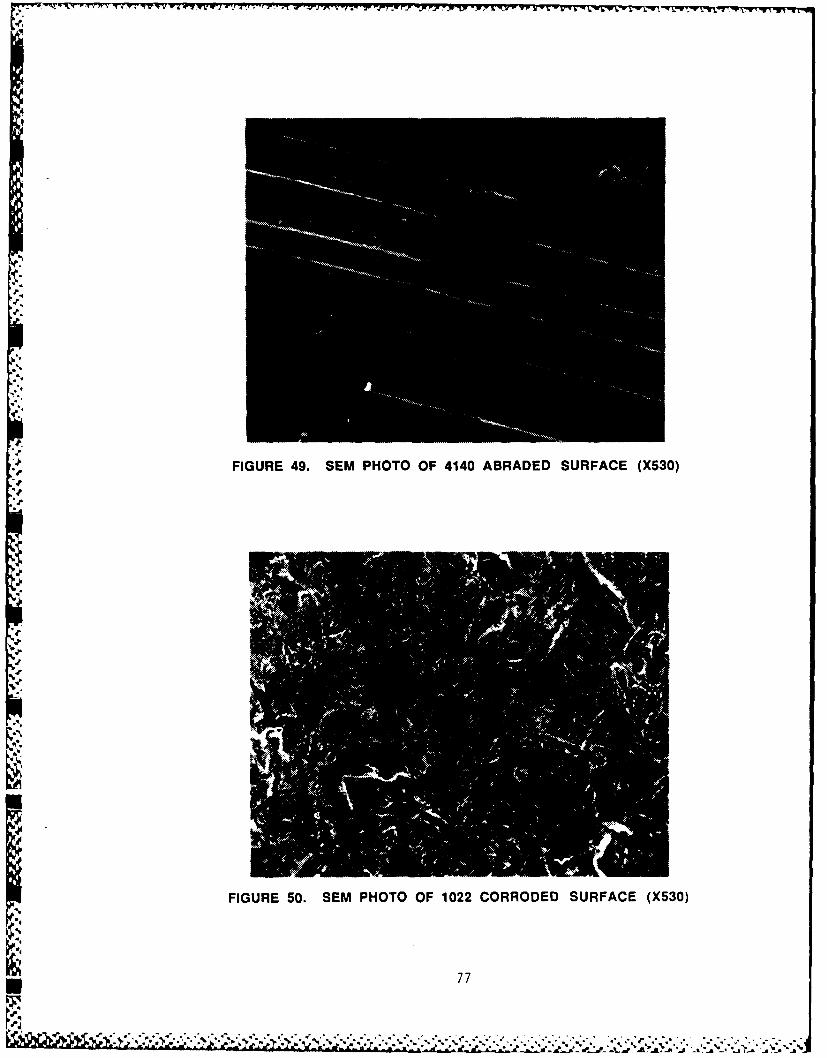
Wj ~- -YM- -U47 x; - - -
FIGURE 49. SEM PHOTO OF 4140 ABRADED SURFACE (X530)
FIUE5.-M HT F122CROE URAE(50
-'77

FIGURE 51. SEM PHOTO OF 1045 CORRODED SURFACE (X540)
* FIGURE 52. SEM PHOTO OF 4140 CORRODED SURFACE (X525)
78
lp
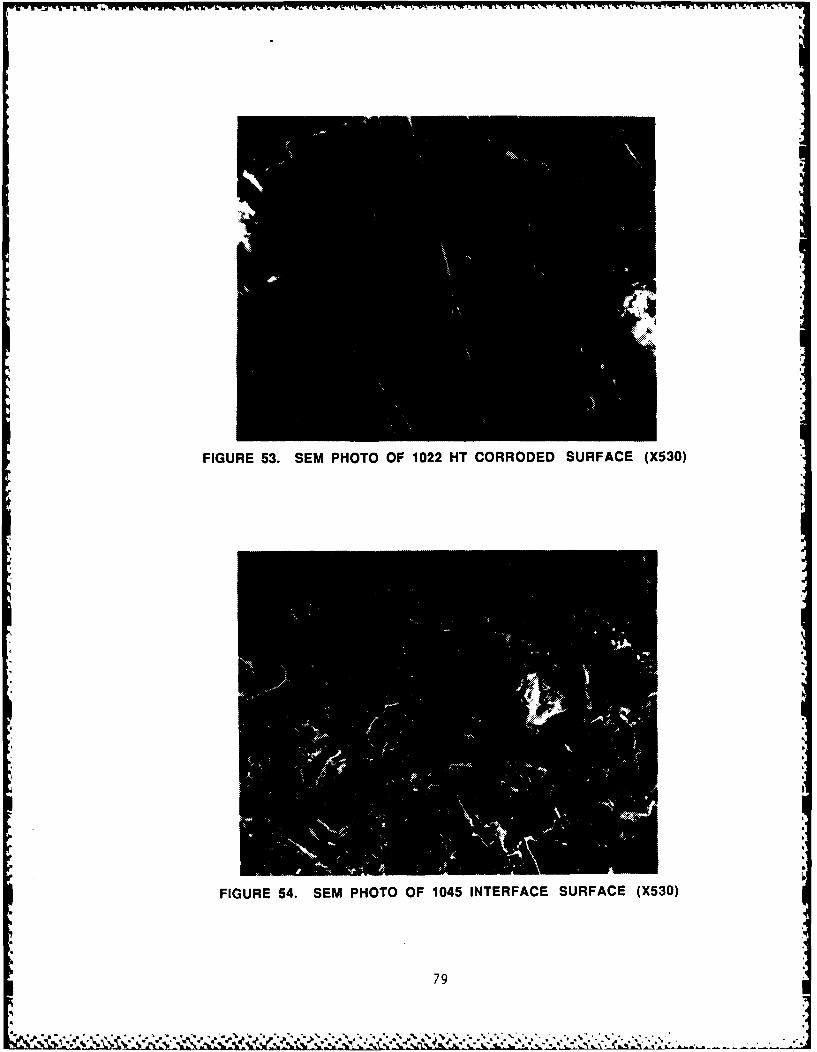
FIGURE 53. SEM PHOTO OF 1022 HT CORRODED SURFACE (X530)
FIGURE 54. SEM PHOTO OF 1045 INTERFACE SURFACE (X530)
79
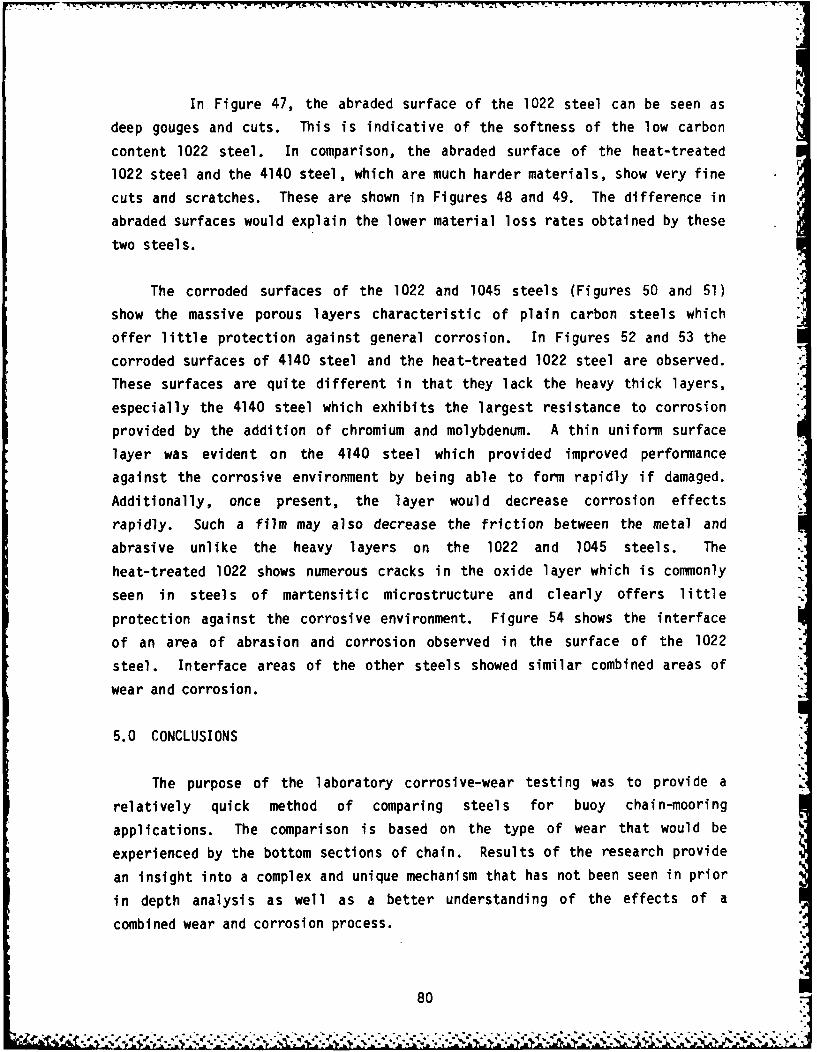
In Figure 47, the abraded surface of the 1022 steel can be seen as
deep gouges and cuts. This is indicative of the softness of the low carbon
content 1022 steel. In comparison, the abraded surface of the heat-treated
1022 steel and the 4140 steel, which are much harder materials, show very fine
cuts and scratches. These are shown in Figures 48 and 49. The difference in
abraded surfaces would explain the lower material loss rates obtained by these
two steels.
The corroded surfaces of the 1022 and 1045 steels (Figures 50 and 51)
show the massive porous layers characteristic of plain carbon steels which
offer little protection against general corrosion. In Figures 52 and 53 the
corroded surfaces of 4140 steel and the heat-treated 1022 steel are observed.
These surfaces are quite different in that they lack the heavy thick layers,
especially the 4140 steel which exhibits the largest resistance to corrosion
provided by the addition of chromium and molybdenum. A thin uniform surface
layer was evident on the 4140 steel which provided improved performance
against the corrosive environment by being able to form rapidly if damaged.
Additionally, once present, the layer would decrease corrosion effects
rapidly. Such a film may also decrease the friction between the metal and
abrasive unlike the heavy layers on the 1022 and 1045 steels. The
heat-treated 1022 shows numerous cracks in the oxide layer which is commonly
seen in steels of martensitic microstructure and clearly offers little
protection against the corrosive environment. Figure 54 shows the interface
of an area of abrasion and corrosion observed in the surface of the 1022
steel. Interface areas of the other steels showed similar combined areas of
wear and corrosion.
5.0 CONCLUSIONS
The purpose of the laboratory corrosive-wear testing was to provide a
relatively quick method of comparing steels for buoy chain-mooring
applications. The comparison is based on the type of wear that would be
experienced by the bottom sections of chain. Results of the research provide
an insight into a complex and unique mechanism that has not been seen in prior
in depth analysis as well as a better understanding of the effects of a
combined wear and corrosion process.
80
The wear process accounts for the majority of the chain degradation.
This can be observed in areas having a sand, rock, or gravel bottom where the
chafe section of the chains exhibit a much higher degree of wear than the
suspended section of chain. This was also observed in the laboratory testing
where the material loss rates obtained in the undisturbed corrosion tests as
compared to the rates obtained in the corrosive-wear tests portrayed how
devasting the mechanism can be to a particular material.
While the wear component has been shown to be the dominating factor of
the mechanism, it appears that it is dependent upon the frequency of the
abrasion process. Although the actual relationship between the abrasion
frequency and wear rate has not been determined, it is obvious that an
increase in the number of cycles over a given time will increase the wear rate
since the material will have been exposed to additional abrasive surface.
Therefore, on the laboratory studies, the designed frequency and amplitude of
the motion of the specimen against the abrasive surface was similar to that of
a chain mooring under maximum environmental conditions.
There are several obvious environmental factors which influence the wear
rates of chain such as wind, wave, and current forces. As discussed by Kohler
[2], there are many other factors which can also affect the wear rate. The
laboratory experiments were designed to eliminate most of these influences
while allowing for material properties to be observed.
In Experiment A, the results of the corrosive-wear tests with the
presently used 1022 steel and the three alternative materials, heat-treated
1022, 1045, and 4140 steel , provide a remarkable portrayal of how each
material is affected by the corrosive-wear process. The results of the 1045
steel are quite surprising given that it is a structurally harder material
than the 1022 steel yet, it had an increased material loss rate. The increase
in hardness is not nearly as substantial as the heat-treated 1022 steel which
resulted in a reduced material loss rate as compared to the original 1022
steel. The better performance of the heat-treated 1022 appears to be the
result of the increased strength and hardness in the martensitic
microstructure which is better suited to an abrasion process. The 4140 steel
produced the best wear resistance with a material loss rate of five times less
than that of the presently used 1022 steel. The 4140 was able to achieve a
81
loss rate at a strength and hardness less than that of the heat-treated 1022
steel through the addition of several alloying elements. It would appear that
the addition of mangan-se, chromium and molybdenum to the 4140 steel produced
a greater effect on the ability to resist the corrosive-wear process than the
overall increase in strength and hardness.
In Experiment B, the results showed that the 4340 steel is best suited
for the bottom section of a chain mooring. The wear rate of this steel was
less than one-fourth that of the presently used, 1022 steel and almost half
that of the 4140 steel , which was shown to be the best of steels examined in
Experiment A. This confirms what has been determined previously, that the
corrosive-wear behavior of steels is determined by their microstructure
particularly the ferrite to pearlite ratio in the microstructure. Lower
ferrite to pearlite ratios indicate better wear resistance. Increased
hardness in the steel itself will not guarantee improved wear resistance.
Alloy steels which are solutioned-hardened demonstrate increased wear
resistance.
In summary, it is hypothesized that substantial savings can be achieved
through use of the 4340 steel in chain moorings where frequent mooring
replacement has been necessary in the past. The steel should also be much
less susceptible to pitting attack than the other steels, due to its high
nickel content. Although the greatest benefits of the steel would be realized
in the chafe section, the increased strength of the alloy would allow for a
reduction in the diameter of the chain if used in the entire mooring as
compared to conventional requirements. This would decrease the weight of the
mooring in addition to the cost, while providing a longer usable life.
5.1 A Final Look
A section of chain from an adrift buoy that had broken its chain mooring
has provided a quick analysis and final conclusion from this research.
The section of chain (approximately 60 ft. in length) was removed from a
drifting First Class Can Buoy that was recovered by the U.S. Coast Guard
Cutter Redwood, a 157 ft. buoy tender. No official data was available on the
buoy or chain but estimates by the servicing personnel were that it had been
82
A . .- ', '-. - . ., . . . , '. , -. . . . . .. .. .. .. . - - .. o . • , ,. .,- • , . .
deployed for approximately two to three years. The upper portion of the chain
(originally one inch diameter) was in good condition; however, the lower
portion where the chain had broken had undergone severe material loss due to
corrosive-wear. To estimate the length of time the buoy chain has been
subjected to the corrosive-wear mechanism, which resulted in the material
loss, the rates obtained by this research were used. The calculations are as
follows:
Diameter of original chain link - 2.54 cm
Diameter of worn chain link = 1.08 cm (average value)
Taking the chain link as an ellipse which can be rationalized as essentially a
cylinder of steel that has been reshaped, the volume of the link can be
calculated
Ellipse length = 30.6 cm
Volume of original link = 155.05 cm3
Volume of worn link = 28.03 cm3
3Volume loss from corrosive-wear = 127.02 cm
Density of steel = 7.8 g/cm 3
Total mass lost from corrosive-wear = 990.76 g
To estimate the length of time the chain link was exposed to the
corrosive-wear mechanism, the area of the link affected can be estimated. As
a conservative approach, the minimum abraded area from the chain link is 9.5
cm long by 1.5 cm wide on the ocean floor and 2.0 cm2 from link on link
abrasion. Thus:
Total minimum area = 16.25 cm2
Area loss rate for corrosive-wearof chain = 990.76 g /216.25 cm2
= 60.97 g/cm
Lab loss rate for 1022 steel chainin corrosive-wear = 240.4 x 10⁻⁵ g/cm 2 hr
Time for actual chain loss rate = 25,362 hr= 2.89 yrs
83
# i , '° - , " ... *** * . .. ..
To compare this value with how long it would take for a 4140 steel chain toachieve this same amount of material loss, the rate determined by thelaboratory experiments in this research can be used. As before:
Area loss rate = 60.97 g/cm 2
Lab loss rate for 4140 steel chainin corrosive wear = 52.08 x 10⁻⁵ g/cm hr
Predicted life of 4140 chain forcorrosive-wear = 117,070 hr
= 13.36 yrs
The value of 2.89 years for the 1022 steel is very realistic based uponprevious estimates by servicing personnel. The value of 13.36 years for the
4140 steel chain in an increase of over four and one-half times that of the1022 steel chain.
84
S."i
I£
: 84

REFERENCES
1. May, D.R., Abrasive-Corrosion of Buoy Chain, URI Thesis, 1984.
2. Kohler, C.A., Corrosive-Wear of Alloy Steels for Buoy Chain, URI Thesis,1985.
3. Aids to Navigation, U.S. Coast Guard Mission Series, CG 378-6, Departmentof Transportation, March, 1978.
4. Johnson, Arnold-Burges, The Modern Lighthouse Service, Washington: U.S.Government Printing Office 1889. IX, p. 137.
5. Buoy Mooring Selection Guide for Chain Moorings, Ocean Engineering Report,COMDTINST M16511-1 , dtd December 22, 1978, U.S. Government Printing Office.
6. Scott, D.M., "Treatise in Material Science and Technology", Wear, Vol. 13,Academic Press, New York, 1973.
* 7. Fontanna, M.G. and Greene, N.D., Corrosion Engineering, McGraw-Hill, NewYork, 1967.
8. Laing, A.K., Buhr, R.K., and Gertsman, S.L., Navigational Buoy MooringChains, Technical Report by the Canadian Department of Mines and TechnicalSurveys, 1965.
9. Brown, S.A., and Simpson, J.P., "Crevice and Fretting Corrosion ofStainless Steel Plates and Screws", Journal of Biomedical MaterialsResearch, Vol. 15, 1981, pp. 867-878.
10. Suh, N.P., Jahanmir, S., and Abrahamson, E.P., "The Delamination Theory ofWear", Progress Report to the Advanced Research Project Agency, DOD,Materials Processing Laboratory, Department of Mechanical Engineering,Massachusetts Institute of Technology, Cambridge, Mass., Sept. 1974.
11. Wayne, J.F., Rice, S.L., Minakawa, K., and Nowotny, H., "The Role ofMicrostructure in the Wear of Selected Steels", Wear, Vol. 85, 1983, pp.93-106.
85
1,- - ,; - - ..- ..-...- ... ->-;.. .,.... ... ..--.. , .,,. .....-..- ... . . . .. . . .. . . . . . .

- - - - - - - - -- V. 4 4 . - . -
APPENDIX A4
APPARATUS COMPONENTS: EXPERIMENT B
i
'N
-V
V..
.5
.5
A* - . - VV. - -........-. -.V
- *~.

4me4
tt
x
N 0"
> :
ExCL 04
mE~~I 0 0
- - 0 0
o+o
A-1

OWNSS
. ..
-CaT
CLD
0
ti s
0
A- 2
AD-R172 434 CORROSIVE-HEAR OF BUOY CHAIN(U) COAST GUARD RESEARCH 2/2AND DEVELOPNENT CENTER GROTON CT C A KOHLER ET AL.JUL 86 CGR/DC-5/86 USCG-D-21-96
UNCLASSIFIED F/C 11/6 NL
Eu...

11.5
ILI&0
I till1.11.8
MICROCOPY RESOLUTION TEST CHARTNATIONAL BUREAU OF STANDARDS- 1963-A
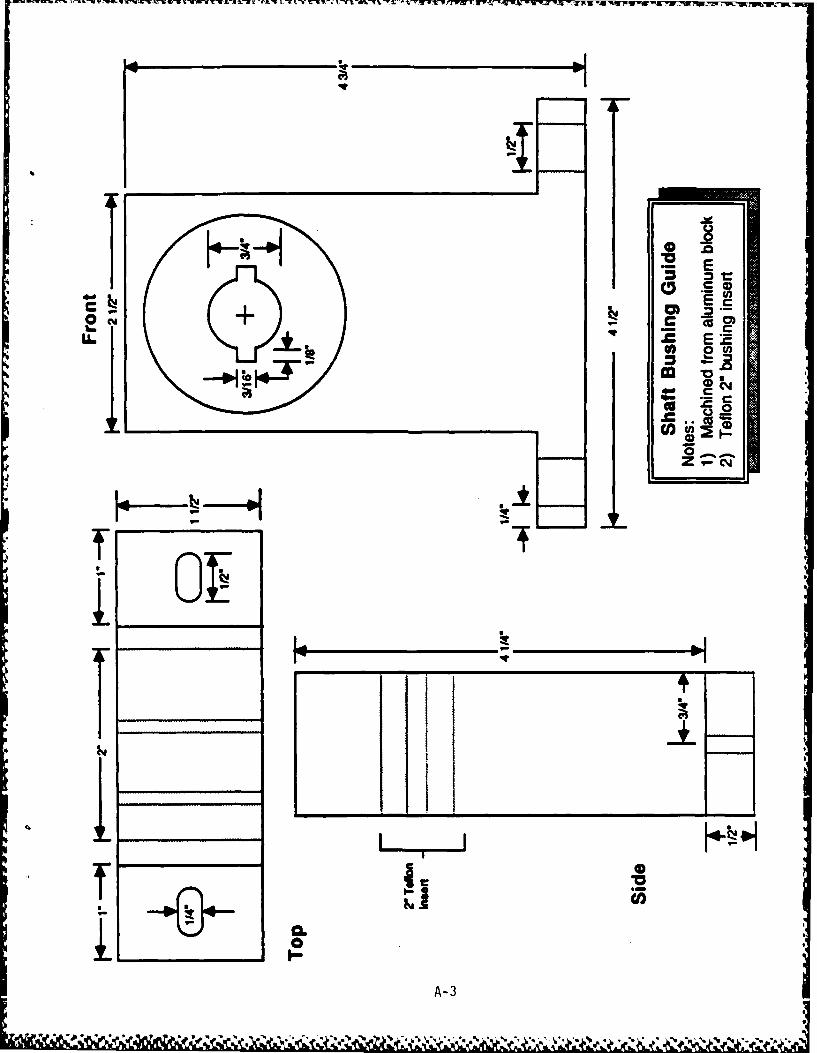
E S
0.1
IA-3
iZti OI-%k*NSO
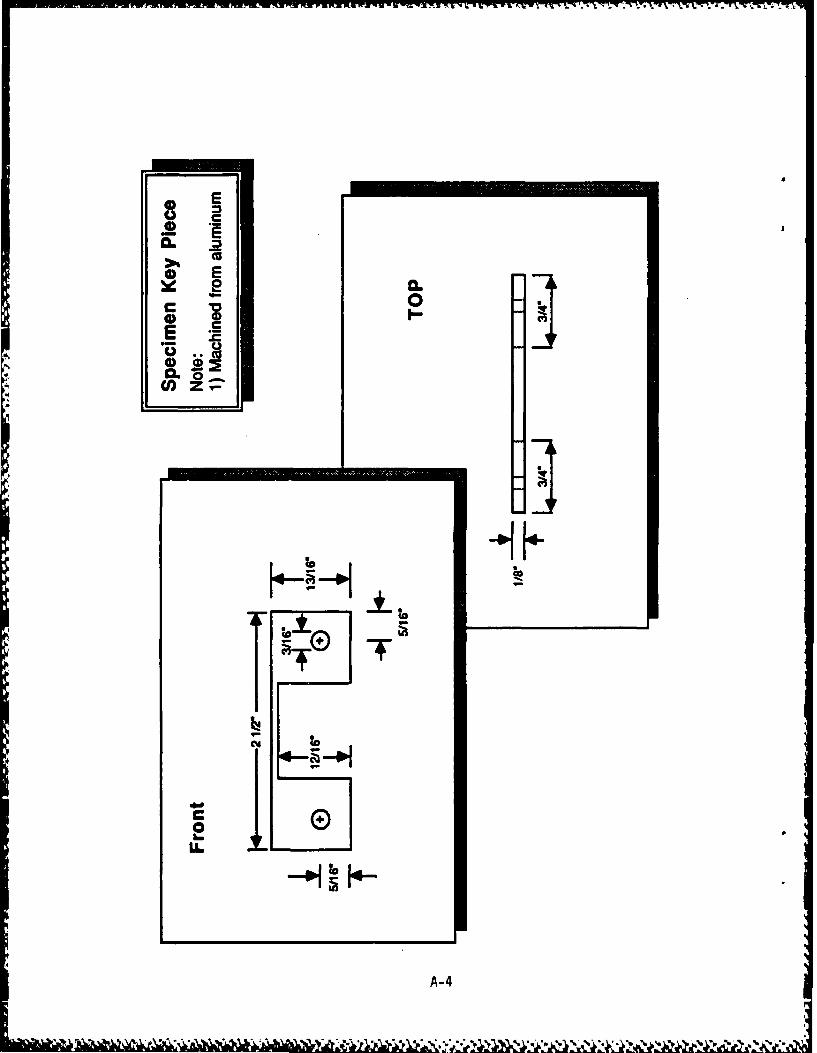
210C
on v2L
A-4
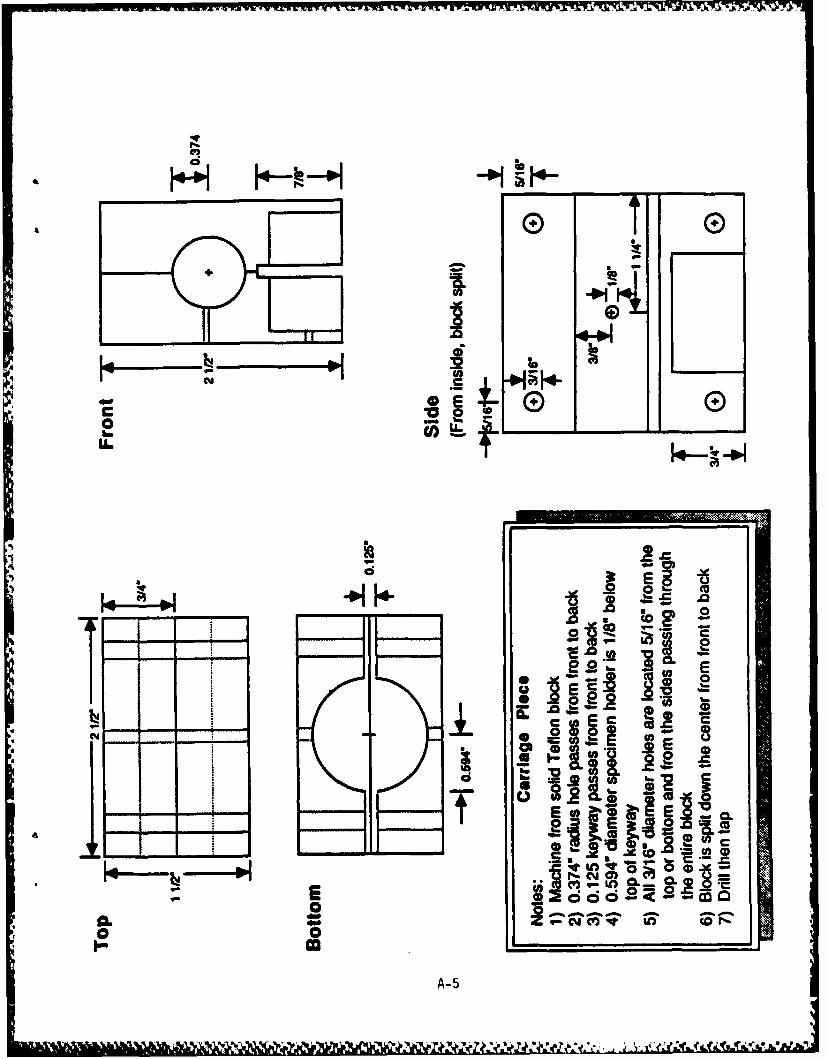
-00
s44
00
oo E
a C
0 e
ivML
A-5
lot IIiI 110

16.0.
D
moo