o9034 - dtic
TRANSCRIPT
SCLASSIFIED M'ASTER COPY FOR REPRODUCTION PURPOSES(_JTYT CLASI ICATION OF TMIS PAGE
1a.REOR SCUITYCLSSFIATONREPORT DOCUMENTATION PAGEis RPRTSEUIT CASIICTON1. -.ESTRICTIVE MARKI(NGS f FL U1
Ln 2a. SECURITY CLASSIFICATION AUTHiORIT Y 3. DWSRIBIJTIONIAVAl..ABILITY OF REPORT
()20. DECLASSIFICATION IOOWNGRADING SCHEDULE Approved for public release;distribution unlimited.
4. PERFORMING ORGANIZATION REPORT NUMBER(S) 5. MONITORING ORGANIZATION REPORT NUMBER(S)
ba6. NAME OF PERFORMING ORGANIZATIO.- ft, CFFIcE SifMBO'. 7&. NAVE OF MONWTOR;NG ORGANIZATIONMassachusetts Institute of (N applicable)
Technology, Civil Engirseerin~ CCRE/PACT U. S. Army Research Office6 c. ADDRESS (City, State, and ZIP Code) 7b. ADDRESS (City, State, and ZIP Code)** 77 Massachusetts Avenue j, Room 1-175 P. 0. Box 12211
* ~Cambridge, MA 02139 Research Triangle Park, NC 27709-221)
B.. NAME OF FUNDING /SPONSORING Bb. OFFICE SYMBOL 9. PROCUREMENT INSTRUMENT IDENTIFICATION NUMBERORGANIZATION . j(if applicable)Ii. S. Army Research Office on0/C600
Bc. ADDRESS (City, State, and ZIP Code) 10 SOURCE OF FUNDING NUMBERS
P. 0. Box 12211 PRGA PROJECT ~TASK CKN
Research Triangle Park, NO. 27NO.ý21 JL
11. jITLE (include Security ClassificatioN~Optimum Design Methods for Structural Sandwich Panels M 4, l
12. PERSONAL AUTHOR(S) Gibson, Lorna J.
113a. TYPE OF REPORT 13b. TIME COVERED 114. DATE OF REPORT "oer, Month, Day) 5. PAGE COUNTF~Technical mj~om 1/87 TO 12/87 j.1 January 98 60
16. SUPPLEMENTARY NOTATIONThe view, opinions and/or findings contained in this report are tho:
of,;e auh~r$).ad shiu~ ~ a~,an~ffcia1De!rtment of the Army posit:17. COSATI CODES 18. SUBJECT TERMS (Continue on reverse if necessary a" identify by block number)
FIELD GROUP SUB-GROUP Advanced construction materials; structural composites;
I sandwich panels.
'9. ABSTRACT (Contiou on reverse if necessary and identify by block number)
trZuctural .sandwich panels are composed of two thin, stiff skinsseparated by a light weight core. The faces are typicallystrong materials such as aluminum fiber reinforced composites,while honeycombs or foams are used in the core. The separationof the faces i.ncrease the moment of inertia of the panel wi.thmini-mum increase in weight. Because of this, these panels areextremely efficient in bending and are used in applicationswhere the weight of the member is critical: aircraft, marine,And land vehicles; portable structures; construction in remote
modern downhill skis). In all of these, the mechanical behavioraes rofnrhls n sm ye fsotseupet (-.
20. DISTRIBUTION /AVAILABILITY OF ABSTRACT 21. ABSTRACT SECURITY CLASSIFICATIONOUNCLASSIFIEDIUNLIMITED 13 SAME AS RPT. QDTIC USERS IUnclassified
22a. NAME OF RESPONSIBLE INDIVIDUAL 1 220. TELEPHONE (include Area Code) 122c. OFFICE SYMBOL
DO FORM ¶1473,84 MAR 83 APR edition may be used until exnausied. SECURITY. CLASSIFICATION OF THIS PAC.All other editions are obso~ete.
~ Q u;LiASS_21EDBest Available Copya o9034 0q'
II
UH4AISSIFIEDWL o °CUPlTY CIAMIIPCAnTIOe Or TwIs PAlsC
o! the sandwich panel depends on the strength and stiffness
of the face and the core, on the geometry of the panel (thecore and face thicknesses), and on the bond strength betweenthe faces and the core.
Previous optimization stu 4es have centered on defining thebest geometry of the panel t the material properties of theface and core, including the ce density, are specified.However, recent work on material operty-density relationshipsfor foamed core materials now allows e- core density to beincluded as a variable to be opt mized. he goal of thisresearch is to determine the core density as well as the coreand face thicknesses that minimize the weight of a sandwichpanel for given structural requirements. This will improve theminimum weight design of structural sandwich panels in a mannernot previously possible. uoý
Aocession For
NTIS GRA&ZDTIC TABUnannouaced 1'3Justitfoatio-
Distribution/Availability Codes
ivaiA ed jorDist Special
UNCLASSIFIED
SECURITY CLAASIP CAflOik OF THIS PAGE(%.
a A
/
OPTIMUM DESIGN METHODS FOR STRUCTURAL SANDWICH PANELS
ARO PROGRAM IN ADVANCED CONSTRUCTION TECHNOLOGY
FINAL REPORT
L.J. GIBSONWINSLOW ASSOCIATE PROFESSOR OF CIVIL ENGINEERING
DEPARTMENT OF CIVIL ENGINEERINGMASSACHUSETTS INSTITUTE OF TECHNOLOGY
CAMBRIDGE, MA 02139
1JANUARY 1988
Best Available Copy
,• ° 0 o °0 0 o o ' ° ~
OPTlMLM DESIGN METHODS FOR STRUCTURAL SANDWICH PANELS
1. 'Introduction .............................. 3
2. Debondina in Foam Core Sandwi-h Pan(. s ............ 11
2.1 Introduction ................................ 11
2.2 Analysis 132.3 Experimental Method......................2.4 Results and Discussion ....................... 222.5 Conclusions .......... .. 252.6 References ..........................
3. Minimum Weight Design of Sandwich Panelsfor a Given Strength ............................. 28
3.1 Introduction ................................ 283.2 Analysis .................................... 293.3 Conclusions ................................. 453.4 References ............ ....................... 49
* 4. Creep of Sandwich Panels ......................... 50
4.1 Introduction .................................. 50i 4.2 Models for Creep in Polymers and Foams ....... 50
4.3 Future Work ....... .......................... 554.4 References ....... ...........................
5. Conclusions . ...................................... 58
, 6ý Appendix - List of symbols ....................... 59
2
II
OPTIMUM DESIGN METHODS FOR STRUCTURAL SANDWICH PANELS
1. Introduction
Structural sandwich panels are composed of two thin, stiff
skins separated by a lightweight core. The faces are typically
strong materiels qnch, as aluminum or fibre reinforced con.poqites,
while honeycombs or foams are used in the core. The separation
of the faces increases the moment of inertia of the panel with
minimum increase in weight, giving a panel that is extremely
efficient in resisting bending and buckling. Because of this,
sandwich panels are used in applications where the weight of the
member is critical: in aircraft, marine and land vehicles; in
portable structures; in construction in remote areas; in roofing
shells; and in some types of sports equipment such as modern
downhill skis. Sandwich construction is even found in nature
where mechanical design is often optimized: in the skull, two
layers of dense, cortical bone are separated by a lightweight
core of sponge-like cancellous bone. In each case, the
mechanical behaviour of the sandwich panel depends on the
strength and stiffness of the face and core materials, on the
geometry of the panel and on the strength of the bond between the
faces and the core.
The aim of this project has been to find the minimum weight
design of a foam core sandwich panel for a given required
strength. The optimization analysis for this problem is
complicated by the fact that the sandwich may fail by one of
several different modes. The face may yield in tension or may
3

• o0 o0,00 C ooo o -oo •
compress
buckle locally in compression (or "wrinkle". The core may fail
in tension, compression or shear. And finally, the bond between
the faces and the core may fracture causing delamination. Each of
these failure modes is described by a different failure equation.
There is not A single, well defined constraint equ tior for the
required strength., then; instead; there is a set of contraint.
equations. The critical one for a given loading configuration
and beam design, occurring at the lowest load, must be determi'ned
to carry out the optimization analysis.
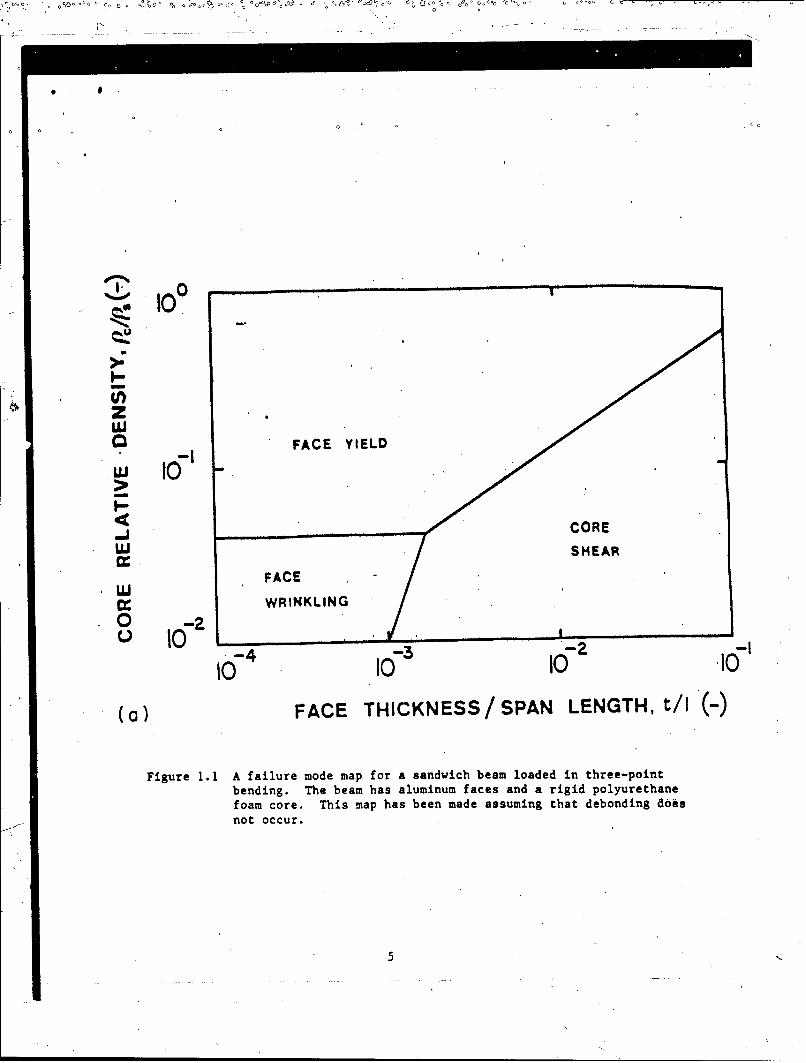
Failure mode maps, showing the range of beam designs for
which a'given failure mode is critical, have been developed in a
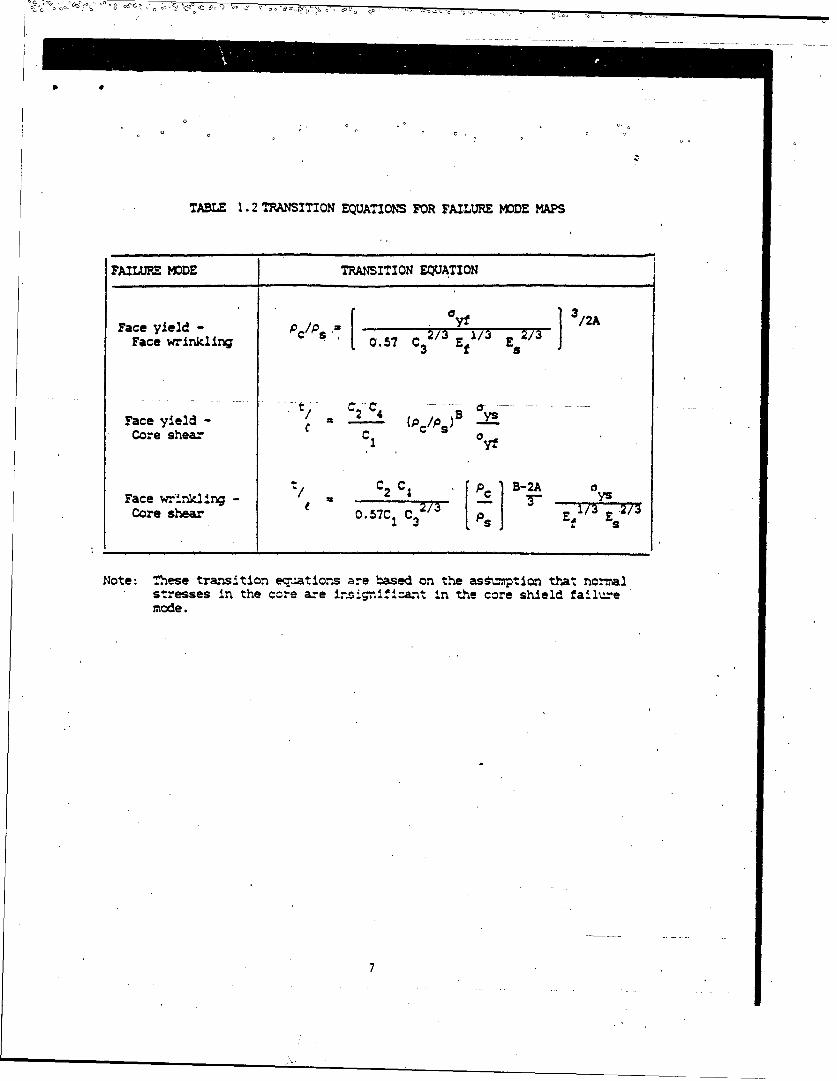
previous project (Fig. 1.1). Briefly, they are constructed by
equating pairs of failure equations in turn to give the equations
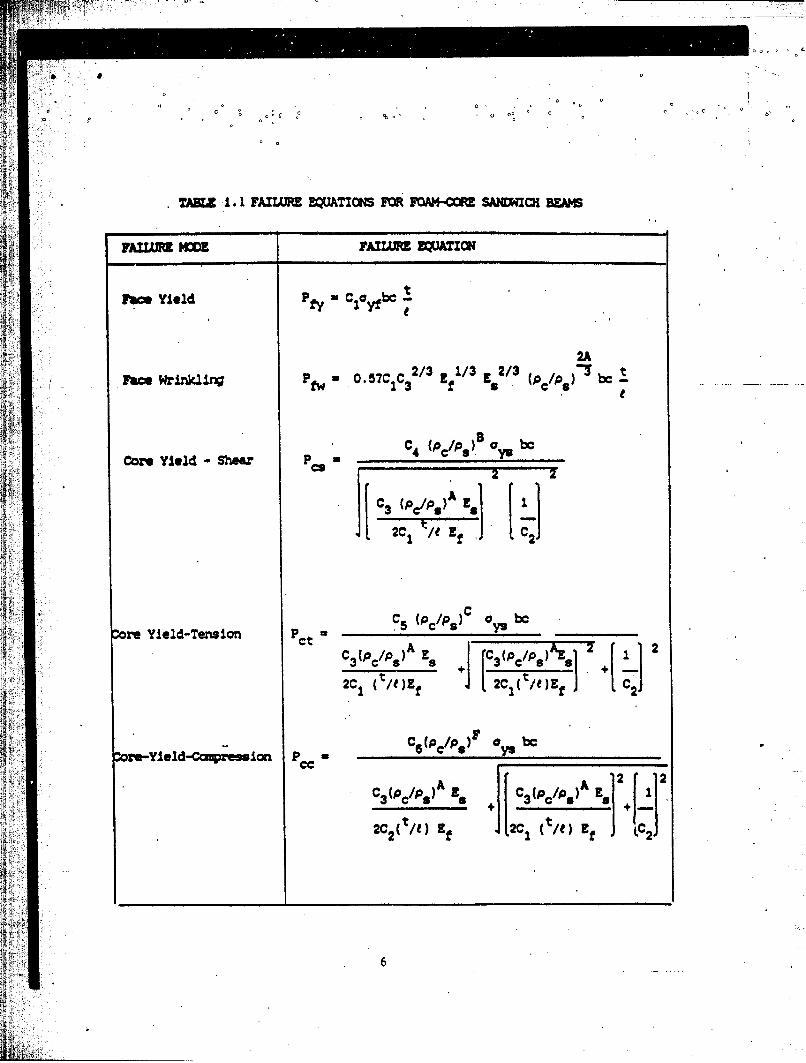
of the transition lines between failure modes. The failure
equations and transition line equations for foam core sandwich
beaths are given in Tables 1.1 and 1.2; the nomenclature is given
in the Appendix to the report. To simplify the development of
the failure mode maps, only the failure modes listed in Table 1.1
were considered; in particular, it was assumed that the bond
between the faces, and the core was perfect and that debonding did
not occur.
To proceed with the minimum weight analysis of a foam core
sandwich beam we proposed the following tasks for this project:
4
o 0. C~o0 . ~
01 00
SIo
%O0
'I:
I-U
* FACE YIELD
'0-
-j CORESHEAR
FACE
er, WRINKLING
0
10 10 10 -10
(a) FACE THICKNESS/SPAN LENGTH, t/I (-)
Figure 1.1 A failure mode map for a sandwich beam loaded in three-pointbending. The beam has aluminum faces and a rigid polyurethanefoam core. This map has been made assuming that debonding doesnot occur.
5 -
70 0
TAKZ 1.1PM IAIH FAMUR FOAM-OM SAIDCC BEAM'S
FAMFAILURE IQ=E
ram Yield C a bet
2AFa~rin.1ig ~ O.7C2/3 1/ 3 2/ 3 p7p)bc5.
I*=wrnkin p w . 7C1 3 E Es (C/s
c C(p /P) a be
COxe Yield - Show~ Vt cs
C3 r/p.p5 A E. jC(cP A 1 ij
)AS
:r*-Yield-Te~ns ion CePctg o, AbE 2
C 3(p/ps) AS c 3 (pc/p.)A Es 2 j 2
2C 2(E E~ f 2C I (t/l) E 4 C6
0 / • • .. - 0 ' o•• "•; oj " oC
TABLE 1.2 TRANSITION EQUATIONS FOR FAILURE MODE MAPS
FAILURE MODE TRANSITION EQUATION
Face yield - ac/p .= 2 /3 32i /2APC S 2/3 1/3 =Face wrinkling S 0.57 C E f J
Face yield - C2= C (p//P) 3 a
Core shear. C1 s yt
t C 2C 4 -2A YFace wr'.nkllng - 1./7...Core shear 07
Note: These transition eqatlo-•s are based on the asg-nption that normalstresses in the core are ir i~±±a~t ±n the core shield failuremode.
7
(a) Failure Mode Map Finalize the Debonding Mechanism
The analysis of debonding in sandwich beams is incomplete;
to properly understand how debonding and delamination occur
requires the application of fracture mechanics'to the problem. A
crack in the bond will propagate (and cause debonding failure)
when the stress field around the crack produces a stress
intensity factor equal to the fracture toughness of the adhesive.
The analysis of the stress field around the crack is complicated,
but a simple dimensional argument can be used to characterize the
important parameters in'crack propagation. Experimental
measurements of the load required to propagate a crack of known
length can then be used to calibrate the dimensional analysis to
get a more exact description of crack propagation. In these
experiments, sandwich beams with deliberate areas of debonding in
them, simulating "cracks" will be made. The debonded area can be
made by inserting a thin piece of plastic between the face and
the core so that no adhesive reaches this area. The crack length
is given by the length of plastic strip used. The beams will
then be tested in bending to produce a debonding failure; the
failure load will be recorded. This will be repeated for
different crack lengths. This procedure should allow a complete
characterization of the debonding process in' sandwich beams.
SoB
(b) Optimization Analysis of a Sandwich Beam subject to a
Strength Constraint
In this part of the project we will do the optimization
analysis for the strength constraint. This can be done by using
each failure equation in turn as the constraint eouation in the
optimization analysis and then comparing all the results to
determine thp minimum weight solution. This, however, is time
consuming and laborious, as the equations may not have closed
form solutions . We intend to try to use the information given
by the failure map to simplify the optimization procedure; the
details will be worked out during this task.
Cc) Experimental Verification of the Optimization Analvsis
The properties of the foam to be used in the core of the
sandwich ',eams will first be measured so that the exact property-
density relationships can be used in the optimization analysis.
Then, a series of sandwich beams, of varying weight but constant
strength, will be designed, made and tested to failure in
bending. Load-deflection plots will be recorded for each beam
and the mode of failure noted. We will also take photographs of
the failed beams. If the results of the tests agree with the
analysis, they will increase confidence in it; otherwise they
will be helpful in indicating the deficiencies of the analysis.
The debonding study and the optimization analysis of a
sandwich beam subject to a strength constraint have been
completed and are described in more detail below in Sections 2
9
F I311,'-4 - 7ý
aand 3. The experimental verification of the optimization
analysis has been omitted as the only tests that could be done
would duplicate ones done earlier in another study. Instead, we
have begun.-work on modelling creep in foam core sandwich panels;
this wetx is dksc'ribrd in Section 4.
11'
i•!:!N
[ f2
44°
gr;10
o ;4 : -

2. Debondih- in Foam Core Sandwich Panels
2.1. Introduction
Structural members made up of two stiff, strong skins
separated by a lightweight core are known as sandwich panels.
The senaration of the skins by the core increases the moment of'
inertia of the panel with little increase' in weight, producing an
efficient member for resisting bending and buckling loads. The
low weight of sandwich panels was first exploited by the aircraft
industry; ultra-light panels using carbon fibre-composite skins
and honeycomb cores are now used routingly in modern aerospace
components. Sandwich panel technology is now being transferred
to building applications such as roof and wall panels; the cores
of such panels are typically made of foam to give good thermal
insulation in addition to low weight.
It is critical that the bond between the skins and the core
remain intact for the panel to perform satisfactorily. In this
paper, we describe the criterion for debonding in a sandwich beam
with isotropic faces and a foam core in terms of the critical
strain energy release rate. Tests on sandwich beams with
aluminum skins and foamed polyurethane cores show that the
analysis describes debonding faiOre well. Comparisonoof the
load for debonding with that for other modes of failure, such as
face yielding, face wrinkling and core shearing, show that
debonding occurs only if there are relatively large pre-existing
cracks at the interface; otherwise it is preceded by another mode
of failure. The results are useful in determining the maximum
11
o!~~~~11 o o e+• +oo+ o
1 0
permissible interface crack for a sandwich panel with a foam
core.
The propagation of a crack at the interface between two
dissimilar elastic media has been.studied by several workers.
England MI] calculated the stress intensity factor for normal
loading of an interface crack between two dissimilar elastic
media; this solution suffers from the difficulty that it requires
the two materialq to wrinkle and overlap near the-ends of the
crack which is physically unrealistic. Comninou 12-41 reexamines
England's solution and finds that if a frictional contact zone is
introduced at the ends of the crack, a more realistic solution is
possible. Sh- calculate's the stress intensity factor for both
normal [2,3] and shear [4] loading. The difficulty with such
analyses is that they are difficult to implement as the size of
the frictional zone ahead of the crack tip must be estimated.
Other workers, concerned with debonding in fibre composi e
laminates, have examined a more complex crack geometry w'th a
through crack in one layerrunning into a perpendicular nterface
crack between that layer and the next [5-9]; these analyses use a
complex variable formulation'to reduce the problem to a set of
integral equations which are solved numerically. Here, ge treat
the problem of the propagation of an interface crack in
sandwich panel with isotropic faces and a foamed core in a
simpler manner, by examining the strain energy release rate
required for crack propagation and measin'i-ng the critical strain
12
ojV
-oc -C oc '-o~c % ;C C~ ~ "-c ~ c~
oc
energy release rate of the interface experimentally.
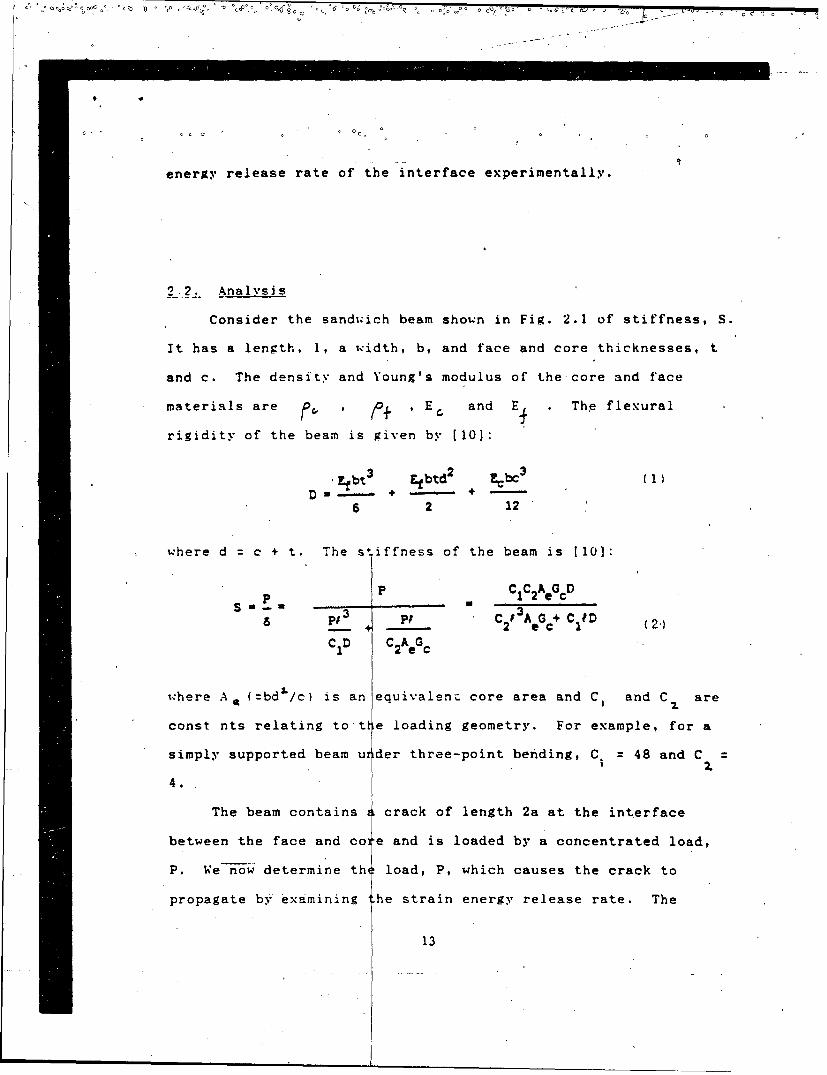
22. Analysis
Consider the sandwich beam shown in Fig. 2.1 of stiffness, S.
It has a length, 1, a width, b, and face and core thicknesses, t
and c. The density and Young's modulus of the core and face
materials are , 0+ ,E and E Th. flexural
rigidity of the beam is given by [10]:
EKbt3 F.btd2 Ecbc3 (1)
6 2 12
where d = c + t. The stiffness of the beam is 1101:
S p P CIC2AeGCD
- 3Ep3 P; C2 3AeGc+ C ID (2)
CID C2AeGc
where A. (:bd&/c) is an equivalenz core area and C, and C are
const nts relating to tte loading geometry. For example, for a
simply supported beam urder three-point bending, C. = 48 and C -
2.
4.
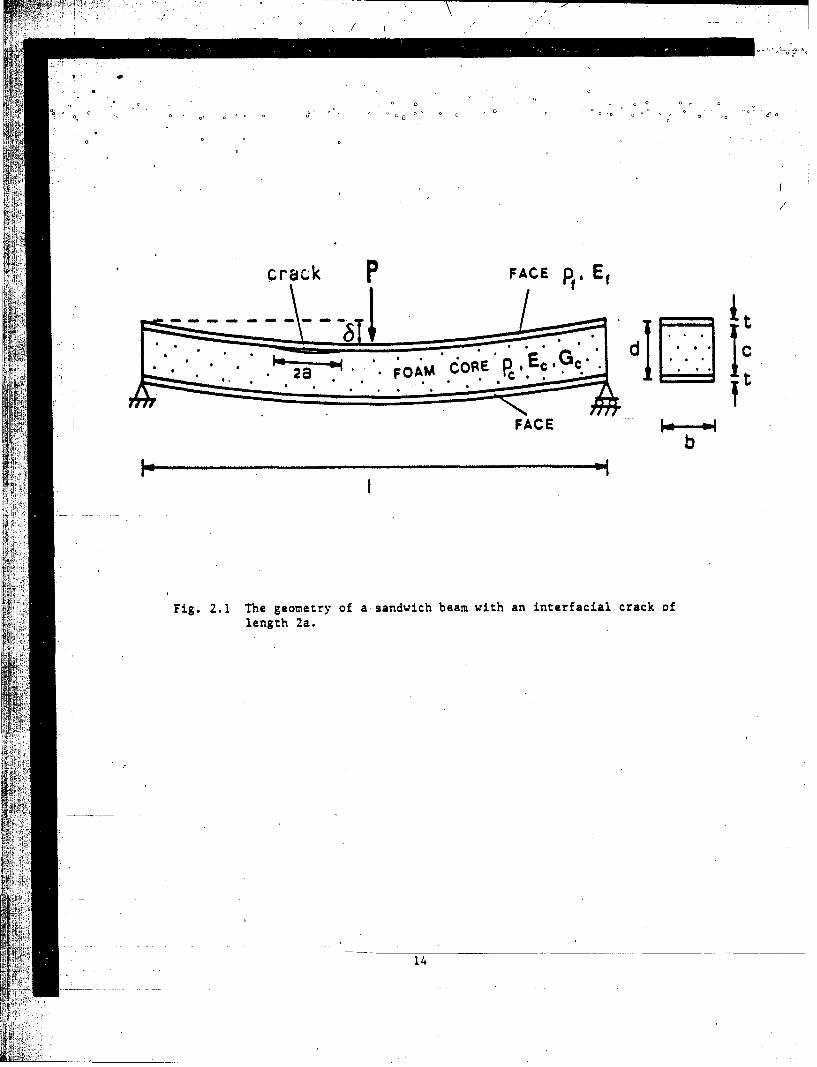
The beam contains E crack of length 2a at the interface
between the face and core and is loaded by a concentrated load,
P. Wenowi determine the load, P, which causes the crack to
propagate by examining he strain energy release rate. The
13
f C
i5Tc
crack P ~FACE pE
. .0 . C. 0 . . .,C c
b.
Fig. 2.1 The geometry of a sandwich beam with an interfacial crack oflength 2a.
14
C'4• ::
COC !:
te core . is
V 2 S b/ c
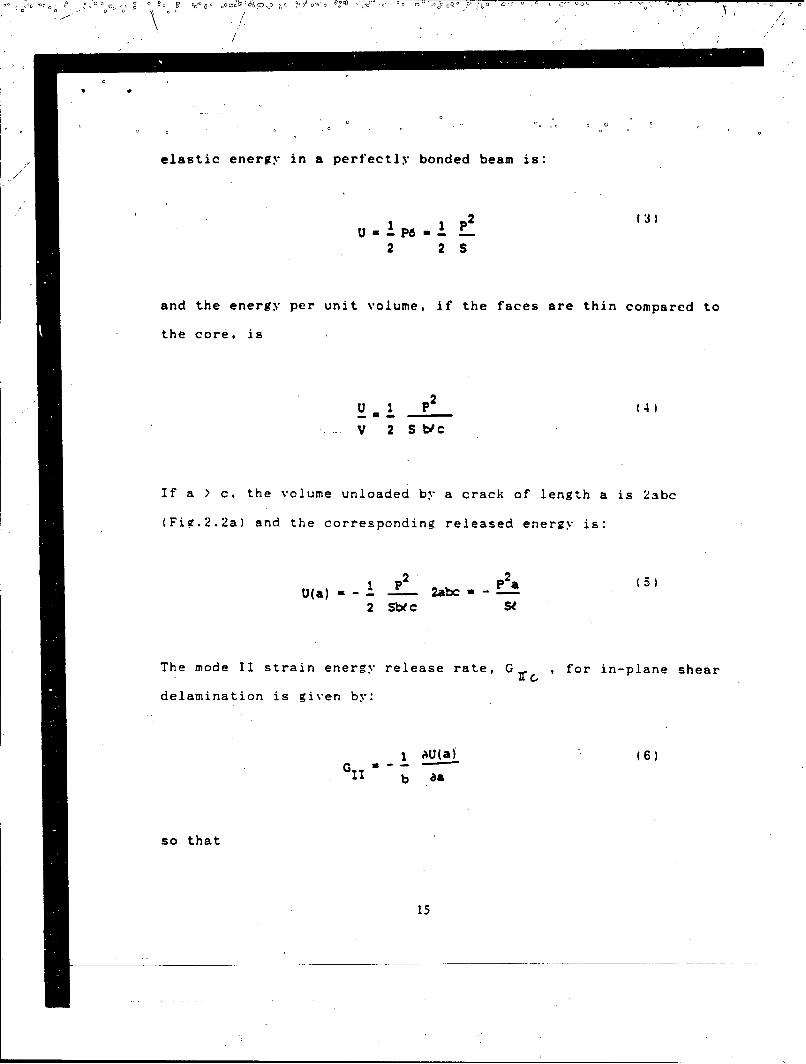
elastic energy in a perfectly bonded beam is:
2 2 S
and the energy per unit volume, if the faces are thin compared to
the core, is
Ui 1 p2 (4)
... V 2 S1•c
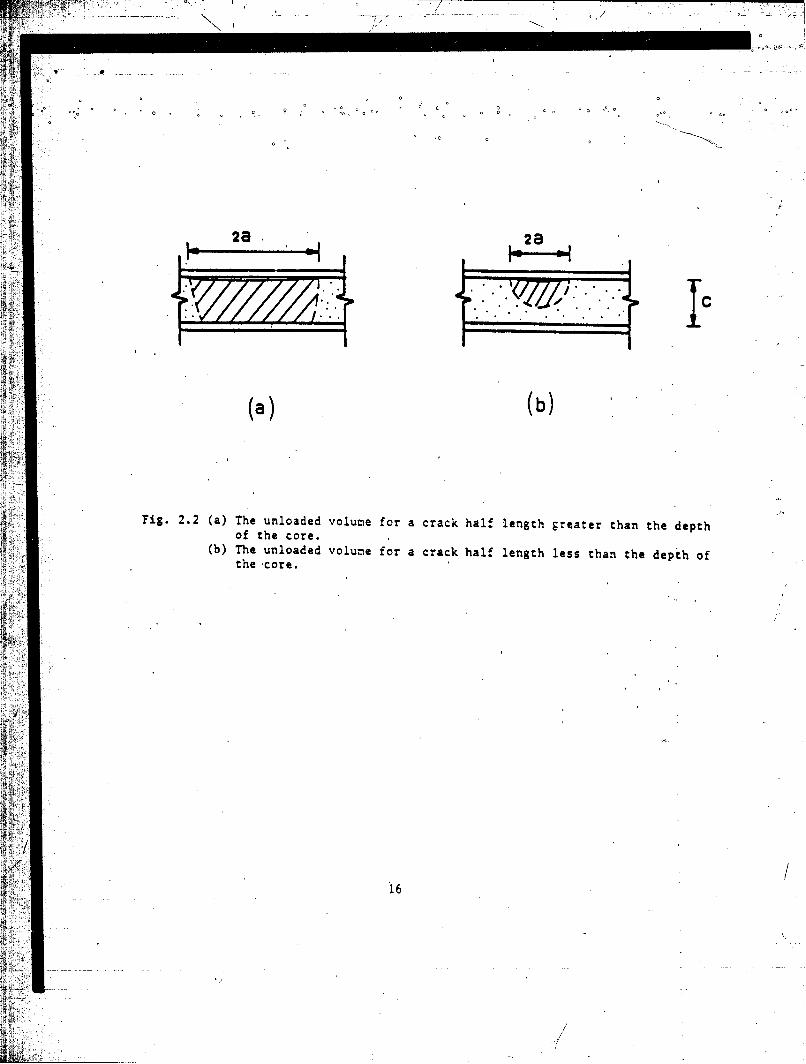
If a > c, the volume unloaded by a crack of length a is 2abc
(Fig.2.2a) and the corresponding released energyv is:
¶ p2 p2a ( 5)
U(a)=-- -- 2abc=-2 StI c Se
The mode II strain energy release rate, G. , for in-plane shear
delamination is given by:
all(al (6)0II ="b •a
so that
15
T"1
2a 28a
Fig. 2.2 (a) The unloaded volume for a crack half length greater than the depth4 of the core.(b) The unloaded volume for a crack half length less than the depth of
the -core.
16
•; o• °°° °o °o°°°0o - ° °°
/r
0 0 0 0 ° o
S, ( 17)Sb/
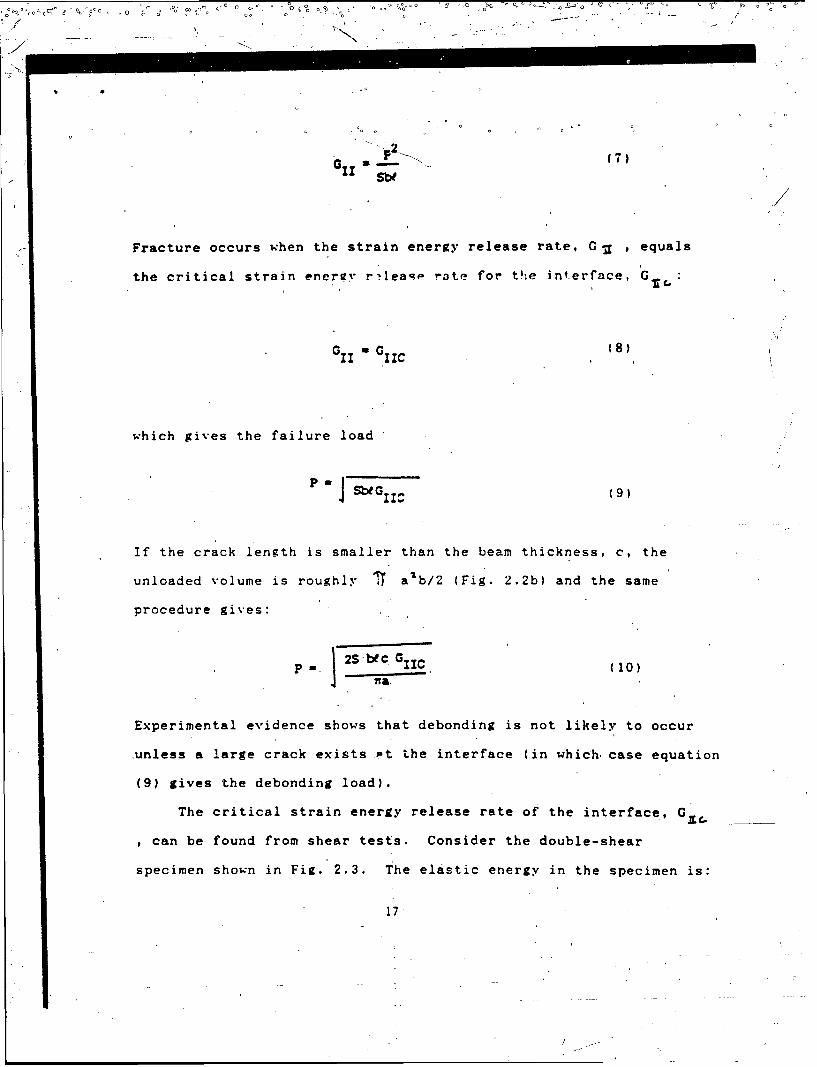
Fracture occurs when the strain energy release rate, GZ , equals
the critical strain energr rleaqP rote for the interface, G
G iI - 1Ci ( 8 )
which gives the failure load -
J SbeG~c (9)
If the crack length is smaller than the beam thickness, c, the
unloaded volume is roughly T a'b/2 (Fig. 2.2b) and the same
procedure gives:
p -2Sb"cGIzc (10)
Experimental evidence shows that debonding is not likely to occur
unless a large crack exists Pt the interface (in which- case equation
(9) gives the debonding load).
The critical strain energy release rate of the interface, G __
can be found from shear tests. Consider the double-shear
specimen shown in Fig. 2.3. The elastic energy in the specimen is:
17

aluminum. F
0 0
aluminum . F-bars 2
2• 2
SI "~iJ
(a) b
~Fig. 2.3 •()The double-shear test specimens used to measure the criticalstrain energy release rate of the interface.
(b) The loading on one half of the double-shear specimen.
1 18
Q. -o o .v
4
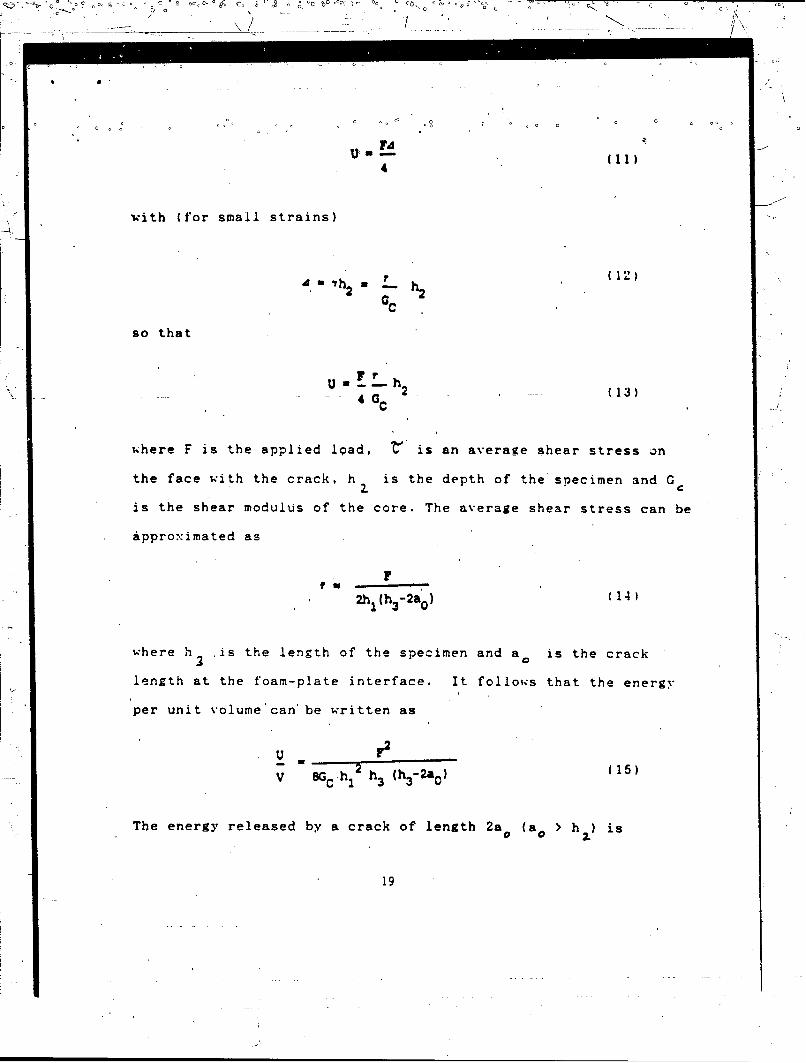
with (for small strains)
r 'h(12)
so that
4 GU 2 (13)
where F is the applied Ioad, t is an average shear stress on
the face w'ith the crack, h is the depth of the specimen and G2. C
is the shear modulus of the core. The average shear stress can be
approximated as
2hI(h 3 -2a 0 ) (14)
where h is the length of the specimen and a. is the crack
length at the foam-plate interface. It follows that the energy
per unit v'olume'can' be written as
u 72-2 (15)
V C .h h13 (h13 2a 0 )
The energy released by a crack of length 2a (a > h ) is
92.
19
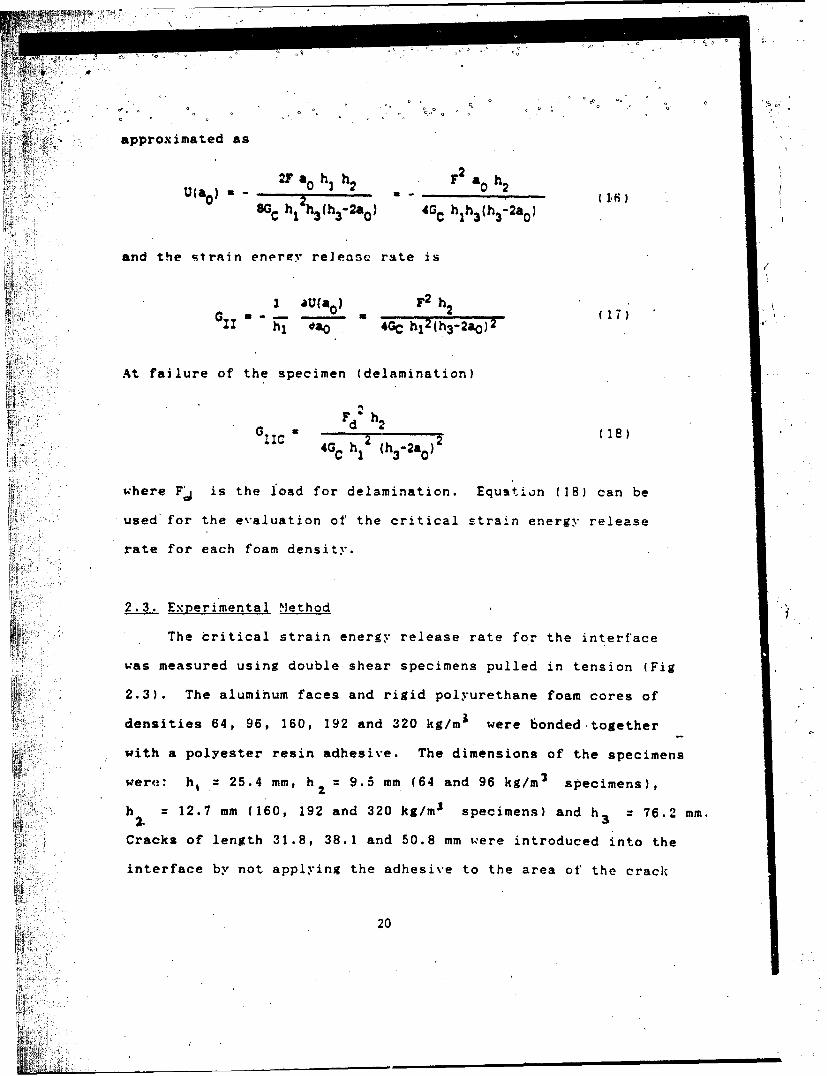
•;}•: • approximated as ,
2F a0 h h2 F2 a0 h2U(aO, 0"h 2 2 0 2S' ( 40C h0 h 3 h3-2a0)
and the gtrain enerry releane rate is
I,' I WUaO) F2 h
G11* 0- 2 (17)h I daO 4GC h,2(h3-2a0 )
2
At failure of the specimen (delamination)
Fd h2
IIC 2Gh (h 2a)()
w'here F•is the l'oad for delamination. Equatbain (38) can be
used for the evaluation of the critical strain energy release
rate for each foam density.
2.3. Experimental Method
The critical strain energy release rate for the interface
was measured using double shear specimens pulled in tension (Fig
2.3). The aluminum faces and rigid polyurethane foam cores of
densities 64, 96, 160, 192 and 320 kg/rn3 were bonded-together0
with a polyester resin adhesive. The dimensions of the specimens
11 were: h,,= 25.4 mm, h 9.5 mm (64 and 96 kg/mr specimens),
h =12.7 mm (160, 192 and 320 kg/m3 specimens) and h3 76.2 mm.
Cracks of length 31.8, 38.1 and 50.8 mm were introduced into the
0 interface by not applying the adhesive to the area of the crack
20
1! :
!?]
00C oo
So 0 o 0
and by inserting a removable plastic strip into the crack while
the specimens were pressed together and cured. The specimens
were loaded in tension in Instron testing machine and the load
and deflection recorded. Three specimens of each crack length
ard density were tested. Dpbonding did not ncrur in the C4 and
96 kg/mn density foam specimens even when the crack length was
two thirds of the length 6f the specimen; instead these specimens
failed by plastic shearing of the foam. The 160, 192 and 320 kg/m3
specimens failed by crack propagation along the interface.
In the case of the 160 and 192 kg/mr specimens, the crack
propagated through the foam adjacent to the interface, while in
the 320 kg/M 3 specimens it propagated within the adhesive layer.
The load, deflection behaviour was linear to failure for all three
densities.
The shear moduli of the foams were measured on double shear
specimens with no interface crack. The dimensions of the
specimenswere h 25.4 mm, h 2 9.5 mm and h3 76.2 mm. The
specimens were loaded in tension and were linear elastic.
A set of sandwich beams was made by bonding aluminum skins
to rigid foamed polyurethane cores with polyester resin.
Interface cracks of known length were introduced by the same
method as in the critical strain energy release rate tests. A
range of beam designs were tested. The beams were loaded to
failure in three point bending using a screw jack. Load and
deflection were measured during the test with a load cell and a
21
le es t u c w
th inefc thog th om
0 0
C;• C: . o 0 o 00 o oO o0 oO o co
•!;#0; LVDT and were recorded on an .-Y recorder. The beams were
•_ ~linear-elastic to failure w'hich was by crack propagzation along
•;•:"•the interface througzh the foam.
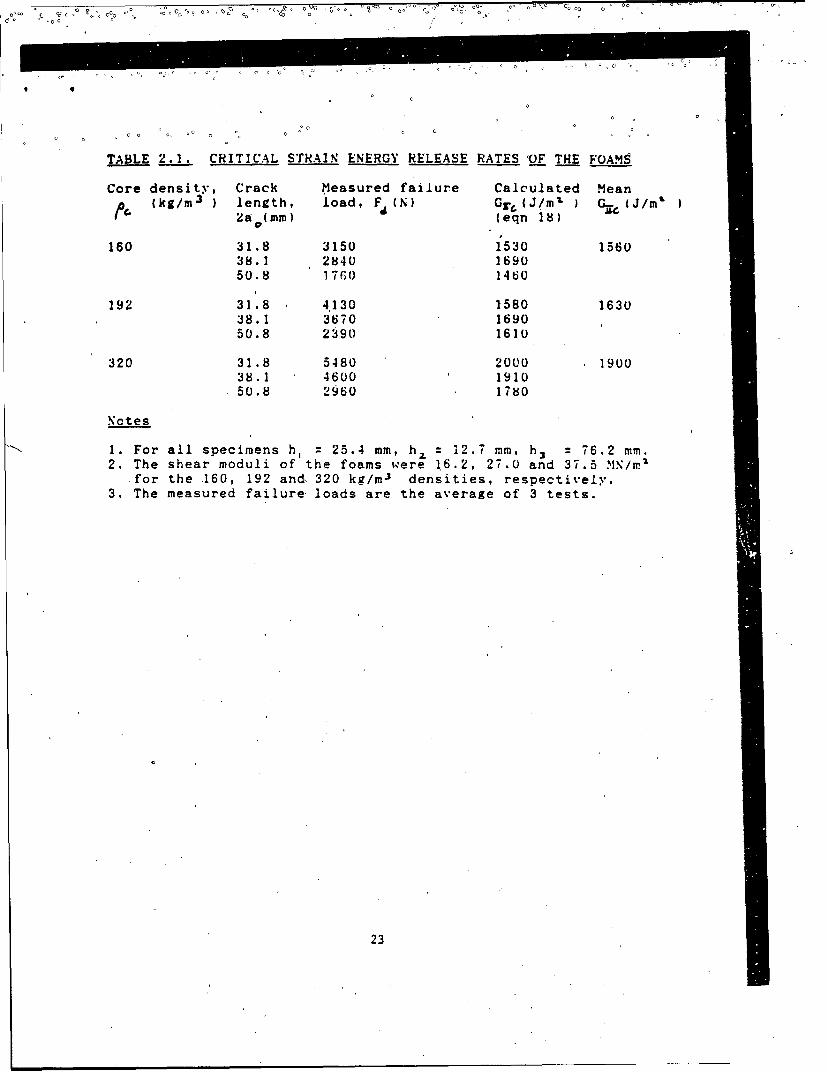
"2.4 Results and Discussion
The critical strain energy release rate was calculated from
the double shear tests using equation (18); the results are given
in Table 2.1 for each o' the foam densities tested for which
debonding occurred. G is independent of the length of the
crack along the interface. For the two lower density foams
for which the crack prmpagated through the foam along the
interface, GE corresponds to the surface energy of the foam at
the interface. The largest value of GrE , for the 320 kg/m 3
foam for which the crack propagated through the adhesive,
corresponds to the surface energy of the adhesive. There is a
transition from crack propagation in the foam to crack
propagation i6 the adhesive at a foam density between 192 and 320.
kg/mr
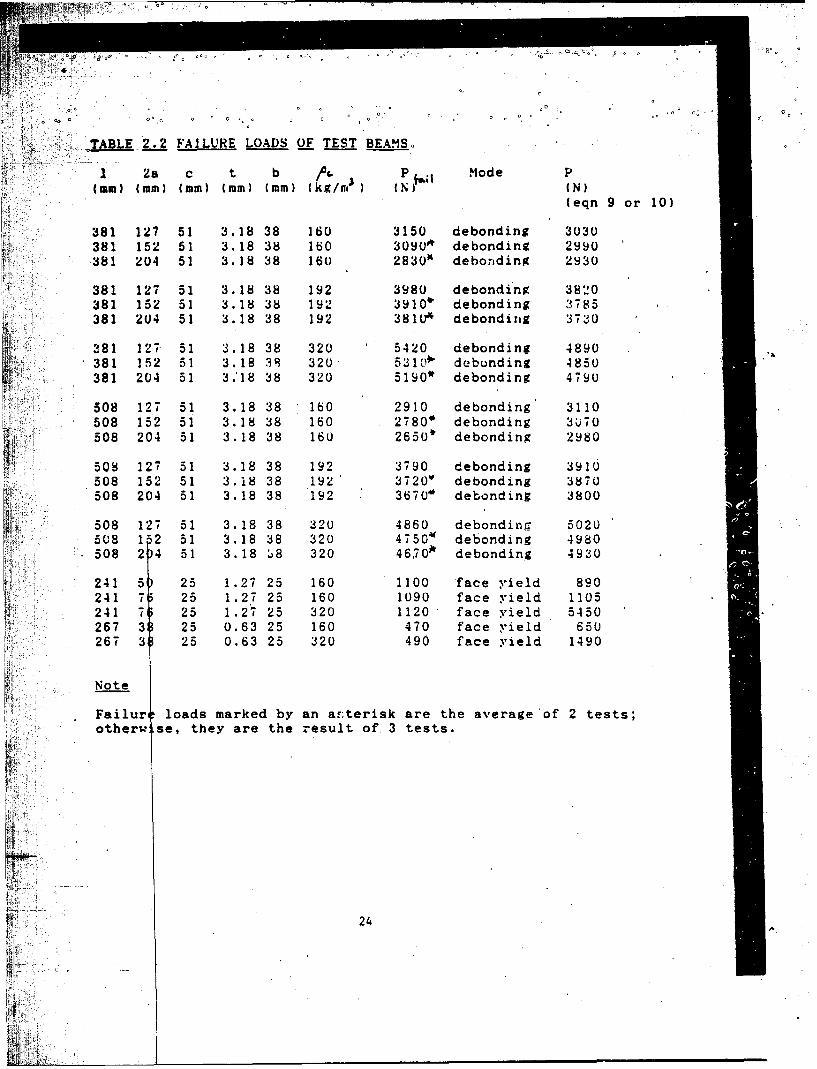
* The failure modes and loads of the sandwich beams are listed
in Table 2.2 along with the expected load for debonding failure
(equation (9) or I10), depending on the crack length). The beams
with interfacial acks which are largE relative to the core
thickness, c, failed by debonding. There is a slight dependence
of the failure load on the crack length, 2a, with the debonding
load decreasing by about 5% as the crack length increases from
127 mm to 204 mm. The agreement between the measured and
~CI~ 22
F C C C C % C 0
C" C" " o'- o dO° ' oC. ° o
TB 2. CI A C E R CA
(kg m- le g h oo d F (N Gr (j m2 G,- :•• ' J/°°m • •°o•
C. 2 1 9
TABLE 2.1. CRITICAL STRAIN ENERGY RELEASE RATES VOF THE FOAMS
Core density, Crack Measured failure Calculated Mean•€ (kg/rn3 ) length, load, F (N) GT•(J/mL ) G-(Jim'
(2a 0 (mm } (eqn 18)
160 41.8 3150 1530 156038.1! 2840 1690
50.8 1760 1460
192 31.8 4,130 1580 163038.1 3670 169050.8 2390 1610
320 31.8 5480 2000 190038.1 4600 191050.8 2960 1780
Notes
1. For all specimens h, = 25.4 mm, h. 12.7 mm, h 3 - 76.2 mm.2. The shear moduli of the foams were 16.2, 27.0 and 37.5 MN/rrn
for the .160, 192 and, 320 kg/mr3 densities, respectively.3. The measured failure loads are the average of 3 tests.
23
a: 0 a o o~ o a a 0 o a a
S TABLE 2.2 FAILURE LOADS OF TEST BEAMS.
1 2a C t b A& P i,;I Mode PK (mm) (mm) (mm) (mm) (mm) (kg/ni) IN IN)
(eqn 9 or 10)
381 127 51 3.18 38 160 3150 debonding 3030381 152 51 3.18 38 160 30900 debonding 2990381 204 51 3.18 38 160 2830* debonding 2930
381 127 51 3.18 38 192 3980 debonding 382-10381 152 51 3.18 38 192 3910* debonding 3785381 204 51 3.18 38 192 381Le debonding 3730
381 127 51 3.18 38 320 5420 debonding 4890381 152 51 3.18 38 320 53110U debunding 4850381 204 51 3.18 38 320 5190* debonding 479U
508 127 51 3.18 38 160 2910 debonding' 3110508 152 51 3.18 38 160 2780* debonding 3U70
j 508 204 51 3.18 38 160 2650* debonding 2980
a 508 127 51 3.18 38 192 3790 debonding 3910.508 152 51 3.18 38 192' 3720' debonding 3870
* 508 204 51 3.18 38 192 3670' debonding 3800
508 127 51 3.18 38 320 4860 debonding 502U508 12 51 3.18 38 320 47504 debonding 4980508 2 4 51 3.18 58 320 4670'" debonding 4930
241 5) 25 1.27 25 160 1100 'face yield 890241 7 25 1.27 25 160 1090 face yield 1105241 75 25 1.2( 25 320 1120' face yield 5450
S267 3 25 0.63 25 160 470 face yield 650267 3ý 25 0.63 25 320 490 face yield 1490
Note
Failur loads marked by an arterisk are the average'of 2 tests;otherw se, they are the result of 3 tests.
24
, it, •
o 0'
Ci % .o
0 0 0 0 o 0
calculated debonding loads is within 10% for all beam aeometries
and crack lengths. The analysis describes debonding in sandwich
beams with foam cores well.
The beams wit'h relatively small interfacial cracks yielded
before dehonding nrcurred; for these beams the pr-dicted
debonding load is grea'ter than the measured face yielding load
with only one exzception, for which the yield and debond loads are
similar. Similar calculations for a wide range of sandwich
beams indicate that debonding is usually'preceded by another
failure mode (eg. face yielding, face wrinkling or core shearing)
if the interfacial crack is small relative to the core thickness.
Triantafillou and Gibson (11] have recently analyzed the
various failure modes of aluminum skin - rigid polyurethane foam
core sandwich beams; the usual modes of failure are face
yielding, face %,rinkling and core shear. By comparing the
failure load for each of these mode-s with that for debonding it
is possible to determine whethei or not debonding is the critical
failure mode for a particular sandwich design.
2.5. Conclusions
Debonding in sandwich panels with foam cores can be
described in terms of the critical strain energy release rate of
the interface. The results of the analysis describe the measured
debonding load in sandwich beams with aluminum skins and rigid
polyurethane foam cores well. They suggest that debonding is
unlikely to occur unless the initial interfacial crack length. is
25
Vrelatively large. The debonding failure load giv'en by the
anaysi prsened erecanbecompared with the failure loads
ssuch as face yielding, face wrinkling and core
shearing t determine if debonding is the critical failure mode
for a given beam geometry and initial crack length.
26
o 2.6 References
(1) England, A.H. 11965) J. Appl. Mech. 3_2, 400-402.
12] Comninou, M. (1977a) J. Appl. Mech. 44, 631-636.
13] Comninou, M. (1977b) J. Appl. Mech. 44, 780-781.
[41 Comninou, M. (1978) J. Appl. Mech. 45, 287-290.
[5] Erdogan, F. and Arin, K. (1972) Eng. Fract. Mech. 4, 409-458.
[6] Ko, W.L. (1978) Eng. Fract. Mech. 10, 15-23.
[7] Ratwani, M.m. (1978) AAIA J. 17, 988-994.
[8] Hong, C.S. and Ro, H.S. (1981) Int. J. Fracture 17, 181-184.
19] Hong, C.S. and Jeong, K.Y. (1985) Eng. Fract. Mech. 21, 285-292.
[10] Allen, H.G. (19-9) Analysis and Design of StructuralSandwich Panels Pergamon Press, Oxford.
[111] Triantafillou., T.C. and Gibson, L.J. (1987) Mat. Sci. andEng., 95, 37-53.
27
:: 0 o~~ 0 C0
:¢0 00 0
3!. "nimum Weight Design of a Sandwich Panel for a Given
Strength
3.1, Introduction
, The goal of this part of the pro.ect is to find the minimum
weight design of a foam core sandwich beam fora given strernth.
The optimum value of three design variables are to be found in
the analysis: the face thickness, t, the core thickness, c, and
the core density, 0• , The use of previously developed models
for the behaviour of the foam core which relate the properties of
a foam to its relative density [1-31 allows the core density to
be included as a design variable for the first time. The
analysis presented in this section of the report is for a
sandwich beam with aluminum faces and a rigid polyurethane foam
core loaded in three-point bending. It is easily adapted to
other face and core materials andother loading conditions using
the method outlined below.
The possible failure modes which will be considered are face
y•ielding, face w.rinkling and core shea'ring. The results of the
first part of this study indicate that debonding is only possible
if very large cracks (larger than the core thickness) preexist in
the interfaces between the 'faces and the core; we assume here
that no such large cracks are present in the interfaces.
28
-1, q, O0 0o '61o .I-
0 0 o0 0 .o* c;0 ~ I. *0o
o0 - ,0 " 0 o 0 0 0 00 0
3.2 Analysis
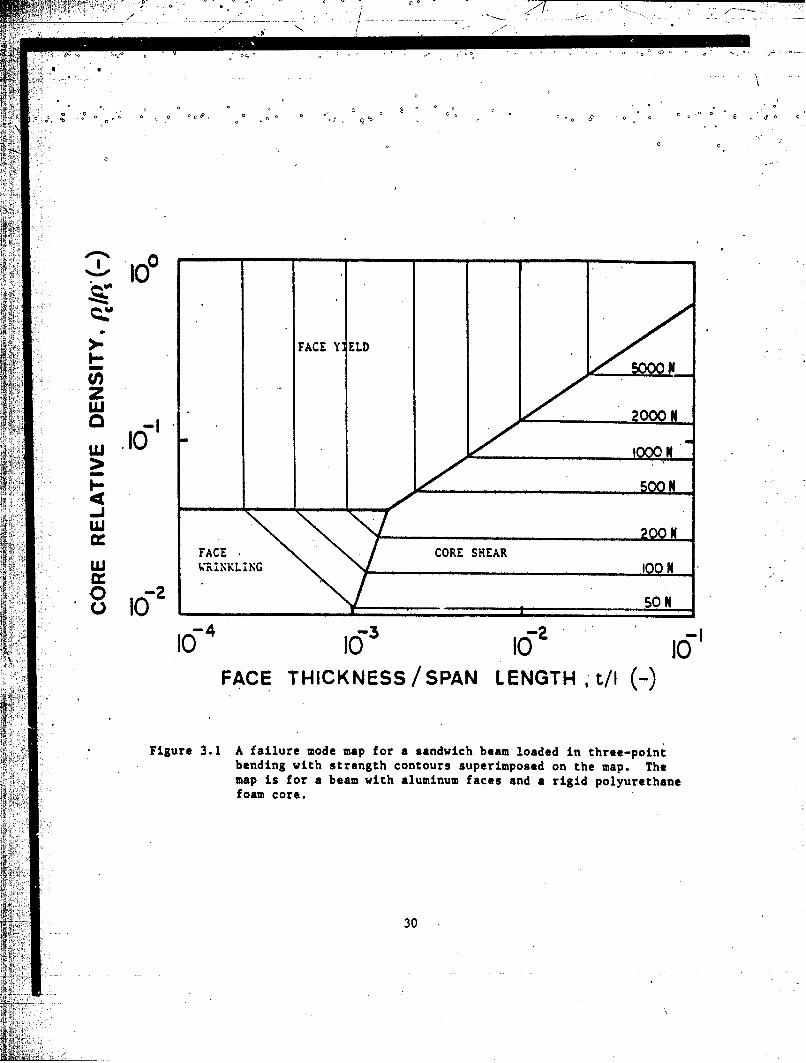
Strength contours may be superimposed on failure mode maps
by using the failure equations listed in Table 1.1 (Fig. 3.1) 14].
They indicate that the minimum weight design for a sandwich panel
occurs at the transition between one failure mode and an-ther.
For example, within the regime of face yielding, the core density
can be reduced tothat corresponding to the transition between
face yielding and face wrinkling with no change in strength.
Similarly, within the regime of core shear, the face thickness
can be reduced to that corresponding to simultaneous core
shearing and face yielding with no loss of strength. For each
transition between two failure modes, a minimum weight design can
be found by using the equation for the weight of the sandwich as
the objective function to be minimized and by using the two
failure equations for the modes under consideration as the
constraint equations. Two of the design variables (the face and
core thicknesses and the core density) are solved for in terms
of the constraint equations and substituted into the weight
equation. Setting the derivative of the weight equation equal to
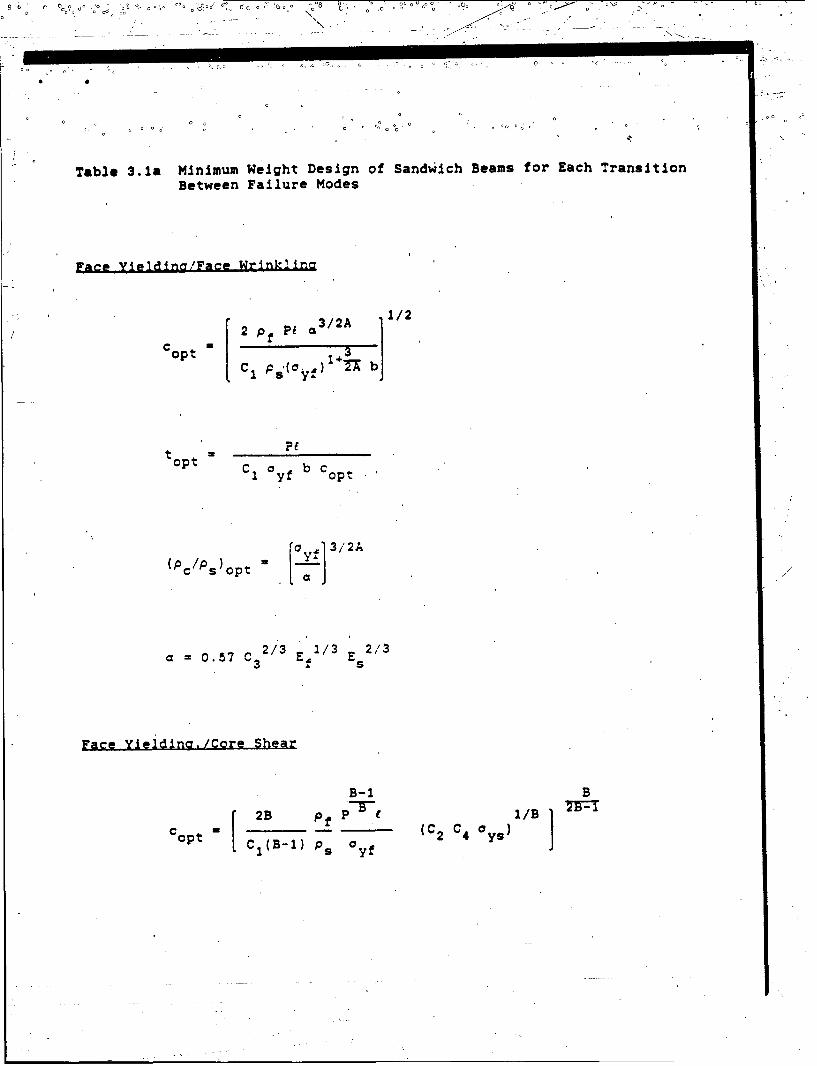
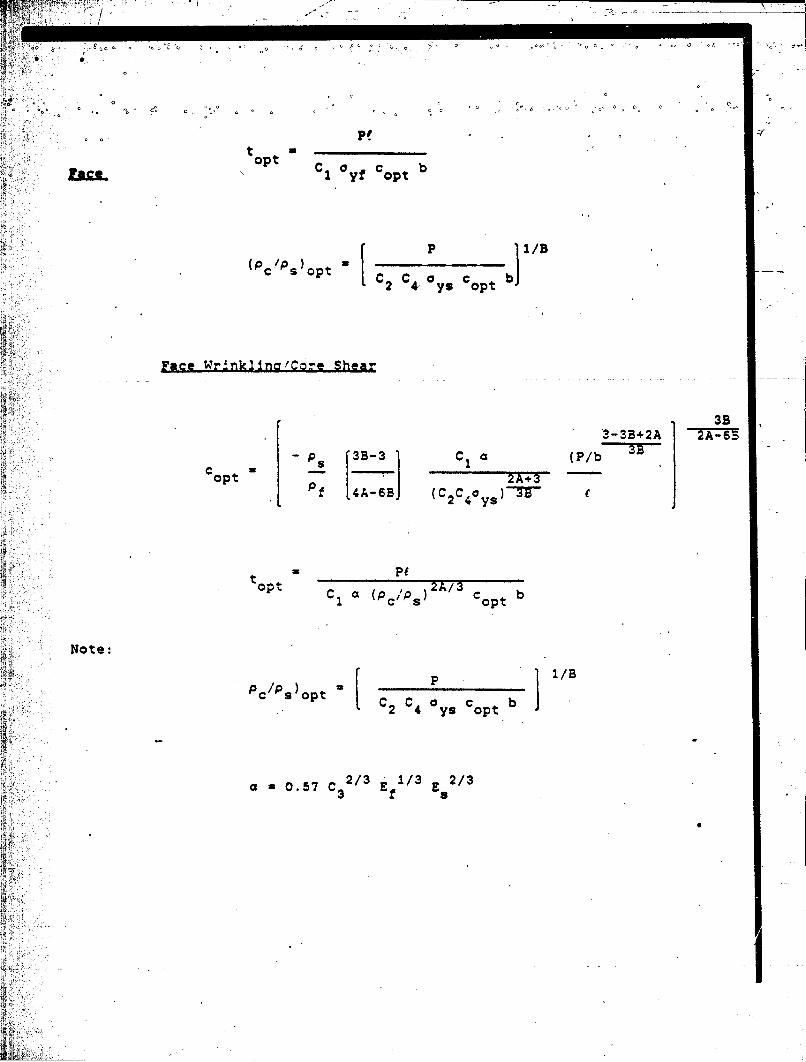
zero then gives the minimum weight design. The results of the
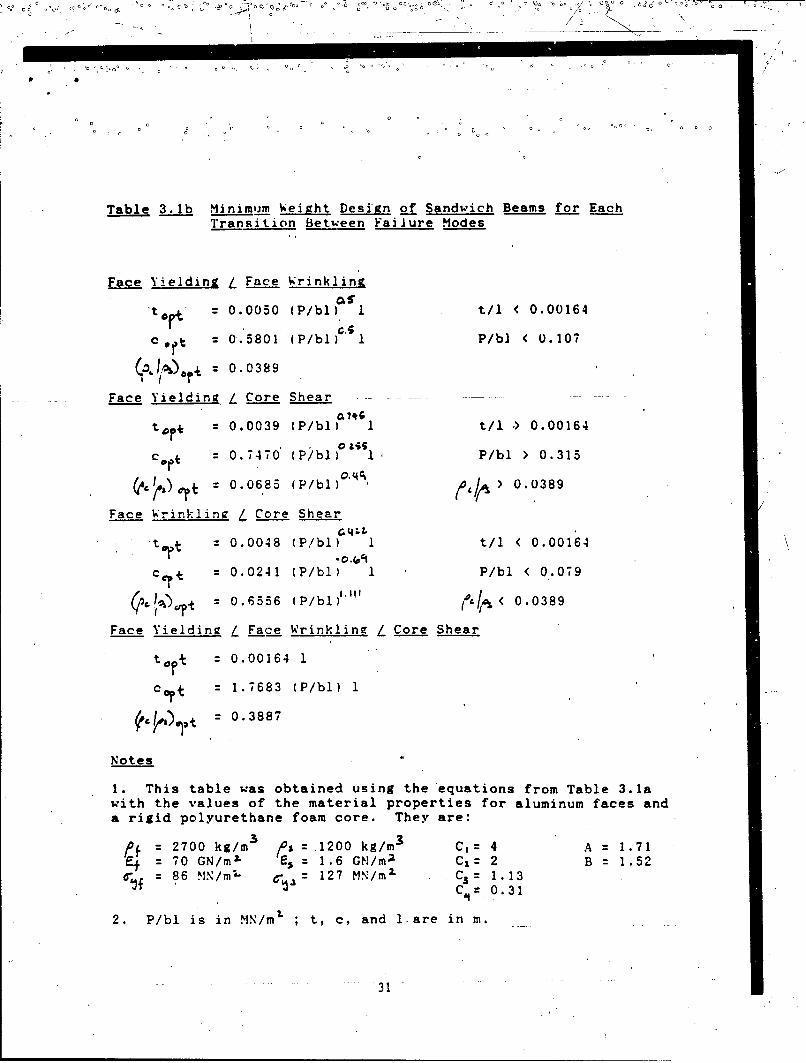
analysis for each of the transitions between failure modes are
given in Table 3.1a for the general case and in Table 3.1b for a
sandwich beam with aluminum faces and a polyurethane foam core
loaded in-three point bending.
It remains to identify which transition between failure
modes corresponds to the overall minimum weight design for a
29
44 .. , ' .... .S- - -
r '> - / ..... .. "
S0 C 0 o 0 o .0o
C C 4 C .o 0 o 8 .<
'Pr,
1 o
FACE Y ELD
4M
zUi=
So N
FACE CORE SHEARi U"RI•NKLIN 10 N
0
WI0 _ _ _ _ _ _ I_
FACE THICKNESS/SPAN LENGTH Ct/E
SFigure 3.1 A failure mode map for a sandwich beam loaded in three-pointbending with strength contours superimposed on the map. The
~map is for a beam with aluminum faces and a rigid polyurethaneS~foam core.•
~30
o 1
S~C b
0 o 0 b c
•, ~~~ o • opt o :
ay,
Table 3.la Minimum Weight Design of Sandwich Beams for Each Transition
Between Failure Modes
Pace Yieldirna/Face Wrinkltng
copt * F C+p b
(PIP slyf)
(PC /Pslopt 13/2A
0. 7 C 2/'3 "' 1/3 E 2/'33= 0.57 E 2s
Face Yleidina./Core Shear
B-I B
o2B PfP-t 1/B PC
c opt- s yf (C 2 C4 ]ys)C I ( -1) ps a 7
opt
C - 0 C b
Face topt I o•;:.•- • 1 yt Coptb
S(PC /P S)opt c 2 C4- ays Copt b
Face Wr~nkflin!Core Shear
!;i:,:3B
3B-3,C , a (+/ -.-,-= P A
opt C1 a (pps)2A/3 o b
opt 2 opt
Note:
K PP) [p 1/Bc s opt c. c 0 C b
"2 4 ys opt
C32 1/3 E2/3
a = 0.57 C 2/3 E E3 f 8
I ....
00o~ O ~ ~ ~ ~ 00 � o o .0
o 0/0 - -o
0 C 0
0 o o
Table 3.1b Minimum Weight Design of Sandwich Beams for EachTransition Between Failure Modes
Face Yielding L Face Wrinklint
t 0.0050 (P/bl) I t/1 < 0.00164
c 0.5801 (P/bl)• 1 P/bl < 0.107
, 1. l,%) =0.0389
Face Yielding L Core Shear .
tO* = 0.0039 (P/bl) 1 t/I .> 0.00164
o &~scort = 0.7470 (P/blo I, P/bl ) 0.315
t=0.06.85 (P/bl) > 0.0389
Face Wrinkling 4 Core Shear
t : 0.0048 (P/bl) I t/l < 0.00164
c C. : 0.0241 (P/bl) 1 P/bl < 0.079
1:)t=0.6556 (P/bli ) 0.0 38 9
Face Yielding / Face Wrinkling L Core Shear
0.00164 1
cart = 1.7683 (P/bl) 1
S0.3887
Notes
1. This table was obtained using the equations from Table 3.1awith the values of the material properties for aluminum faces anda rigid polyurethane foam core. They are:
2700 kg/m 10s .1200 kg/mr C,: 4 A = 1.7170 GN/mI E 1.6 GN/m2 C1 : 2 B = 1.5286 MN/m2" A = 127 MN/m2" C3= 1.13
C = 0.31
2. P/bl is in .N/m' ; t, c, and 1 are in m.
31
-. /
c Co_.
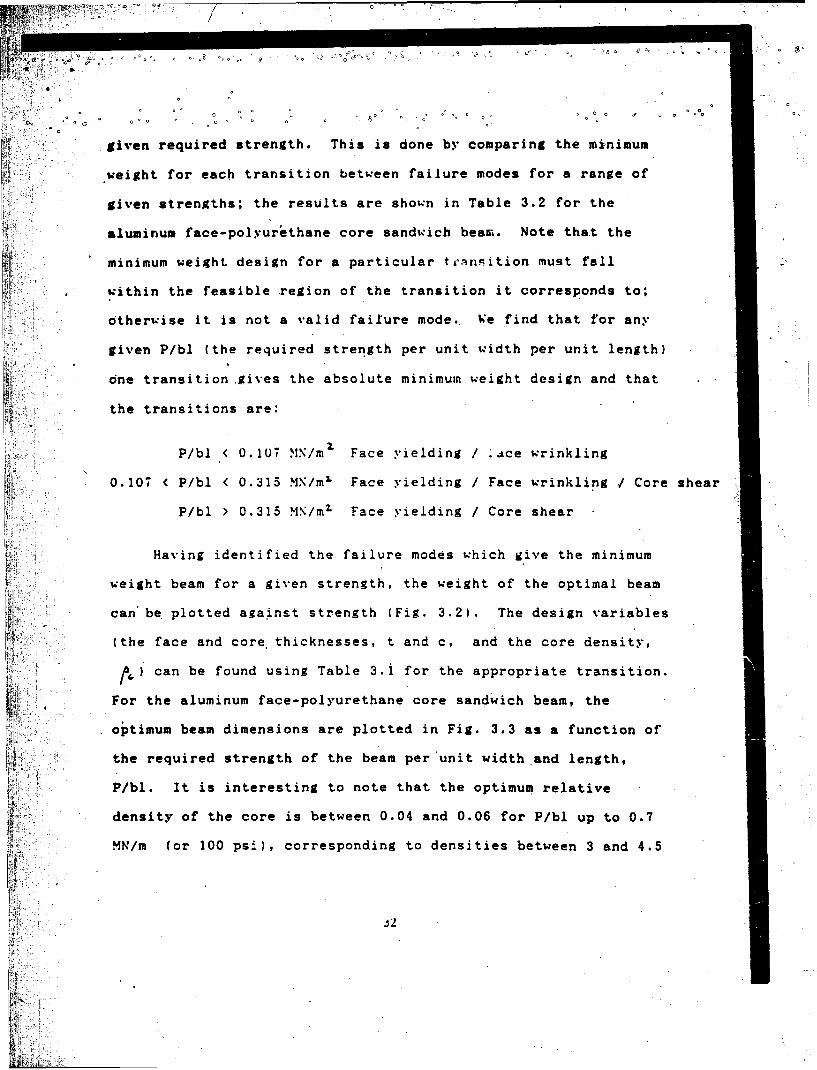
given required strength. This is done by comparing the minimum
weight for each transition between failure modes for a range of
given strengths; the results are shown in Table 3.2 for the
aluminum face-polyurethane core sandwich bear.. Note that the
minimum weight design for a particular t,,nsition must fall
within the feasible region of the transition it corresponds to;
otherwise it is not a valid failure mode. We find that for any
given P/bl (the required strength per unit width per unit length)
one transition gives the absolute minimum weight design and that
the transitions are:
P/bl ( 0.107 MN/m 1 Face yielding / Ace wrinkling
0.107 < P/bl < 0.315 MN/ml Face yielding / Face wrinkling , Core shear
SP/bl > 0.315 MN/mz Face yielding / Core shear
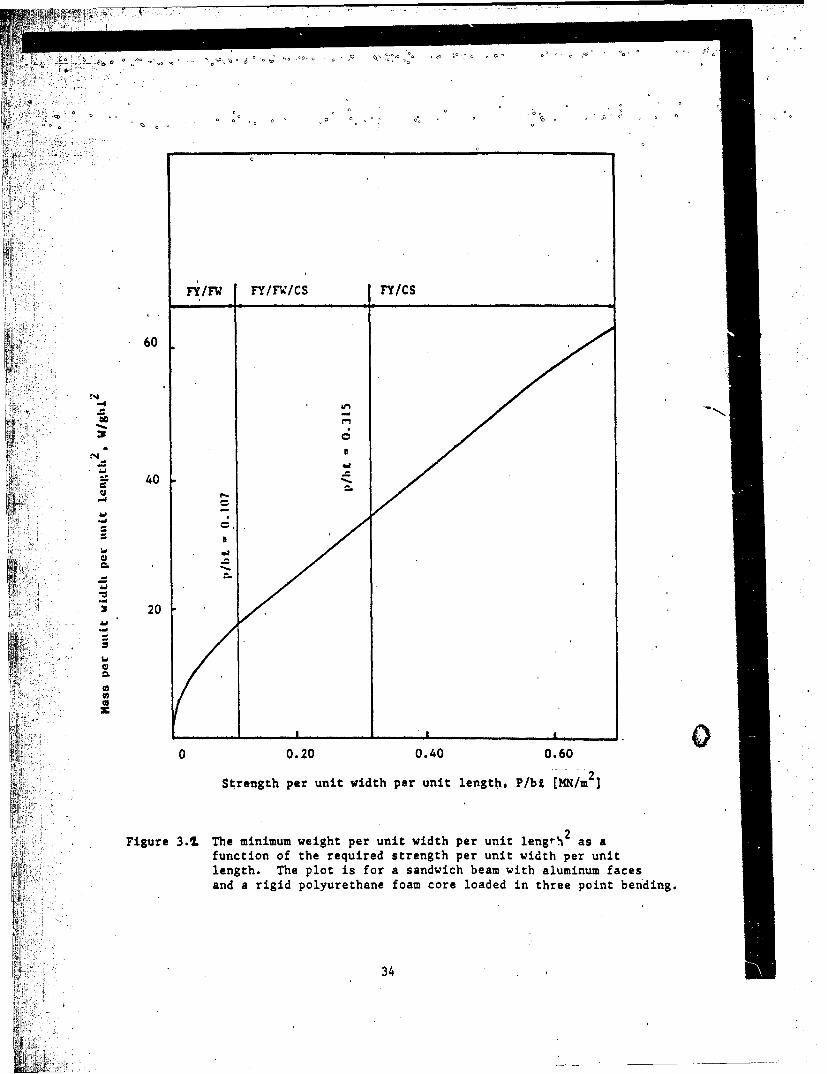
Having identified the failure modes which give the minimum
weight beam for a given strength, the weight of the optimal beam
can be plotted against strength (Fig. 3.2). The design variables
(the face and core thicknesses, t and c, and the core density,
f4) can be found using Table 3.1 for the appropriate transition.
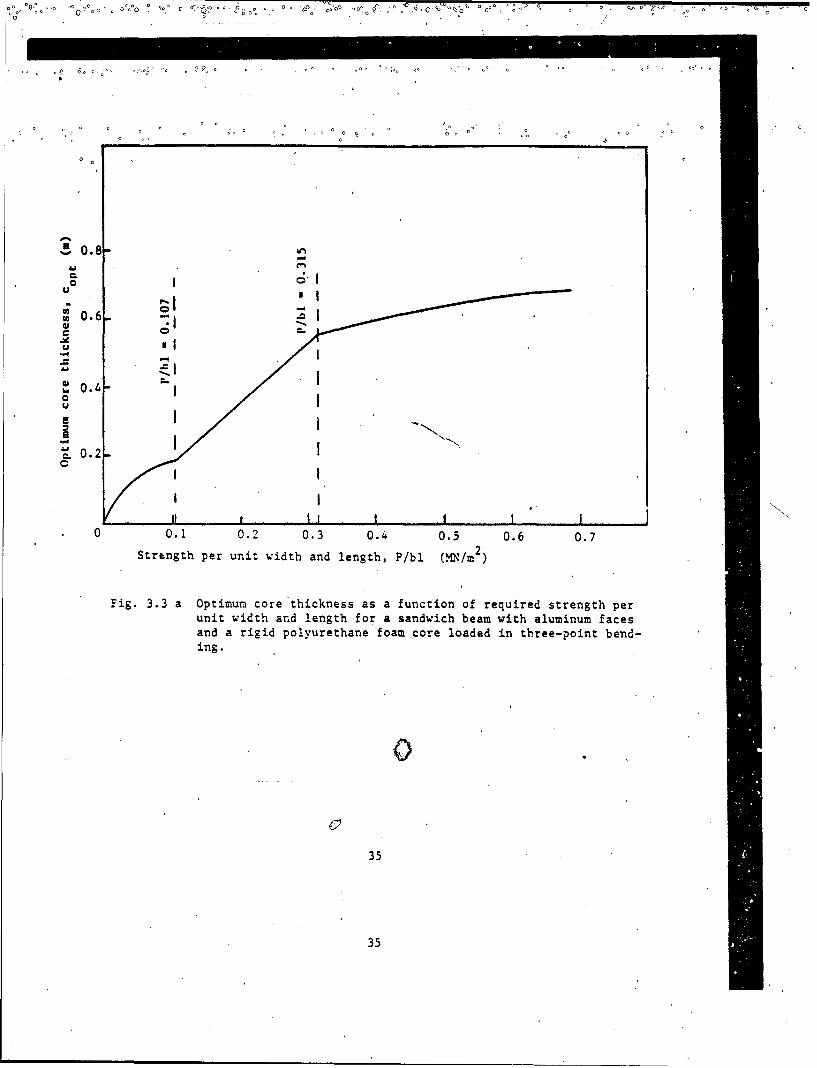
For the aluminum face-polyurethane core sandwich beam, the
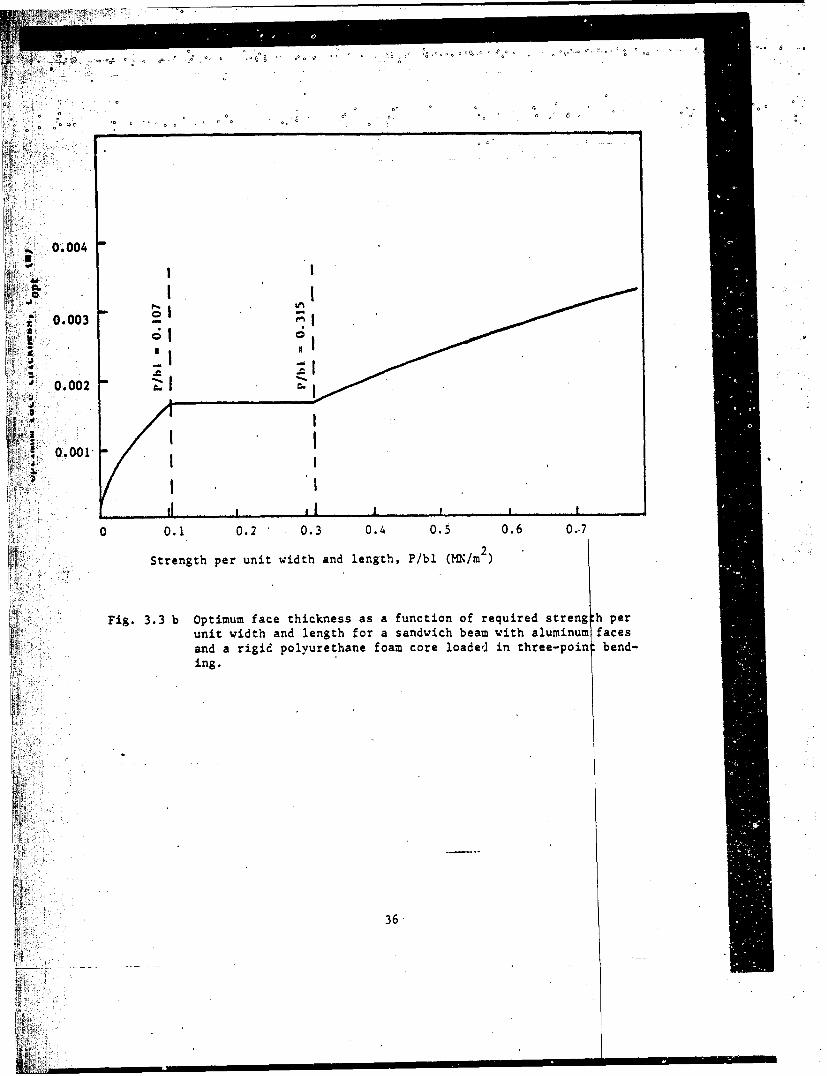
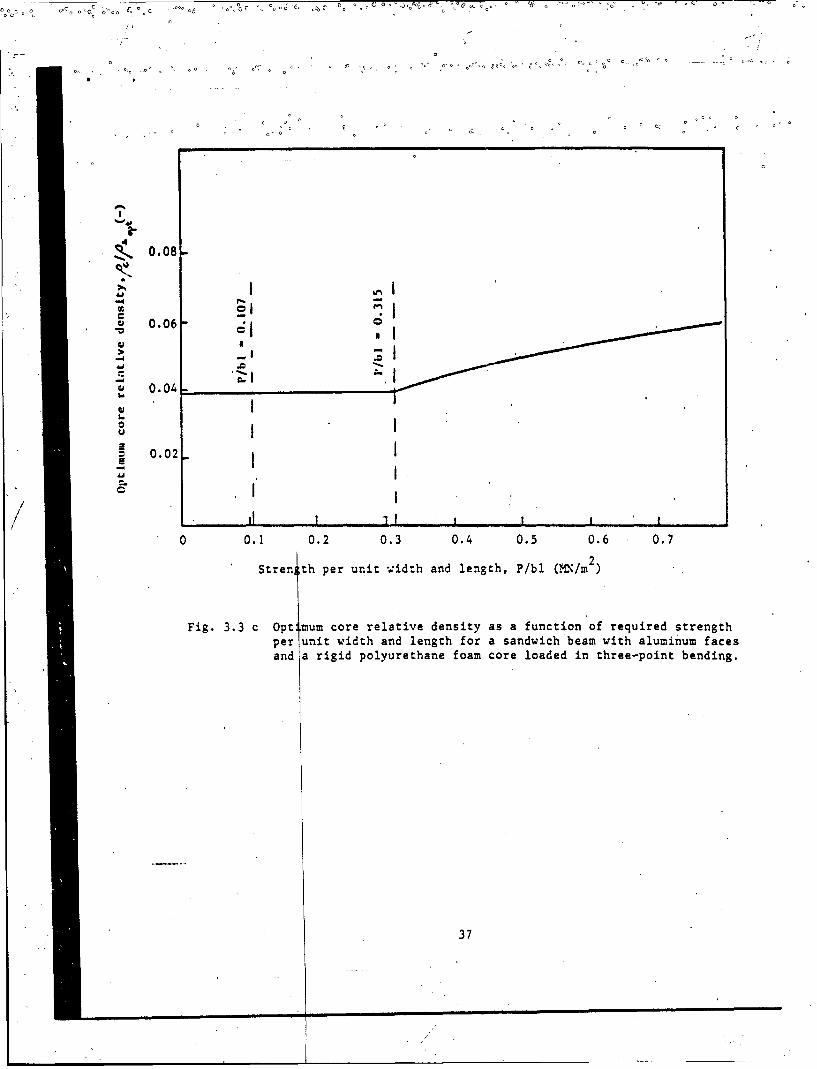
optimum beam dimensions are plotted in Fig. 3.3 as a function of
the required strength of the beam per 'unit width and length,
P/bl. It is interesting to note that the optimum relative
density of the core is between 0.04 and 0.06 for P/bl up to 0.7
MN/m (or 100 psi), corresponding to densities between 3 and 4.5
K• )
fL ia , .
Ooo • • • °• • 9 oo o0 o 0 o 00
o7Z
00 oc0o "- - C
%
., 0 0 0 0 ° 0- 0 ° o• °° ooo
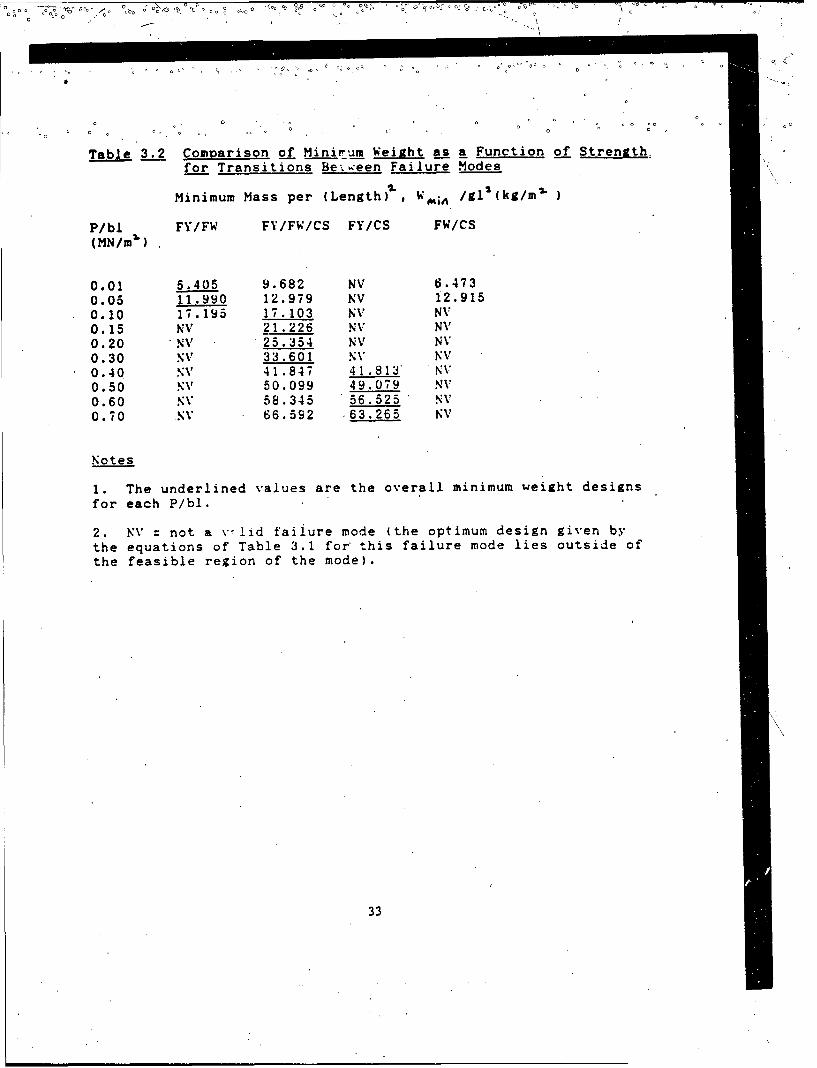
Table 3.2 Comparison of Minirum Weight as a Function of Strength,for Transitions Be,,een Failure Modes
Minimum Mass per (Length) '=, Wmi Igli (kg/mlt
P/bl FY/FW FY/FW/CS FY/CS FW/CS(MN/min
0.01 5.405 9.682 NV 6.4730.05 11.990 12.979 NV 12.9150.10 17.195 17.103 NV NV0.15 NV 21.226 NV NV0.20 NV 25.354 NV NV0.30 NV 33.601 NV NV0.40 NV 41.847 41.813' NV0.50 NV 50.099 49.079 NV
0.60 NV 58.345 56.525 NV0.70 NV 66.592 63.265 NV
Notes
1. The underlined values are the overall minimum weight designsfor each P/bl.
2. NV = not a v-lid failure mode (the optimum design given bythe equations of Table 3.1 for this failure mode lies outside ofthe feasible region of the mode).
33
.l/I FY/FW/CS FYl/CS
60
N$ 40 <,4
I..•
20
0 0.20 0.40 0.600
Strength per unit width per unit length, P/bI [MN/m 2 ]
Figure 3.A The minimum weight per unit width per unit length2 as afunction of the required strength per unit width per unitlength. The plot is for a sandwich beam with aluminum facesand a rigid polyurethane foam core loaded in three point bending.
... 34
w 0.006-0
U!
0.4-
E<
o 0
o II
0.2- I -
00.1 0.2 0.3 0.4 0.5 0.6 0.7Strtngth per unit width and length, P/bl (M.U/m2 )
Fig. 3.3 a Optimum core thickness as a function of required strength perunit width and length for a sandwich beam with aluminum facesand a rigid polyurethane foam core loaded in three-point bend-ing.
0
35
35
. ° 8 •c
S-.
0.004IdI I
r ; 0.003 -4 m
4 0.002a
I
4 .001.
AA
0 0.1 0.2 0.3 0.4 0.5 0.6 0.-7
2Strength per unit width and length, P/bl (L/m
Fig. 3.3 b Optimum face thickness as a function of required streng h perunit width and length for a sandwich beam with aluminum facesand a rigid polyurethane foam core loaded in three-poin bend-ing.
10 36-
C) 0
o c o e 0 0 30 &> Coo o O0•0 Q ~ <
0 oc o 0 o o oo 0 - ~
0.08-
" I t,j
S0.06 =
0.04
0.0
'.U I I
o .° I
//.ii ii
0 0.1 0.2 0.3 0.4 0.5 0.6 0.7
Stren th per unit wid:h and length, P/bl (%/m 2 )
Fig. 3.3 c Opt mum core relative density as a function of required strengthper unit width and length for a sandwich beam with aluminum facesand a rigid polyurethane foam core loaded in three-point bending.
37
pounds per cubic foot. The thermal conductivity of foams is
Lowest at these densities, so that the minimum weight design also
optimizes the thermal 'performance of the panel.
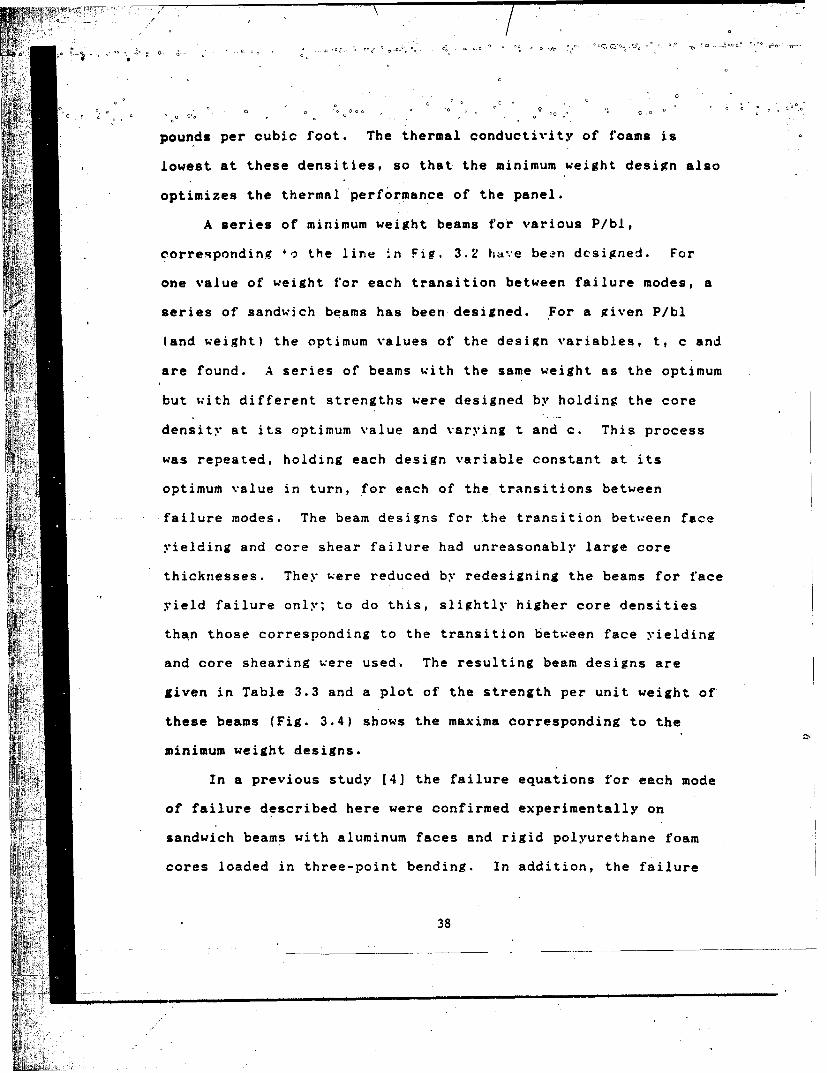
A series of minimum weight beams for various P/bk,
A/
corre.ponding *o the line 'n Fig. 3.2 hoa.e been designed. For
one value of weight for each transition between failure modes, a
series of sandwich beams has been designed. Tor a given P/bl
land weight) the optimum values of the design variables, t, c and
are found. A series of beams with the same weight as the optimum
but with different strengths were designed by holding the core
density at its optimum value and varying t and c. This process
was repeated, holding each design variable constant at its
optimum value in turn, for each of the transitions between
*failure modes. The beam designs for the transition between face
yielding and core shear failure had unreasonably large core
thicknesses. They were reduced by redesigning the beams for face
yield failure only; to do this, slightly higher core densities
than tho-se corresponding to the transition between face yielding
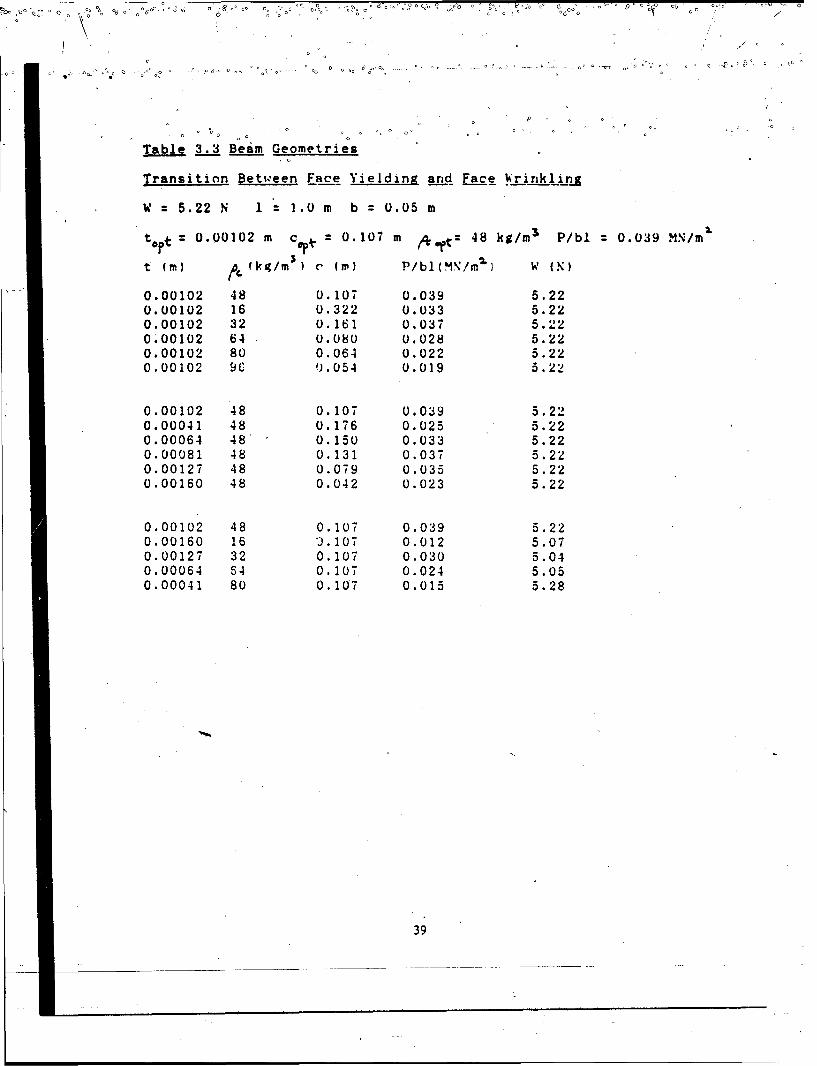
and core shearing were used. The resulting beam designs are
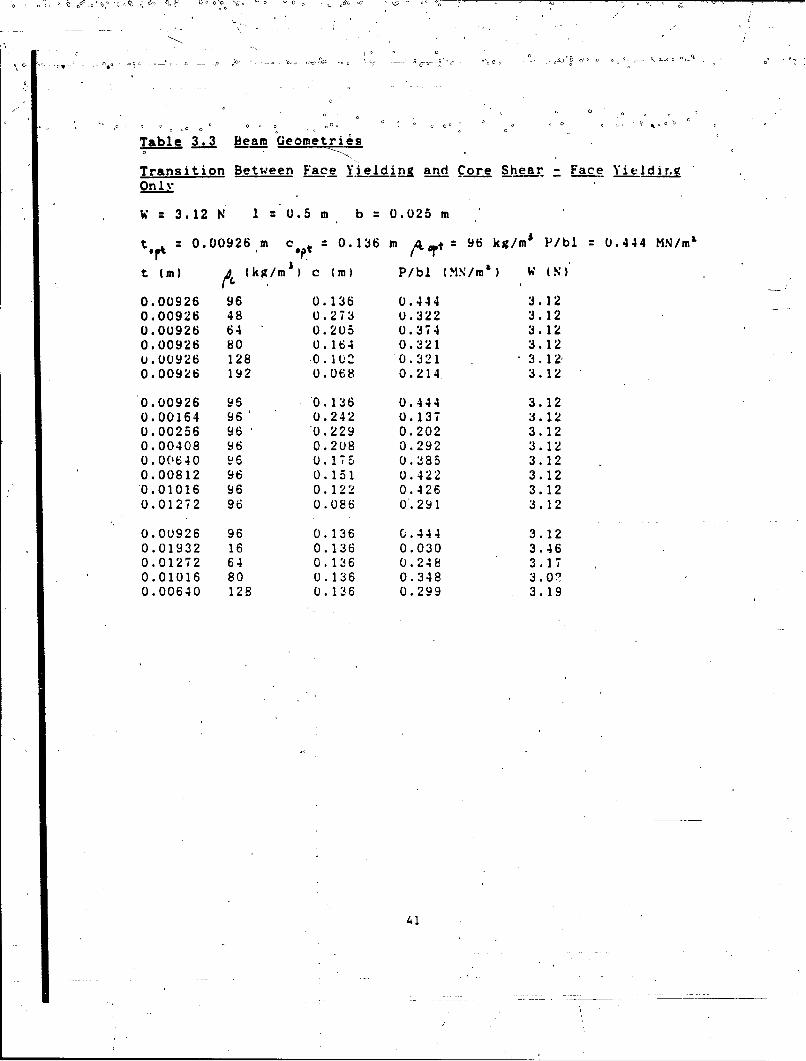
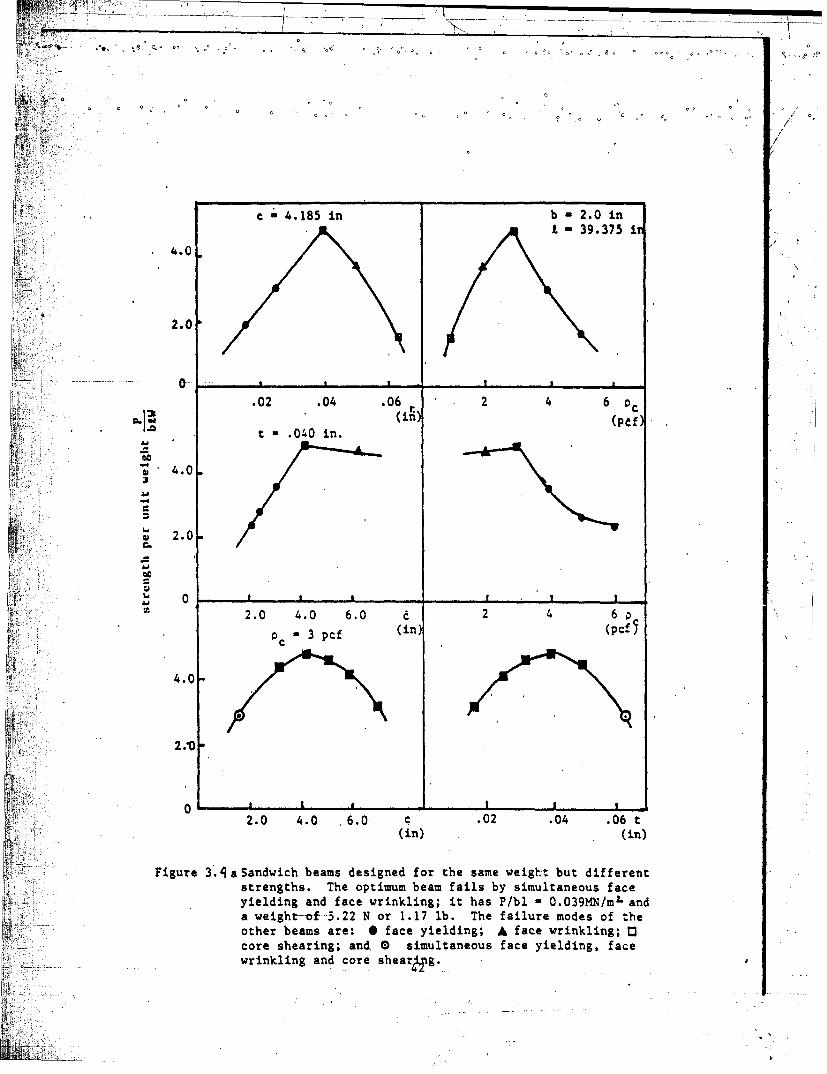
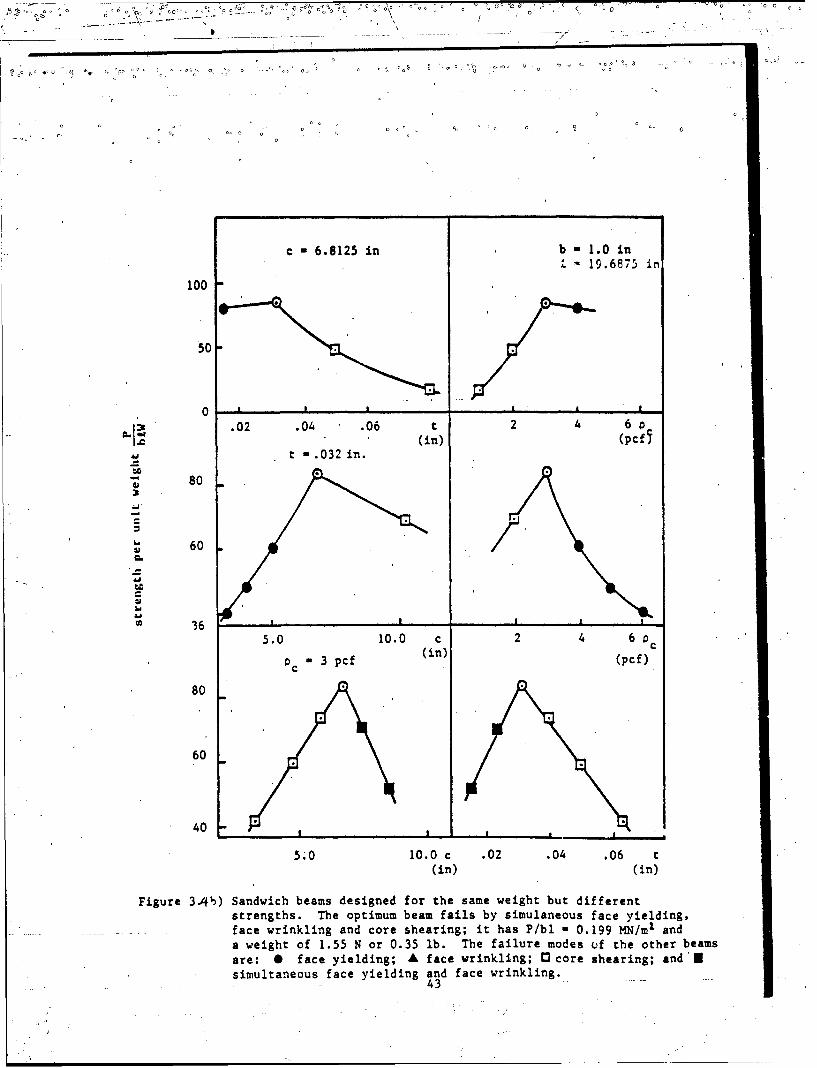
* given in Table 3.3 and a plot of the strength per unit weight of
these beams (Fig. 3.4) shows the maxima corresponding to the
minimum weight designs.
In a previous study (4] the failure equations for each mode
of failure described here were confirmed experimentally on
sandwich beams with aluminum faces and rigid polyurethane foam
cores loaded in three-point bending. In addition, the failure
38
~¢
-, o c6 o
0 C o C. , 0 o
Table 3.3 Beam Geometries
Transition Between Face Yielding and Face Wrinkling
W :5.22 N 1: 1.0 m b 0.05 m
tort = 0.00102 m c,, = 0.107 m /qt = 48 kg/m 3 P/bl 0.039 MN/mr
t (m) fkg/m 3 ) c (m) P/bl(9N!mN4 W IN)
0.00102 48 0.107 0.039 5.220.00102 16 0.322 0.033 5.220.00102 32 0.161 0.037 5.220.00102 64 0.080 0.028 5.220.00102 80 0.064 0.022 5.220.00102 9c 0.054 0.019 5.22
0.00102 48 0.107 0.039 5.220.00041 48 0.176 0.025 5.220.00064 48' 0.150 0.033 5.220.00081 48 0.131 0.037 5.220.00127 48 0.079 0.035 5.220.00160 48 0.042 0.023 5.22
0.00102 48 0.107 0.039 5.220.00160 16 ).107 0.012 5.070.00127 32 0.107 0.030 5.040.00064 54 0.107 0.024 5.050.00041 80 0.107 0.015 5.28
39
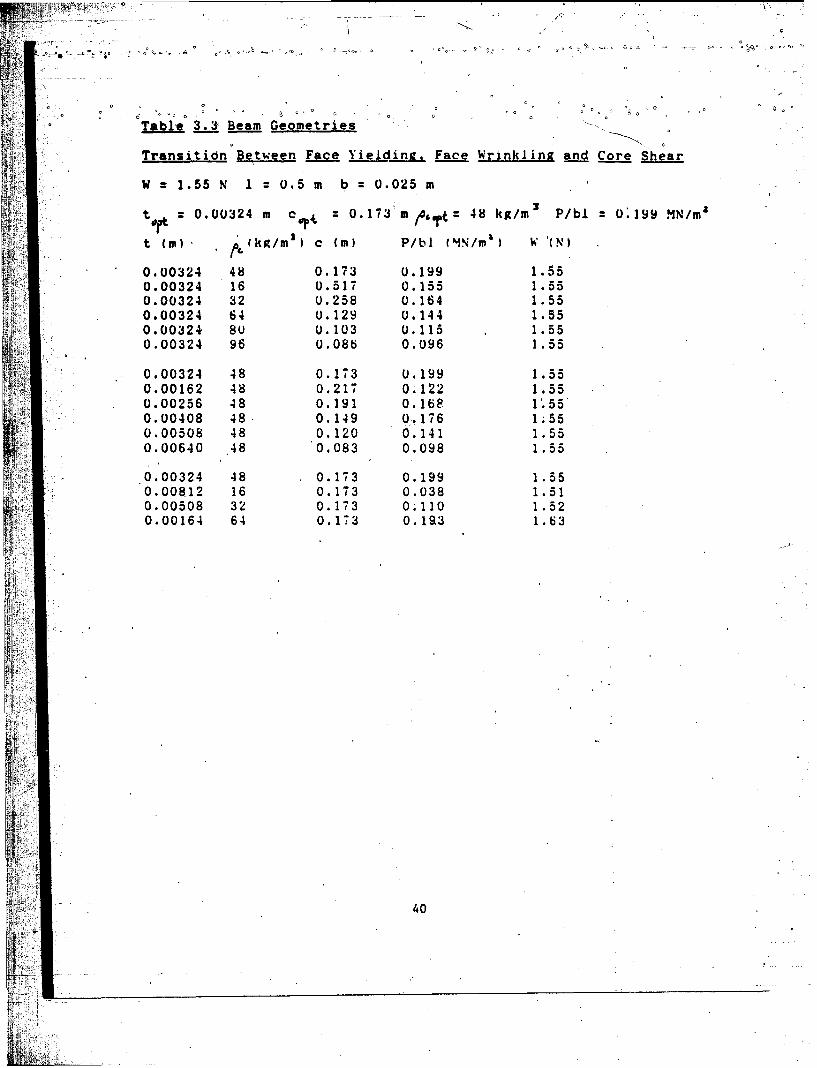
Table 3.3 Beam Geometries
Transitidn Between Face Yielding, Face Wrinkling and Core Shear
W = 1.55 N 1 0.5 m b 0.025 m
Soft; = 0.00324 m ct= 0.173 m/o,rt= 48 kg/mr P/bl 0.199 MN/mr
t (m). , kg/ml) c (m) P/bl (hN/m') w '(N)
0.00324 48 0.173 0.199 1.550.00324 16 0.517 0.155 1.550.00324 32 0.258 0.164 1.550.00324 64 0.129 0.144 1.550..00324 80 0.103 0.115 1.550.00324 96 0.086 0.096 1.55
0.00324 48 0.173 0.199 1.550.00162 48 0.217 0.122 1.550.00256 48 0.191 0.168 1.55'0.00408 48 0.149 0.176 1;55
40.00508 48 0.120 0.141 1.550.00640 .48 0.083 0.098 1.55
S0.00324 48 0.173 0.199 1.550.008.12 16 0.173 0.038 1.510.00.508 32 0.173 0.110 1.520.00164 64 0.173 0.193 1.63
40
S i .. ..
0 0 -P 0' 0
Table 3.3 Beam Geometries
Transition Between Face Yieldin. and Core Shear - Face Yieldir.g
Only~
W = 3.12 N 1 0.5 m b = 0.025 m
t 0.00926 m c* 0.136 m 96 kg/mr P/bl 0.444 MN/mi
t (m} •4 (kg/m') c (m) P/bl (MN/rn) W (N)
0.00926 96 0.136 0.444 3.120.00926 48 0.273 0.322 3.120.00926 64 0.205 0.374 3.120.00926 80 0.164 0.321 3.120.00926 128 0.102 0.321 3.12,0.00926 192 0.068 0.214 3.12
0.00926 96 0.136 0.444 3.120.00164 96' 0.242 0.137 3.120.00256 96 0.229 0.202 3.120.00408 96 0.208 0.292 3.120.00640 ?6 0.175 0.385 3.120.00812 96 0.151 0.422 3.120.01016 96 0.122 0.426 3.120.01272 96 0.086 0.291 3.12
0.00926 96 0.136 0.444 3.120.01932 16 0.136 0.030 3.460.01272 64 0.136 0.248 3.170.01016 80 0.136 0.348 3.0?0.00640 128 0.136 0.299 3.19
41
c .15i - 2. 0 in
.L a 3937 iVF 0
- oo
4.0
2.0
-- 0-
.02 .04 .06 ~ 2 4 6C; s.) (pef)
t .040 in.
~'4.0.
S 2.0.
Lj 0
2.0 4.0 6.0 a2 4 6
PC 3pcf in)(pcf 5
4.0-
2 .*0
£+ 0 t .
2.0 4.0 .6.0 .02 .04 .06 t(in) (in)
Ci' ¢ c
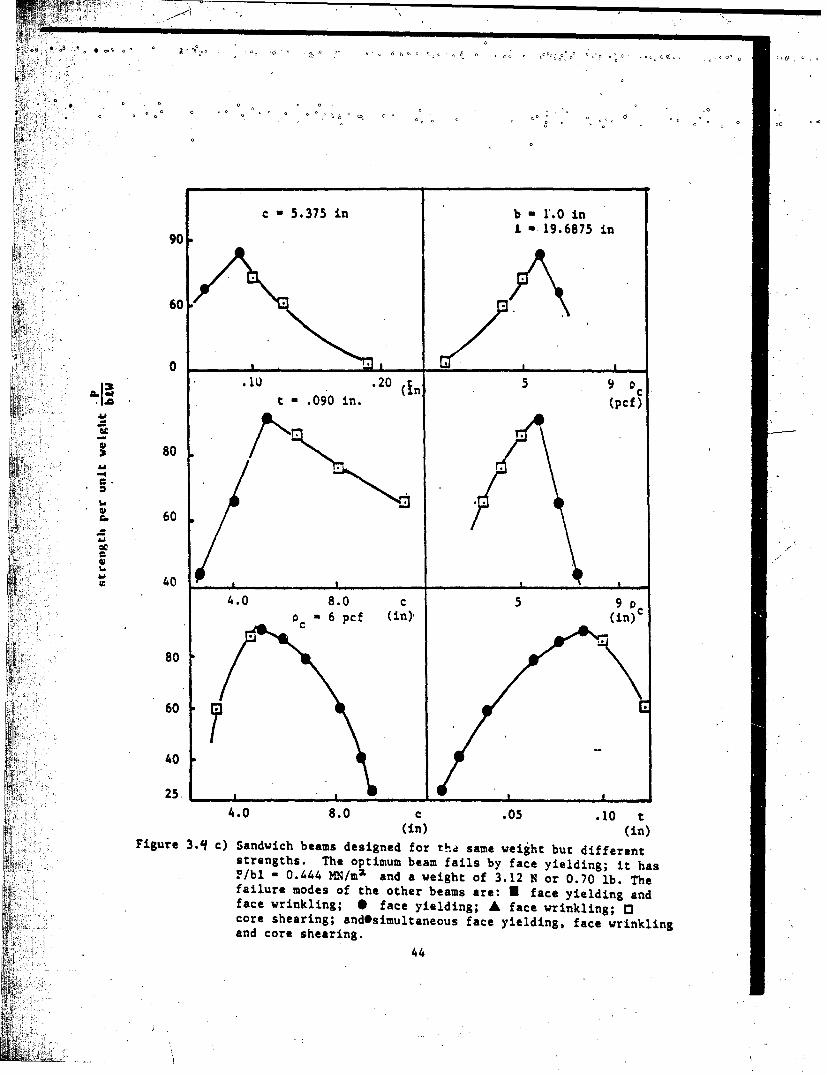
Figure 3.qaSandwich beamis designed for the same weigh:t but differentstrengths. The optimum beam fails by simultaneous faceyielding and face wrinkling; it has P/bl - 0.039MN/ml-anda weight--of---3.22 N or 1.17 lb. The failure modes of theother beams are: s face yielding; A face wrinkling; bEcore shearing; and. 0 simubltaneous face yielding, facewrinkling and core shear4g. .
Ft ',
- 1967 in
50-o
0 .
t - 6.8125 in b . 1.0 in.,19.6875 in
"180
60
..0 40.0 c 2 4 6 0cPC = 3 pcf (in) (pcf)
80
60
40
5.1 0 0.0 c .02 .04 .06 t(in) (in)
SFigure 3.4b) Sandwich beams designed for the same weight but different
strengths. The optimum beam fails by simulaneous face yielding,Sface wrinkling and core shearing; it has P/bl ( 0.199 MN)I and
a weight of 1.55 N or 0.35 lb. The failure modes of the other beamsare: 0 face yielding; A face wrinkling; U core shearing; and Usimultaneous face yielding and face wrinkling.
43
0- L ,
60
t< .0 ' in . . •o o .
X 80
liar 60
0 0I 0 0 0 0 0o
60
60
4.0 8.0 c 5 90 tt- 0 i (in). (in)
strnghs Th opiu emfalIyfc.iedn;i a
fiu 80
444
K , 5, ,6. ..0
':•r 4 O8 "O " 5 0
'/1,,04U 4.0n wigtof31 8.0 c0.7 Pc.Th
-i••adcr she cf (in)n(i.
o oo~ 000 <0c
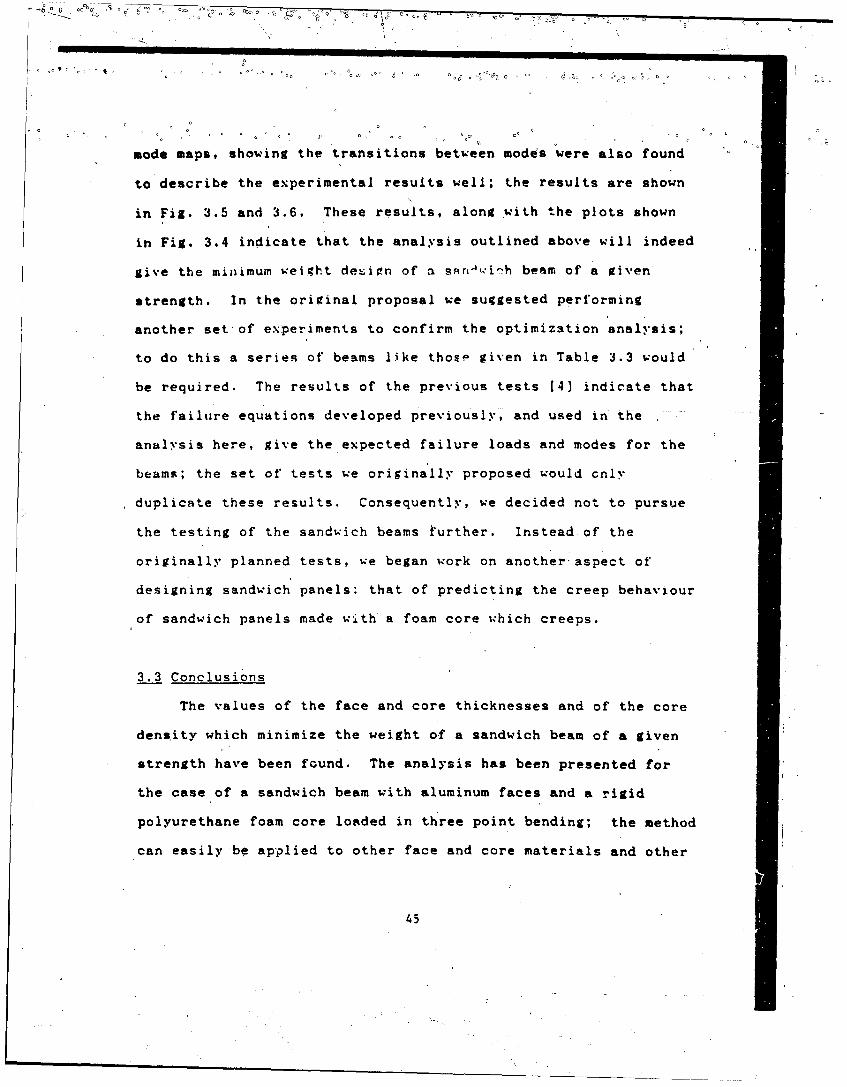
mode maps, showing the transitions between modes were also found
to describe the experimental results well; the results are shown
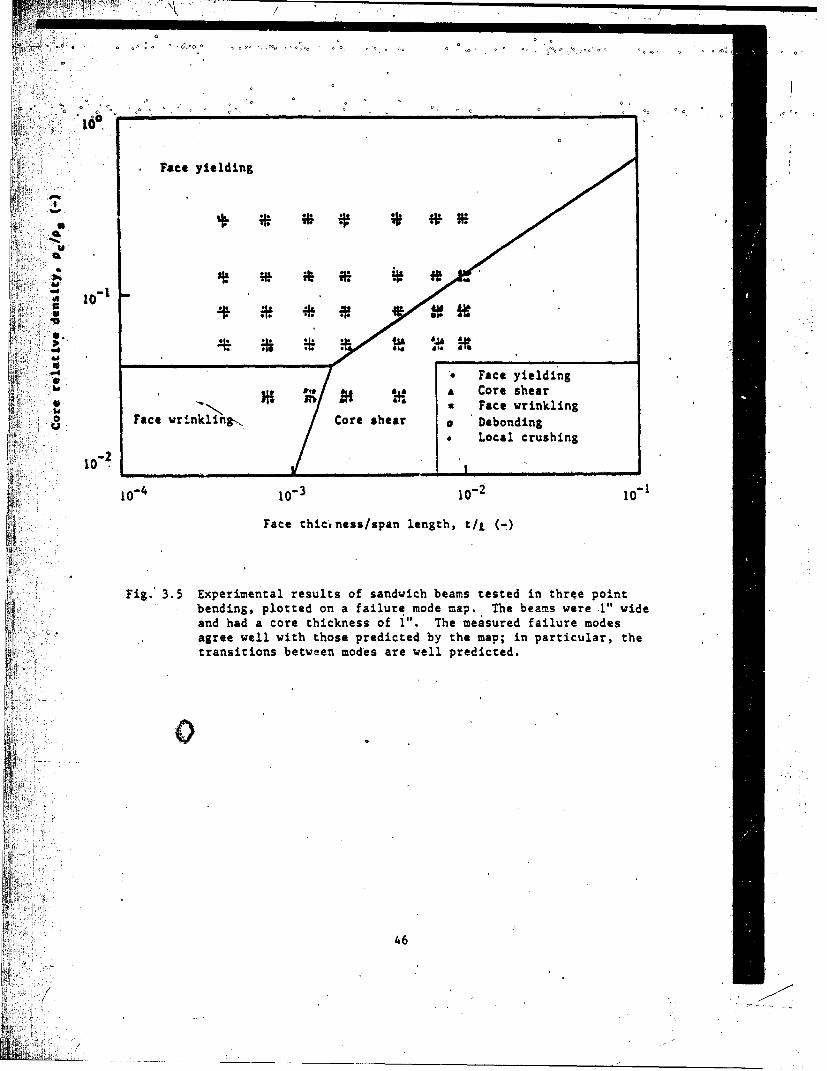
in Fig. 3.5 and 3.6. These results, along with the plots shown
in Fig. 3.4 indicate that the analysis outlined above will indeed
give the minimum weight deLign of a snri4,,i!h beam of a given
strength. In the original proposal we suggested performing
another set of experiments to confirm the optimization analysis;
to do this a series of beams like thosi given in Table 3.3 would
be required. The results of the previous tests [4) indicate that
the failure equations developed previously, and used in the
analysis here, give the expected failure loads and modes for the
beams; the set of tests we origina'lly proposed would only
duplicate these results. Consequently, we decided not to pursue
the testing of the sandwich beams further. Instead of the
originally planned tests, we began work on another-aspect of
designing sandwich panels: that of predicting the creep behaviour
of sandwich panels made w.th a foam core which creeps.
3.3 Conclusions
The values of the face and core thicknesses and of the core
density which minimize the weight of a sandwich beam of a given
strength have been found. The analysis has been presented for
the case of a sandwich beam with aluminum faces and a rigid
polyurethane foam core loaded in three point bending; the method
can easily be applied to other face and core materials and other
45
o<•O oo 0o ~oO oo 0|
100
V TV*0 ... .o0o0o
Face yielding
I(V
* * ; •i* * Fc led
S... :Core shear
Face wrinkling,, Core shear a Debonding- Local crushing
0-2..
10-4 10-3 10"i 10" 1
Face thicl.ness/span length, t/j (.)
Fig. 3.5 Experimental results of sandwich beams tested in thrqe pointbending, plotted on a failure mode map. The beams were .1" wideand had a core thickness of 1'. The measured failure modesagree well with those predicted by the map; in particular, the
S.. transitions between modes are well predicted.
0
u46
*o00 ~0 CO6
0- 0 oo o •
1 .0
0 0 00 00 00~06 000 o o 0 o 6 1 00 C~ ~
Faceyielding,,39.3 64.5 121.2 245.2 429.0 P-1600 lb
C07 4 U O0 Pa800 ib- s
40, 64.5li2 2[6.7 316.7S. . •,P-400 lbs
1 40.0 70.0 " 263.S0•5 P=200 0bs
I00.
,u' 36.3 64.5 10. 20.2 136.7 -0 b
100~P10 - l.- -
20.2 P-50 lbs
VO 33.S40.5 47.2
o
0 -Core shear P2 b
10- 2 Face wrin2ing217.
104 7 10 9. 1082 2 30.
Face thickness/span length, t/L -
*ig. 3.6 The results of-Fig. 3.5 ploted using the measured strengths.
For the purposes of comparison, the theoretical strength contourshave been superimposed on the map;.the agreement is good.
47
loading conditions. For strengths per unit width and length,
P/bl, of less than 0.107 MN/m" , the minimum weight beam fails by
simultaneous face yielding and face wrinkling; for P/bl between
0.107 and 0.315 MN/mi, it fails by simultaneous face yielding,
face wrinkli'r Pnri (t-r- '-bearing" -;?d f')r P/bl grestet than 0.315
MN/mt, it fails by simultaneous face yielding and core. shearing:
For a given required strength of beam, P, span, 1, and width, b,
the optimum values of' face thickness, t, core thickness, c, and
core density, , can be found from Fig. 3.3, while the minimum
weight itself can be read from Fig. 3.2. The values of core
density which minimize weight also optimize the thermal
performance of the panel.
'348
•: : 48
o jcý
oo
0 0
00 < O 0 ~ e~o = o 0 0 0 0
6Zo o o - 0 00
3 References
1. Gibson, L.J., Ashby, M .F., Schajer, G.S. and Robertson, C.I.(1982) Proc. R. Soc. Lond. A382, 25.
2. Gibson, L.J. and Ashby, M.F. (1982) Proc. R. Soc. Lond. A382,43.
3. Maiti, S.K., Gibson, L.J. and Ashby, M.F. (1984) Acta Met.32, 1963.
4. Triantafillou, T.C. and Gibson, L.J. (1987) Mat. Sci. andEng.
49
4. Creel of Sandwich Panels 0 0
r i, . Introduction
At and above their glass transition temperature polymers
show slow, permanent, time-dependent deformations, or creep.
For many polymers the glass temperature is near room temperature
(Table 4.1) making creep an important consideration in the design
of sandwich panels using polymeric foam cores. Metals and
ceramics creep, too, though the rate of creep is significant only
when the temperature is greater than about one third of their
melting temperature. In this part of the project, our goal is to
describe the creep of u sandwich panel with a polymeric foam core
which creeps with time. We plan on first modelling the creep of
"a foam under constant load and then using the model to describe the
resulting creep of the panel. To date, we have reviewed the
literature on models for creep in polymers and foams and have
done some preliminary calculations on calculating the creep of a
sandwich panel with a creeping core. We plan on continuing this
work in the next year of the contract.
!4.2 Models for Creed in Polymers and Foams
Several models exist for the creep of solid polymers. The
simplest are the linear spring-dashpot models: the Maxwell
:element, consisting of a-spring and a dashpot in seris., the
Voift element, a spring and dashpot in parallel; and the Burger
body, a Max,'ell element in series with a Voigt element. The.
behaviour of each of these elements is described in many
"texts,.see McClintock and Argon [I], for instance. Linear
So50
cr- 0. r ocoOoo o. -.C
-, 6c' CCO b r t C
o *0
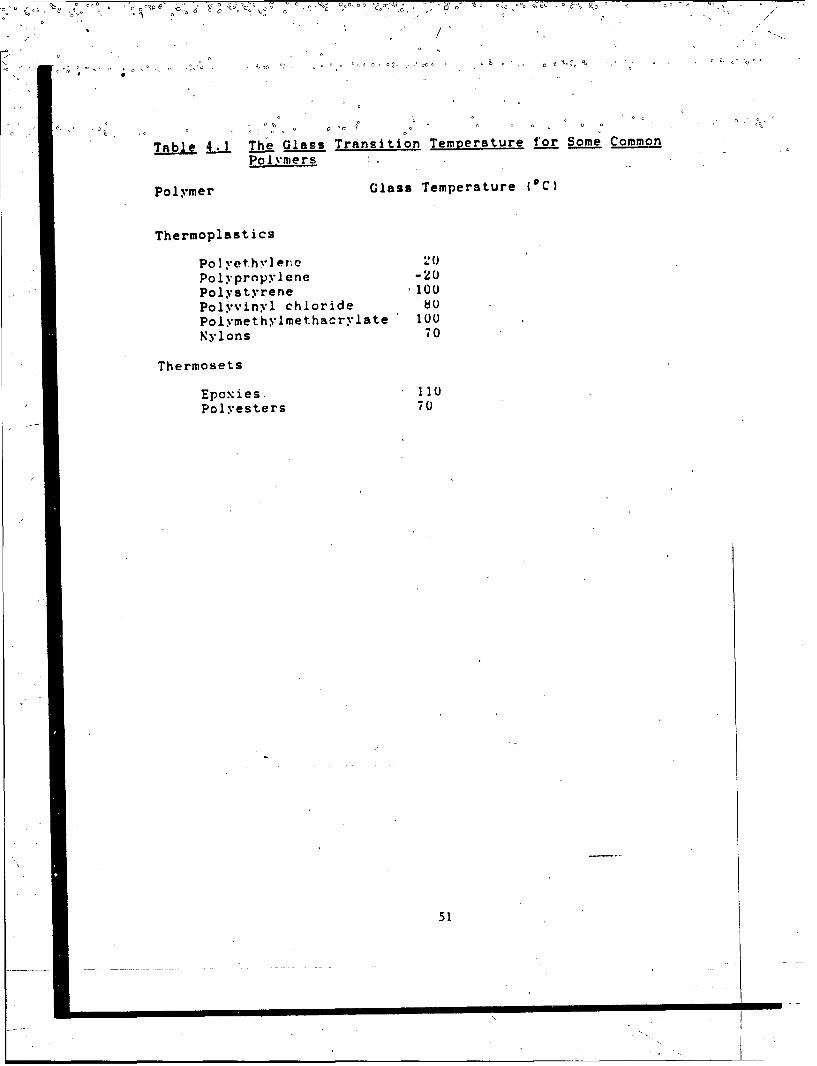
Table 4.1 Glass Transition Temperature for Some CommonPolymers
Polymer Glass Temperature (OC)
Thermoplastics
Polyethylene 20Polypropylene -20Polystyrene 100PolYvinyl chloride 80Polymethylmethacrylate 1O0Nylons 70
Thermosets
Epoxies 110Polyesters 70
51
* ° 00% • 0 b = • o • .. 0 o • oo . o . .. • • . . o
creep, for which superposition of stress is valid (e.g. a
doubling of stress results in a doubling of the strain at a given
* time) can be modelled using some combination of these elements.
In practice,'most polymers do not exhibit linear creep and more
K refined models are required to describe their behaviour. The
three most common-descriptions of non-l'inear creep in polymers
are: power-law method, the arc-sin.h method and the multiple
integral method. Spring dashpot models with non-linear springs
and dashpots are also sometimes used.
A plot, of creep strain against time often shows three
regimes: primary creep, in which the creep strain-rate'decreases
with time; secondary creep, for which the creep strain-rate is
constant; and tertiary creep, for which the creep strain-rate
increases with time. Materials with a constant, steady-state
secondary creep strain-rate can be described by power law creep
according to:
"and
o- where G is the secondary creep strain-rate, A is a constant,
Q is the activation energy for the creep process (a material
property), R is the universal gas constant, T is the temperature,
"is the applied stress, 6' is a material property and n is
52
II .
.oO• 0 O••:o• o•~~_• •~ • °''~OC• • • c0 •# -•o . . •OO~ o Co-o 'o, cO• ACog• o ½
PC YC
o o o ¢ o
another material property. If the duration of the load is large
then the pr~imary creep strains are small compared to the
secondary ones and this equationgives a good prediction of the
total creep strain. The secondary creep strain-rate of a wide
range of metals nnd _e:aai• 'an be described using tI,.s
equation; it is less commonly used for polymers. Gibson and
As hby have shown that a foam made from a solid cell wall material
that obeys power law creep should creep according to 12]:
where the superscript * refers to the foam property and the
subscript s refers to the solid cell wall property. C and C
are constants which can be determined b~y considering the two
limits of plastic collapse (for which n. *a and )s= C'ý . and of
linear elasticity (for which n E - E and
We find C 0.6 and C 1.7. Although both polymer and metal
foams have been tested in the creep range, the data are not
complete enough to allow a test of t.e above equation 13-61.
Polymers which do not have a constant, steady-state creep
strain-rate can be described in two ways: by the arc sinh method
or the multiple integral method. Both are essentially curve
fitting techniques. In the arc sinh method, the creep strain is
given by [7]:
53
0 o 0o 00 ¢c • o• o -• o oo o o
where 6 is the creep strain, ( is the applied stress, t is
time, and no M, t , 0"g , and r'^ are material constants which
are found empirically from a series of creep tests for different
levels of applied stress. The above equation can be used to
calculate the creep strain of a beam, and hence a foam, made rrom
a material following arc sinh creep. This remains to be done.
Green and Riv'lin 181 and Pipkin 19] have shown that the
nonlinear creep behaviour of polymers may be expressed as the sum
of multiple integrals up to the fifth order. To determine the
27 material constants for the multiple integral representation of
creep behaviour under multiaxial stresses the results of three
tension tests, t'.o torsion tests and two tests under coml:ined
tension and torsion of a thin walled tute are necessary. Brown
and Sidebottom [10],.in comparing the accuracy of the arc sinh
theory and the multiple integral theory found that although the
multiple integral theory was more complex, 'it was no better at
predicting creep strains of polyethylene under simple tension,
compression or torsion. Because of this, we will not consider
the multiple integral theory further.
.'Little data for the creep of foams exists. The most
complete study is that of Nolte and Findley [11] who measured the
creep response of both solid and foamed polyurethane under simple
1 tension, compression and torsion and under combined tension and
torsion. They used the multiple integral representation to
54
00°0 •C ,• o ~ o • °• c 0 0• o o O •o . ..... oC ,
VoOo. • o o ,Oo o 0o - o 6
0 00 0
predict the creep of the solid polyurethane and found that the
creep of the foam could be pr'edicted by multiplying the solid
creep strains by the ratio of the Young's modulus of the foam to
that of the solid.
4.3 Future Work
Creep of foams
Creep teýts at dift'Ji'•nt stress levels of foam6 L,1 dittertnt
relative densities and of the solid polymer from which they are
made are required to determine which creep theory to use to
describe the creep of a polymeric foam core and to measure the
material properties required for the use of the creep law. In
sandwich beams with a creeping foam core, the core may be subject
to either simple shear stresses or combined axial and shear
stresses; the creep tests of foams under. both loading conditions
will be necessary to predict the creep of sandwich beams.
CreeR of sandwich beams
The elastic deflection of a sandwich beam is the sum of the
bending deflection of the beam, which depends on the overall
flexural rigidity of the beam, and of its shear deflection, which
depends on the shear rigidity of the core. We propose first to
analyze the creep of a sandwich beam in which the foam core
creeps but faces do not (eg. a beam made with a polyurethane foam
core with aluminum faces). Creep tests on sandwich beams with
aluminum faces and polyurethane cores will be performed to
55
:: :!f'compare the analysis with creep data. If cthe analysis for a.o
Zcreeping core is satisfactory, then the analysis will be extended
;•i!••..,to •examine the problem of a sandwich beam made with both faces
:: and a core that creeps (as in, for instance,-a sandwich beam made
i[with %;ocd faL.ns and a folxrr onre). Again, creep tests Ln sandwich
beams with w~ood faces and a polyvurethane foam core will be
• iperformed to compare the analyNsis with creep data.' It is hoped
•'r: .that the analssis w€ill suggest design methods w~hich minimize the
!/•!creep of a sandwich beam under constant load.
:¢• 56
. - . .- 7.
09 9 0
O~9 0 979409 -Y :99099 ~99~ 0 9 9 9 99
-~ 0
C 'o~ o o - o o o c 0: o ~o~
S4 .4 References
I. McClintock, F. and Argon, A. (1966) The Mechanical Behaviourof Materials, Addison Wesley.
2. Gibson, L.J. and Ashby, M.F. (1,988) The Structure andProperties of-Cellular Solids, Pergamon.
3. Brori, W.B. (il60) Plastics Progress p. 149.
4. Hart, G.M., Balazs, C.F., and Clipper, R.B. (1973) J. Cell.Plast. 9, 13•9.
5. Thornton, P.H. and Magee, C.L. (1975) Met. Trans. BA, 18t01.
6. Campbell, G.A. (1979) J. Appl. Poly. Sci. 2-4, 709.
-. Findley, W.N. and Khosla, G. (1956) SPE Journal, December,1956, 20.8. Green, A.E. and Rivlin, R.S. (1960) Archive for Rational
Mechanics and Analysis 4, 387.
9. Pipkin, A.C. (1964-) Reviews of Modern Physics 36, 125.
10. Brown, R.L. and Sidebottom, O.Q. (1971) Trans. Soc. Rheology15, 3.
11. Nolte. I.G. and Findley, W.N. (1970) J. of Basic Engineering,ASME, March, 1970, p 105.
57
,. 2o ~ O~.c0, Co 0> "
... O.c l u sl o n s
From this study of optimum design methods for structural
sandwich panels we conclude the following.
(a) Deboncting
The equationR derived for the debonding load describe
the experimental data well. Debonding is only a problem w:hen
there is a preexisting crack larger that. twice the depth of the
core, which is unlikely to be the case.
(b) Minimum weight design of sandwich beam of a given strength
Failure mode maps can be used to find the critical failure
mode for any given strength of sandwich beam of known width and
span. The analysis gives the face and core thicknesses and the
core density which minimize the weight of the beam for any giv:en
strength; the results are summarized in Fig. 3.3. and 3.4. The
optimum core density for a sandwich beam with aluminum faces and
a polyurethane foam core loaded in three point bending is between
3 and 4.5 pounds per cubic foot for P/bl up to 100 nsi;, it is
interesting to note that the thermal .conductivity of foams is
lowest at 'this density so that this optimizes the thermal
performance of the panel also.
(c) Creep of sandwich beams
The initial literature review of models for creep in solid
polymers and foams is complete. We propose continuing work on
creep of sandwich beams in the second year of the project.
Specifically, we propose measuring creep in foamL and in sandwich
beams made using those foams.
58
-' •.
C C" C C ~ C o CC '0C o oCO C
Co CCo
c, C
APPENDIX LIST OF SYMBOLS
1 'I
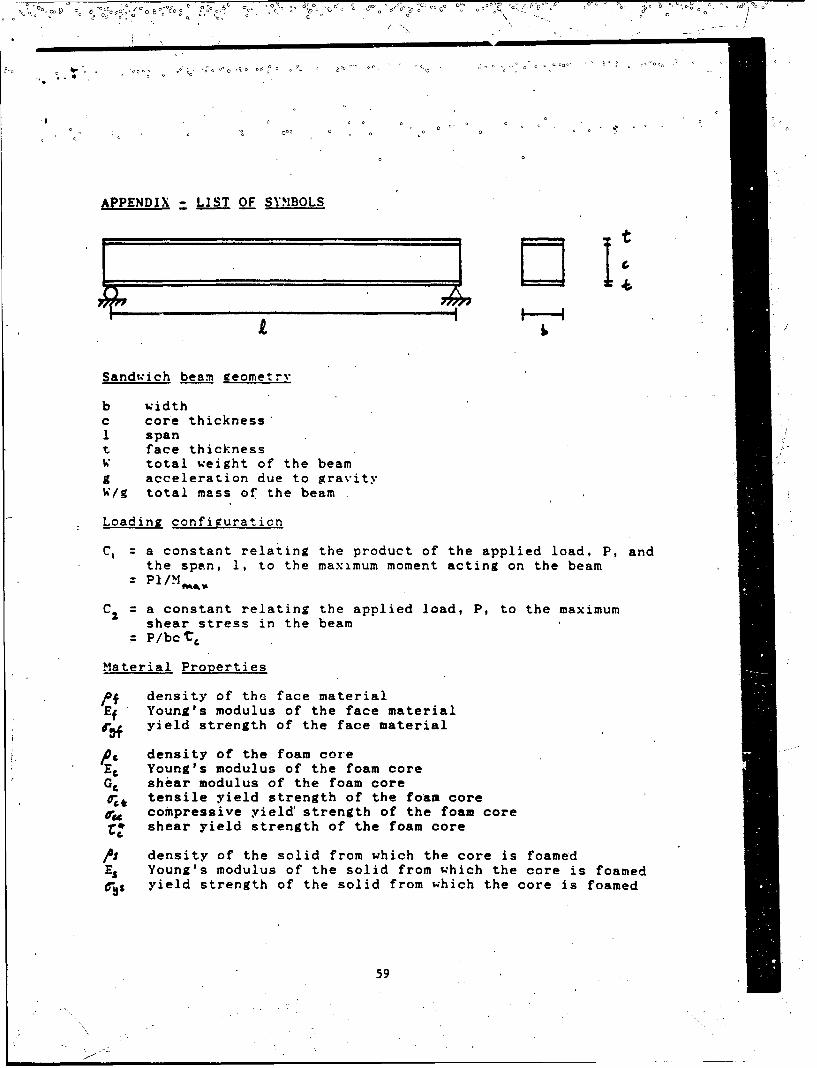
Sanduich beam geometry
b widthc core thickness'1 spant face thicknessW total weight of the beamg acceleration due to gravityW/g total mass of the beam
Loading configuraticn
C, a constant relating the product of the applied load, P, andthe span, 1, to the maximum moment acting on the beam
C2 a constant relating the applied load, P, to the maximumshear stress in the beamP/bc t.
Material Properties
0, density of the face material"Ef' Young's modulus of the face material
0- yield strength of the face material
J oe density of the foam core
EC Young's modulus of the foam coreGC shear modulus of the foam core
Cit tensile yield strength of the foam core• . compressive yield' strength of the foam core
shear yield strength of the foam core
,Ps density of the solid from which the core is foamedEs Young's modulus of the solid from which the core is foamedc-$ yield strength of the solid from which the core is foamed
59
\C
100
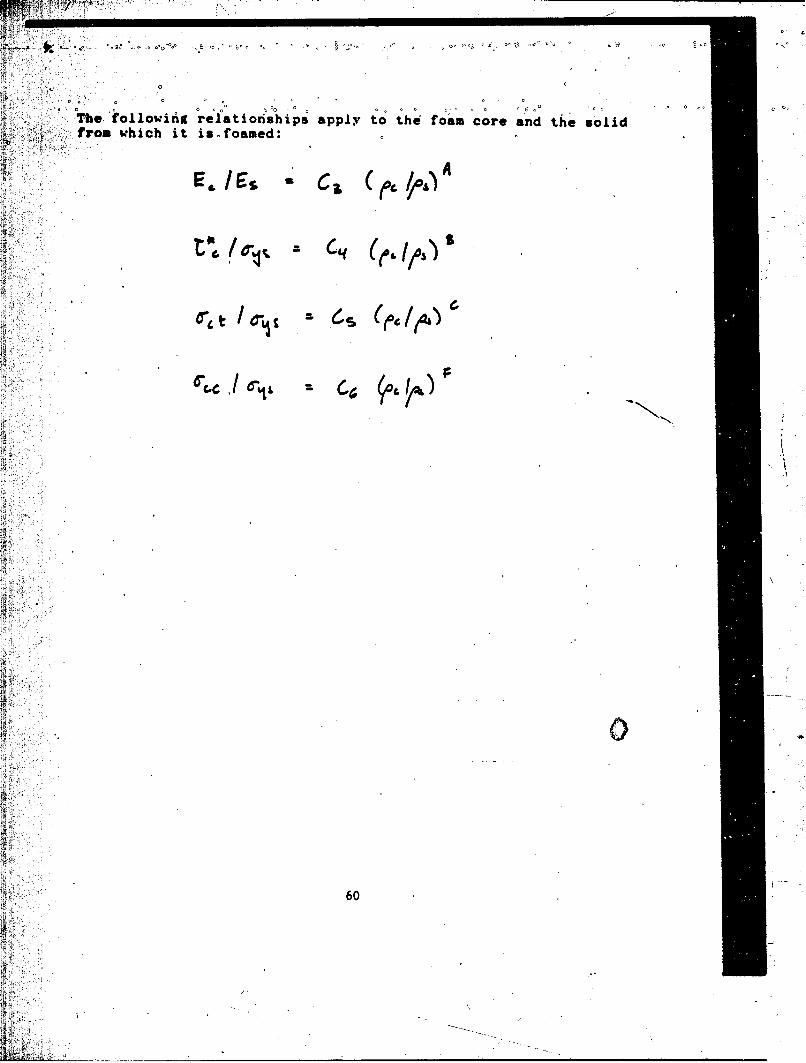
. .The following relationships apply to the foam core and the solid) !. from which it is foamed:
i•- r. 3 C6d 6 S
iif60
60
,ii~r