introduction - dtic
TRANSCRIPT

Michael M. Swisdak, Jr.
ABSTRACT
Operation DISTANT RUNNER produced data on the size and distribution of both airblast and debris produced by the detonation of 4500 kilograms of high explosive inside a Third Generation Hardened Aircraft Shelter. DISTANT RUNNER also produced data on the fragmenvdebris hazard ranges which are associated with detonations inside the shelter. After the full scale tests were completed, that event was modeled at two scales 1 :10 and 1 :4. These structures utilized detailed geometric modeling of both the rebar and the aggregate with which the reinforced structure was built. The concrete mixture, however, was modeled for the full-scale compressive strength. The 1:lO size model appeared to behave as if it were more like a 1:7 scale model. This appeared in the airblast, the size and distribution of the debris, and the hazard ranges produced by the debris. Because of this, testing at a larger scale was undertaken. This paper will present the results of breakup and debris throw for a quarter-scale shelter. Results obtained from all three scales will also be compared. For the structure modeled in these tests and with the decisions which were made about the details of the modeling utilized, the apparent scale factor (as determined from the breakup of the structure) differs from the design scale factor. As the scale size becomes larger (i.e., smaller models), the differences between design and apparent scale factor increases .
INTRODUCTION
During August through September 1981, Field Command, Defense Nuclear Agency (FC/DNA) conducted a five-event, high explosive test series at White Sands Missile Range, New Mexico. This test series, DISTANT RUNNER, was part of the Defense Nuclear Agency's Theatre Nuclear Forces Survivability, Security, and Safety Program. Event 4 of that series exposed one hardened aircraft shelter (HAS) to an internal pressure/fragmentation loading generated by the simultaneous detonation of 12 MK 82 General Purpose Bombs (Net Explosive Weight (NEW) 1040 kg (2292 pounds) of tritonal) inside the closed shelter. Event 5 exposed another shelter to an internal pressure/fragmentation loading generated by the simultaneous detonation of 48 MK 82 General Purpose Bombs (Net Explosive Weight (NEW) 4159 kg (9168 pounds) of tritonal) inside the closed shelter. A detailed description of the DISTANT RUNNER Program is found in References 1-5.
Because of the scope and completeness of the data generated during the DISTANT RUNNER Series, it was felt that this was an ideal opportunity to investigate/validate the use of affordable models for the breakup of reinforced concrete structures subjected to internal detonations. Five small-scale (1/10) replica models were built and tested. Event 5 of DISTANT RUNNER was the prototype for all of these l/lO-scale models. The data generated included structural breakup, debris distributions (mass and areal density), internal
527
Report Documentation Page Form ApprovedOMB No. 0704-0188
Public reporting burden for the collection of information is estimated to average 1 hour per response, including the time for reviewing instructions, searching existing data sources, gathering andmaintaining the data needed, and completing and reviewing the collection of information. Send comments regarding this burden estimate or any other aspect of this collection of information,including suggestions for reducing this burden, to Washington Headquarters Services, Directorate for Information Operations and Reports, 1215 Jefferson Davis Highway, Suite 1204, ArlingtonVA 22202-4302. Respondents should be aware that notwithstanding any other provision of law, no person shall be subject to a penalty for failing to comply with a collection of information if itdoes not display a currently valid OMB control number.
1. REPORT DATE AUG 1992 2. REPORT TYPE
3. DATES COVERED 00-00-1992 to 00-00-1992
4. TITLE AND SUBTITLE Hardened Aircraft Shelter Test Program
5a. CONTRACT NUMBER
5b. GRANT NUMBER
5c. PROGRAM ELEMENT NUMBER
6. AUTHOR(S) 5d. PROJECT NUMBER
5e. TASK NUMBER
5f. WORK UNIT NUMBER
7. PERFORMING ORGANIZATION NAME(S) AND ADDRESS(ES) Naval Surface Warfare Center,Indian Head Division,10901 NewHampshire Avenue,Silver Spring,MD,20903-5640
8. PERFORMING ORGANIZATIONREPORT NUMBER
9. SPONSORING/MONITORING AGENCY NAME(S) AND ADDRESS(ES) 10. SPONSOR/MONITOR’S ACRONYM(S)
11. SPONSOR/MONITOR’S REPORT NUMBER(S)
12. DISTRIBUTION/AVAILABILITY STATEMENT Approved for public release; distribution unlimited
13. SUPPLEMENTARY NOTES See also ADA260985, Volume II. Minutes of the Twenty-Fifth Explosives Safety Seminar Held in Anaheim,CA on 18-20 August 1992.
14. ABSTRACT see report
15. SUBJECT TERMS
16. SECURITY CLASSIFICATION OF: 17. LIMITATION OF ABSTRACT Same as
Report (SAR)
18. NUMBEROF PAGES
20
19a. NAME OFRESPONSIBLE PERSON
a. REPORT unclassified
b. ABSTRACT unclassified
c. THIS PAGE unclassified
Standard Form 298 (Rev. 8-98) Prescribed by ANSI Std Z39-18

and external airblast, and full-scale debris hazard range. Thls effort is described In References 6-7.
Analysis of the l/lO-scale results (airblast and debris slze) (reported in Reference 6) indicates that the structure behaved as If It were larger than It actually was. That Is, the data indicate that It behaved more like a 116.586 scale rather than a 1/10 scale. Reference 6 postulated several possible reasons for this dlfference In breakup. These included: (1) concrete strength, (2) use of welded wlre mesh instead of rebars, and (3) scaling of the surface energy of the concrete.
Because of the questions that grew out of the analysis of the l/lO-scale data, it was proposed that a further series of experiments at a larger scale (approaching 1/3 to 1/4) be undertaken. Thls program was to Include developmental "slab" tests at various scales before 8 full model (at a scale to be determined) was bullt. Because of funding constraints, it was decided to jump dlrectly to the larger model test, omitting the intermediate "slab" tests which were to be used to better describe the concrete breakup, shape, and mass distrlbutlons as a function of scale. After lnvestigatlon, it was decided that the most economical scale (from the standpoint of the availability of materials) was 1/4-scale. In 1990, one V4-scale model aircraft shelter was constructed at the New Mexico Institute of Mining Technology (NMIMT), Socorro, New Mexico. Twenty-nine days after the final concrete pour (exhaust port), the modei was tested. Reference 8 describes the NMIMT effort in model constructlon and data collection.
MODEL PHILOSOPHY
The l/lO-scale trials were designed to model both the external shots as well as Event 5 of DISTANT RUNNER. In addition, a mass model of an aircraft was included inside each shelter. Each MK 82 bomb and Its location was also modeled. internal and external airblast were measured on each shot. After this test series was completed, It was the consensus that the pre-conditloning shots (external airblast events) did not contribute to the strength (or weakness) of the model and could be eliminated from any further testing effort. Moreover, the mass model of the airplane did not seem to contribute to shelter response or to the external debris (only small amounts of material attributable to the airplane model was located outslde the shelter). As a result, for the 1/4-scale test, no airplane model was Included and airblast was not recorded.
1/4-SCALE MODEL DETAILS
The total NEW on DISTANT RUNNER Event 5 was 9,168 pounds--contained in 48 Tritonal-loaded MK 82 bombs. When the NEW is calculated for l/4-scaie, it is 143.25 pounds of tritonal. It was decided to substitute Compositlon C-4 for the tritonal. When the TNT equivalences are taken Into account, approximately 130-140 pounds of C-4 are required, depending upon the TNT equivalence selected. Each bomb case was simulated by Iron pipe with nominal outer diameter 2.625", inner diameter 2.386", and length 13.5 inches. A 0.375" end cap was welded on one end. The total explosive weight (including C- 4 explosive and the C3 DETASHEET used to initiate It) was 137.08 pounds. All bomblets were initiated simultaneously, using Identical lengths of NONEL and detonating cord. Figures I and 2 show the locations of each bomblet stack.
528
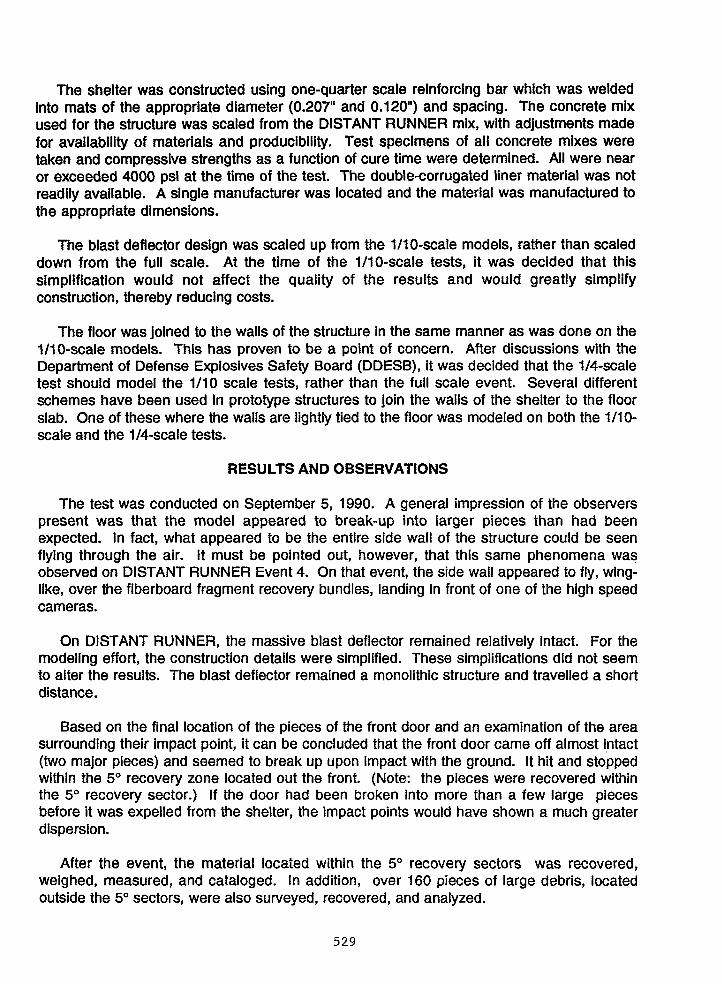
The shelter was constructed using one-quarter scale reinforcing bar which was welded into mats of the appropriate diameter (0.207" and 0.120") and spacing. The concrete mix used for the structure was scaled from the DISTANT RUNNER mlx, with adjustments made for availability of materials and producibility. Test specimens of all concrete mixes were taken and compressive strengths as a function of cure time were determined. All were near or exceeded 4000 psi at the time of the test. The double-corrugated liner material was not readily available. A single manufacturer was located and the material was manufactured to the appropriate dimensions.
The blast deflector design was scaled up from the l/lO-scale models, rather than scaled down from the full scale. At the time of the l/lO-scale tests, it was decided that this simplification would not affect the quality of the results and would greatly simplify construction, thereby reducing costs.
The floor was joined to the walls of the structure in the same manner as was done on the I/lO-scale models. This has proven to be a point of concern. After discussions with the Department of Defense Explosives Safety Board (DDESB), it was decided that the 1/4-scale test should model the 1/10 scale tests, rather than the full scale event. Several different schemes have been used in prototype structures to join the walls of the shelter to the floor slab. One of these where the walls are lightly tied to the floor was modeled on both the 1/10- scale and the l/4-scale tests.
RESULTS AND OBSERVATIONS
The test was conducted on September 5, 1990. A general impression of the observers present was that the model appeared to break-up into larger pieces than had been expected. In fact, what appeared to be the entire side wall of the structure could be seen flying through the air. It must be pointed out, however, that this same phenomena was observed on DISTANT RUNNER Event 4. On that event, the side wall appeared to fly, wing- like, over the fiberboard fragment recovery bundles, landing in front of one of the high speed cameras.
On DISTANT RUNNER, the massive blast deflector remained relatively intact. For the modeling effort, the construction details were simplified. These simplifications did not seem to alter the results. The blast deflector remained a monolithic structure and travelled a short distance.
Based on the final location of the pieces of the front door and an examination of the area surrounding their impact point, it can be concluded that the front door came off almost intact (two major pieces) and seemed to break up upon impact with the ground. It hit and stopped within the 5' recovery zone located out the front. (Note: the pieces were recovered within the 5" recovery sector.) If the door had been broken into more than a few large pieces before it was expelled from the shelter, the impact points would have shown a much greater dispersion.
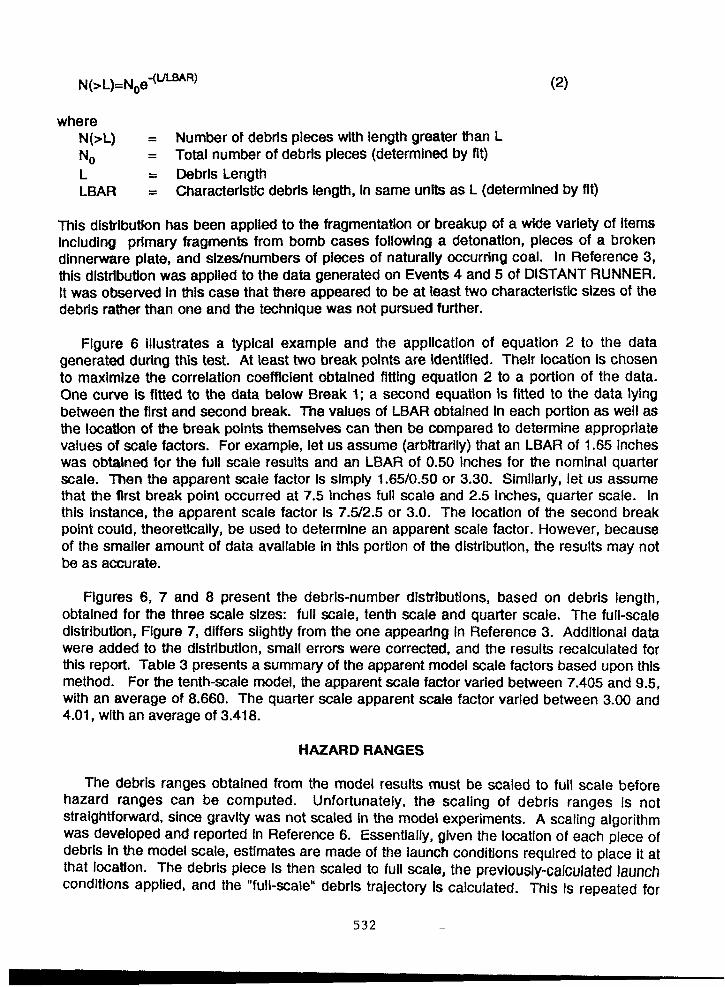
After the event, the material located within the 5' recovery sectors was recovered, weighed, measured, and cataloged. In addition, over 160 pieces of large debris, located outside the 5" sectors, were also surveyed, recovered, and analyzed.
529

Figure 3 Is a survey map of the large debris pieces which were located separately from the material in the 5" sectors. Over 160 large pieces of debris are included in this category. The front of the shelter is located at 0" (North), the recovery side of the shelter at 90' (East), and the rear at 180" (South). The 270' side faced a steeply up-sloping hill; thus, very little recovery effort was expended In this direction. If Figure 3 is compared with similar maps Qenerated for both the l/lO-scale (such as Figure 4-1 of Reference 6) and full scale events (Figure 14 of Reference 3), no outstanding differences are apparent.
Prior to the event, displacement cubes were placed on and around the outside of the structure. The reason for installing these cubes was twofold: (1) to act as debris of known size to be tracked photographically, and (2) from their final locations and known Initial starting points, to be able to backcalculate their launch velocity and angle.
There were two types of cubes used: (1) 2-inch aluminum cubes, weighing 0.75 pounds each (a total of ten were used) and (2) 6-Inch wooden cubes, weighing approximately 4.1 pounds each (a total of five were used). Figure 4 Is a sketch of the locations of each of the cubes.
Out of the fifteen cubes empiaced prior to the test, thirteen were recovered afterward. One of the wooden cubes had broken into two pieces, but both pieces were recovered. Two of the aluminum cubes were never located. Table 1 gives the final locations of each of the cubes. None of the cubes could be seen In any of the high speed photographic coverage. Using the information presented in Table 1 as weii as the initial locations of the cubes, a series of trajectory calculations was performed to bracket the initial launch conditions required for the cubes to land where they were found. The computer program TRAJQ was used for these calculations.
The sloping terrain present at the test site was Included in the trajectory calculations. In addition, the ricochet option was enabled, with the soil being described as dry sand (Sol1 Constant = 2.00). For those cubes In direct contact with the side of the shelter, it was assumed that the launch angle was within & 15 to 20" of the normal from the center of the shelter to the cube location. The results are shown In Table 2. Relatively low velocities were obtained, with consistent results being obtained from both types of cubes. It must be remembered that there Is no unique combination of launch velocity and angle for a given final location-rather a range of angles and velocities.
With the exception of the cubes located on the very top of the structure, the velocities were all less than 200 Ws. From the top of the structure, the velocities could be as high as 600 Ws. However, based on information presented In Reference 6, an upper limit of 400 ft/s would seem to be more realistic.
Before any appreciable breakup or movement could be observed on the high speed photography, the entire scene Is engulfed in flame and smoke. At very late times, approximately 100 milliseconds or more after detonation, the large debris pieces emerge from the cioud/dust and can be tracked. The velocities obtained are quite consistent with those obtained on the l/lO-scale model tests. It should be remembered that no velocity data was obtained on Event 5 of DISTANT RUNNER. On DISTANT RUNNER, the fireball obscured all useable data.
5 30

ANALYSIS
Over 35,000 separate pieces of debris are reported and cataloged. However, only those pieces weighing over 30 grains (1.9 grams) were considered in the following analyses. Calculations performed for the analysis of both the full-scale DISTANT RUNNER and the tenth-scale models showed that full-scale concrete debris must weigh at least 0.3 pounds to be hazardous. A 1.9 gram debris piece from a quarter scale model would correspond to 121.6 grams (0.26 pounds) full scale. Even after the lighter debris pieces were eliminated, there were approximately 19,000 debris pieces to be considered.
Samples of the concrete debris collected in the 5” recovery areas were evaluated as to shape factor. The shape factor relates the debris weight with a length dimension according the relationship:
M = B*pc*L3 (1 1
where
M = Debris mass or weight B = Shape Factor pc = concrete density, nominally 150 Ib/ft3 L = (debris length x debris width x debris thi~kness)”~
The shape factor represents the fraction of the volume of the box determined by the debris, when that box is filled by the debris of mass M with density pc. Note that the dimensions (length, width, thickness) specify a box size within which the debris item can just fit. This is shown schematically in Figure 5.
Samples were selected from all three directions and statistically analyzed for shape factor and the effects of sieve size. For each direction, the average shape factor was 0.38. There was no apparent size effect. When the data are combined, an estimate of the shape factor for the 1/4-scale model can be established. This was 0.38 f 0.06, based on 4,478 samples. The average value obtained for DISTANT RUNNER was 0.44 0.03 (based on 5,837 samples); that for the tenth-scale models was 0.47 k 0.03 (based on a total of over 22,000 pieces for the five models).
The differences between the tenth-scale and the full-scale are statistically significant (at the 95% confidence level), as was pointed out in Reference 6. A similar, statistically significant, difference between the quarter-scale and the full scale results was also found. The effect of these differences is to contribute to the over-estimation of debris ranges based on the tenth- and quarter-scale results.
Porzel, in his development of the Technology Base for the Naval Explosives Safety Improvement Programlo, postulated the following number distribution for the breakup of materials:
531
where N(>L) NO = Total number of debris pieces (determined by fit) L = Debris Length LBAR
= Number of debrls pieces with length greater than L
= Characterlstk: debris length, in same u n b as L (determined by fit)
This distribution has been applied to the fragmentation or breakup of a wide variety of items including prlmary fragments from bomb cases following a detonation, pieces of a broken dinnerware plate, and sizednumbers of pieces of naturally occurring coal. in Reference 3, this distribution was applied to the data generated on Events 4 and 5 of DISTANT RUNNER. It was observed In this case that there appeared to be at least two characteristic sizes of the debris rather than one and the technique was not pursued further.
Figure 6 illustrates a typical example and the application of equation 2 to the data generated during this test. At least two break points are Identified. Their location is chosen to maximize the correlation coefficient obtained fitting equation 2 to a portion of the data. One curve is fitted to the data below Break 1; a second equation Is fitted to the data lying between the first and second break. The values of LBAR obtained in each portion as well as the locatton of the break points themselves can then be compared to determine appropriate values of scale factors. For example, let us assume (arbltrariiy) that an LBAR of 1.65 inches was obtained for the full scale results and an LBAR of 0.50 inches for the nominal quarter scale. Then the apparent scale factor Is simply 1.65lO.50 or 3.30. Similarly, let us assume that the first break point occurred at 7.5 Inches full scale and 2.5 inches, quarter scale. in this instance, the apparent scale factor is 7.92.5 or 3.0. The location of the second break point could, theoretically, be used to determine an apparent scale factor. However, because of the smaller amount of data available in this portion of the distribution, the results may not be as accurate.
Figures 6, 7 and 8 present the debris-number distrfbutions, based on debris length, obtained for the three scale sizes: full scale, tenth scale and quarter scale. The full-scale distribution, Figure 7, differs siightiy from the one appearing in Reference 3. Additional data were added to the distribution, small errors were corrected, and the results recalculated for this report. Table 3 presents a summary of the apparent model scale factors based upon this method. For the tenth-scale model, the apparent scale factor varied between 7.405 and 9.5, with an average of 8.660. The quarter scale apparent scale factor varied between 3.00 and 4.01, with an average of 3.418.
HAZARD RANGES
The debris ranges obtained from the model results must be scaled to full scale before hazard ranges can be computed. Unfortunately, the scaling of debris ranges is not straightforward, since gravity was not scaied in the model experiments. A scaling algorithm was developed and reported in Reference 6. Essentially, given the location of each piece of debris In the model scale, estimates are made of the launch conditions required to place it at that location. The debris piece is then scaled to full scale, the previously-calculated launch conditions applied, and the "fuil-~ale" debris trajectory is calculated. This is repeated for
532

each debris piece. As indicated above, the algorithm is detailed in Reference 6. As a check on the algorithm, the procedure was applied to the full scale DISTANT RUNNER results. If the procedure Is working appropriately, the same debris locations as the input conditions should be returned when the algorithm Is applied. This was, indeed, the case.
Certain assumptions and information are required before the algorithm can be applied. These include the densities and shape factors of the debris. In addition, a debris cut-off velocity must be specified. When a piece of debris impacts the ground and breaks up into smaller pieces, one result Is an unrealistic estimate for the initial velocity of the intact piece. When the calculated initial debris velocity exceeds this specified value, that particular piece of debris is not considered further. A value of 400 ft/s has been utilized in all these debris analyses. This value is consistent with both the photographically-determined and the displacement cube-inferred velocities previously reported.
I
Since the debris analyses were performed and reported in References 3 to 7, additional work1lI1* has been performed on the standardization of such analyses. One Important difference is the calculation of a pseudo-trajectory normal (PTN) hazardous fragment density. These new techniques have been applied to the original DISTANT RUNNER Event 5 data as well as to the data from the five tenth-scale models. The results are shown in Table 4. The ranges were only slightly different using both the old and the newer, preferred technique.. The quarter-scale results are very similar to the full scale DISTANT RUNNER results out the side and the rear, but are significantly longer out the front. Out the front, the quarter-scale results more closely resemble the tenth-scale results.
On both the tenth-scale and quarter-scale models, the front door assembly hit within the recovery sector, bounced, and broke up. On the full scale event, the door landed outside the 5" recovery sector. This would help to explain why the hazard range in the direction to the front of all of the models was significantly greater than the DISTANT RUNNER range.
SUMMARY
Three distinct sizes of reinforced concrete structures have now been constructed and tested to destruction: (1) DISTANT RUNNER at full scale, (2) a series of five tenth-scale models, and (3) one quarter-scale model. In the most general terms, all three behaved in a similar manner.
One objective of the model testing is to determine if the hazard ranges can be inferred from the model results. DISTANT RUNNER showed that the explosives safety quantity- distance (ESQD) range for these third-generation hardened aircraft shelters was controlled by the debris/fragmentation rather than airblast. The series of tenth-scale model tests showed that the full-scale airblast results were, indeed, adequately predictable from these model data. Because of this and because the airblast did not drive the ESQD range, airblast was not measured on the quarter scale test.
The tenth-scale models overpredicted the debris hazard range in all three directions. The quarter-scale model agreed with the full-scale results off the side, slightly underpredicted them off the rear and overpredicted them out the front. One reason both the tenth- and quarter-scale models overpredicted the range out the front is because of the
533

behavior of the front door. At full scale, the doors seemed to hold together and landed outside the recovery sectors, not influencing the debris density for the front recovery sector. On both model scales, the doors landed within the recovery sectors.
At the 95% confidence level, the shape of the recovered debris (as measured by the debris shape factor) for both the tenth- and quarter-scale results, was statistically different from the full-scale results.
The apparent scale factor, i.e., the scale factor inferred from experimental data, was less than the design scale factor for both model scales. At tenth-scale, the average apparent scale factor (as determined by the length distribution) was 8.66 rather than 10. At quarter- scale, the factor was 3.42.
Another objective of this program was to examlne the relationship between the "design- scale" of a model and its "apparent-scale", as determined from its breakup behavior. Figure 9 presents this relationship as determined for the relnforced concrete structures tested during this program. A caveat must be applied here. Only this one type of structure has been considered. The relationship shown In Figure 10 may not apply to another type of structure or to a similar structure if signiflcant changes are made in the way in which the structure is modeled.
These series of tests have indicated that the breakup behavior of reinforced concrete structures can be inferred from model results. The gross breakup pattern is similar. The shape factors are nearly identical. The hazard ranges mirror the full scale numbers.
534

1.
2.
3.
4.
5.
6.
7.
8.
9.
10.
11.
12.
REFERENCES
LTC Flory, R. A., "DISTANT RUNNER," Minutes o f the 19th Exdosives Safety Sem inar. POD FxDlosives Sa fety Board , September 1980.
LTC Flory, R. A., "DISTANT RUNNER Results," M-Oth Fxplos ives Sa f a Seminar. l3oD Exolosives Sa fetv Boa ray August 1982.
Ward, J. M., "DISTANT RUNNER-Debris Recovery and Analysis Program for Events 4
August 1982.
Ward, J. M., "Debris Recovery And Analysis Program For DISTANT RUNNER Events 4, and 5,"Proceed inas o f the DISTANT RUN NER SYMPOSIUM. 27-28 April 19g , 2 September 1982.
Ward, J. M., Debris Ha z-xlnternallosions in Hardened Aircraft She Iterg,
and 5," Jvl %a h Explosiv in r Ex. I iv f - r ,
NSWC TR 86-114, 16 April. 1986.
Ward, J. M., et,, ~ E X R - 1 F losions Ins ide Scaled Ha rdened A ircraft Shelters, NSWC TR 85-470, 3 May 1986.
Swisdak, M. M., Aircraft Shelter Model Test (ASMT) Follow-uo Analvses, NSWC TR 86- 472, 30 September 1986.
Harvey, K. L., One-Quarte r Scale Third Generation Hardened Aircraft Shelter Test pesul&, NMT/TERA No. T-91-1834-U, 19 June 1991.
Montanaro, Paul, "TRAJ--A Two Dimensional Trajectory Program For Personal
B_oard, August 1990.
Porzel, F. B., "Technology Base of the Navy Explosives Safety Improvement Program," f h I h X I iv min r 0 x I iv f Board,
September 1980.
Swisdak, M. M., "Analysis of the Debris Produced By A Processing Building Accident," Minutes o f the 23rd ExDlosives Sa fetv Se minar. DoD ExDlosives Sa fety Board, August 1988.
Swisdak, M. M., "Procedures For the Analysis Of The Debris Produced By Explosion Events," -4th f E 2 E f m r xolosives Sa fety Board, August 1990.
Computers," -m Min f the 24th Explosiv i r x I iv f -
535

1
* a32" -
I
\ Rear wal of shelter
i
T -
FIGURE 1. PLAN VIEW OF QUARTER SCALE SHELTER SHOWING BOMBLET LOCATIONS

3 r
%-+--
I t
v)
2
0
0
0
A
I- w
J
pa E
0
rn
5
537
FIGURE 3. SURVEY MAP OF LARGE DEBRIS
700 600 500 400
300 200 100
0 100
200 300 400
500 600 700
BACK OF SHELTER
538
I aluminum cube
wooden cube Y
FIGURE 4. 1/4=SCALE SHELTER: DISPLACEMENT CUBE LOCATIONS
\
FIGURE 5. SHAPE FACTOR MEASUREMENTS
540
FIGURE 6. DEBRIS-NUMBER DISTRIBUTION: DISTANT RUNNER (full scale)
CURVE FIT: L d . 8 inches
TENTH SCALE DATA
CURVE FIT: 0.8 in < L el .O in
- 4- - -
- -O - - DISTAM RUNNER NU SCALE DATA
N(L) = 33481 O*e(-u0.9856) for 7.5 in < L < 9.5 in
LENGTH, L (in)
FIGURE 7. DEBRIS-NUMBER DISTRIBUTION: TENTH SCALE MODELS
5000
1000
100
I -7
\/ 1 \ 1
N(~L)=19194O*e(~~~*~~~~) for 0.8 in <L ~ 1 . 0 in
I 1 lo 0 0.5 1 1.5
L (inches)
541

FIGURE 8. DEBRIS NUMBER DISTRIBUTION: QUARTER SCALE MODEL
1 o4
1000
100
10
FIGURE 9. DESIGN VERSUS APPARENT SCALE FACTOR
DESIGN SCALE FACTOR
- 542
TABLE 1 FlNAL DISPLACEMENT CUBE LOCATIONS ~~
X B E NUMBEF
AC-1 AC-2 AC-3 AC-4 AC-5 AC-6 AC-7 AC-8 AC-9 AC-10
w-1 w-2
W -2A w-3 w-4 w-5
NOTES:
MATERIAL
ALU MI NU M ALU MI NU M ALU MI NU M ALUMINUM ALUMINUM ALUMINUM ALU MI NU M ALUM1 NU M ALU MI NU M ALU MI NU M
WOOD WOOD WOOD WOOD WOOD WOOD
ISTANCE HORIZONTAL
(FEET) 159.6 126.14
not located 277.61 241.59 229.2 220.73
not located 137.75 98.76
147.52 199.5 169.02 248.55 254.09 21 1.31
VERTICAL (FEET) -1 0.03 -6.29
-1 5.48 -1 2.55 -1 2.08 -1 1.75
-1 0.05 -1.59
-1 0.36 -8.88 -1 3.01 -12.96 -1 1.41
HORIZONTAL ANGLE
DEG.MIN.SEC 107.55.44 100.42.03
90.03.09 88.24.1 4 86.37.49 82.42.55
123.35.46 179.1 4.1 1
83.55.00 91.07.00 85.08.40 82.27.43 87.31.55 82.33.00
(-I) Distances and angles are measured relative to the center of the shelter (2) 0" is out the front of the shelter (3) Because of the sloping terrain, the vertical displacements
are included
543

TABLE 2. INITIAL CONDITIONS DETERMINED FROM DISPLACEMENT CUBE LOCATIONS
MATERIAL
Aluminum Wood
Aluminum Wood
Aluminum Wood
Aluminum Wood
Aluminum
Wood
IDENTIFICATlOlr(N1TlAL HEIGHT INITIAL A N G d FINAL RANGE LAUNCH ANGLE LAUNCH VELOCID NUMBER
(feet) (“1 (feet) (“1 (fVS)
5 0.2 0 242 5-10 130-160 130-160 5 0.2 0 a1 1 1-9
4 2.5 15 276 0-14 130-160 4 2.5 15 252 10-25 120-160 3 6.6 35 not found not calarlated not calculated 3 6.6 35 249 30-40 90-120
10-40 130-150 2 7 50 126 30-70 60-80 2 7 50 bmken not calarlated not calculated 1 7.5 90 160 81-85 200-250
85-87 250-400 86-87 450-600
1 7.5 Go 148 72-82 140-160 78-84 180-200 81-85 250-300
------ 83-88 300-500
544
2
Aluminum 8 7.5 Aluminum 9 7.5
Aluminum 10 4
15 229 & 221 12-18 110-130 130-150
wl not found not calarlated not calculated 10 to -6
$0 138 30-50 50-70 72-78 90-1 10 76-78 110-130 78-84 130-150 80-84 150-170 82-85 170-180
190-210 82-86 45 99 20-80 50-70
10--20 70-90
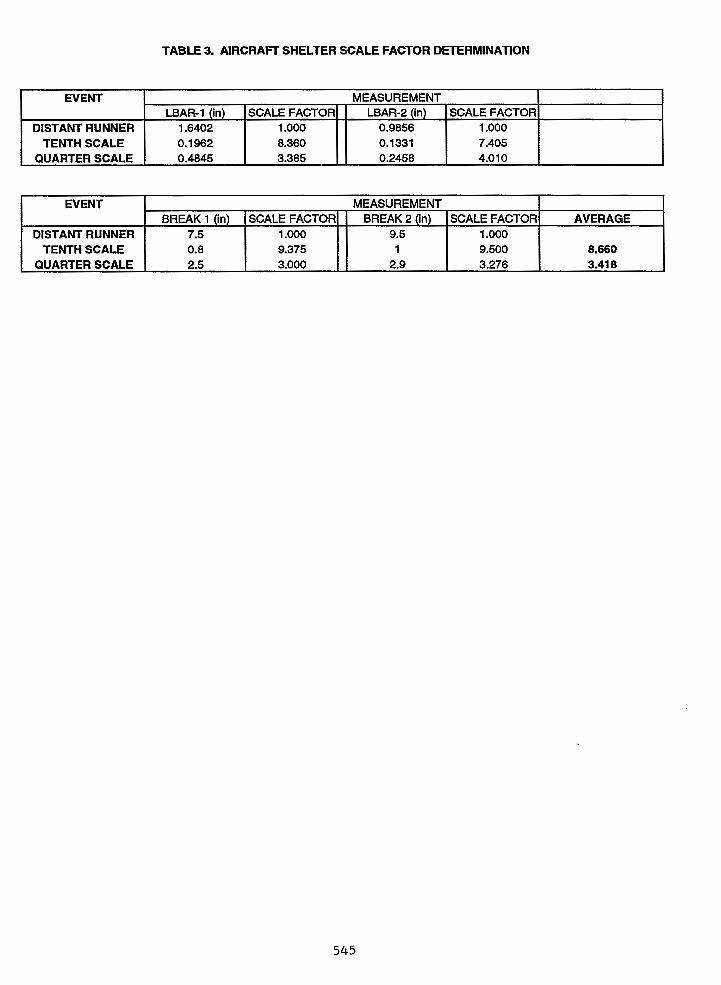
TABLE 3. AIRCRAFT SHELTER SCALE FACTOR DETERMINATION
EVENT
DISTANT RUNNER TENTH SCALE
QUARTERSCALE
MEASUREMENT LBAR-1 (in) SCALE FACTOR LBAR-2 (in) SCALE FACTOR
1.6402 1 .ooo 0.9856 1 .ooo 0.1 962 8.360 0.1331 7.405 0.4845 3.385 0.2458 4.010
EVENT
DISTANT RUNNER TENTH SCALE
QUARTERSCALE
545
MEASUREMENT BREAK 1 (in) SCALE FACTOR BREAK 2 (in) SCALE FACTOR AVERAGE
7.5 1 .OOo 9.5 1 .ooo 0.8 9.375 1 9.500 8.660 2.5 3.000 2.9 3.276 3.41 8

TABLE 4. COMPARISON OF MODEL DATA WITH FULL SCALE HAZARD RANGES
EVENT
DISTANT RUNNER (OLD) DISTANT RUNNER (PTN)
TENTH SCALE-I (OLD) TENTH SCALE-2 (OLD) TENTH SCALE-3 (OLD) TENTH SCALE-4 (OLD) TENTH SCALE-5 (OLD)
rENTH SCALE-AVERAGE (OLE
TENTH SCALE-I (PTN) TENTH SCALE-2 (PTN) TENTH SCALE-3 (PTN) TENTH SCALE4 (PTN) TENTH SCALE-5 (PTN)
TENTH SCALE-AVERAGE (PTh
QUARTER SCALE fPTN)
HAZARD RANGE (rn/kp1/3) FRONT
19.6 20.1
26.88 26.29 24.90 25.6 1 25.90
25.9
25.93 26.63 27.1 0 22.72 28.66
26.2
26.9
I
SIDE 24.5 21.4
28.15 26.93 30.17 27.16 27.99
28.1
27.29 28.22 32.22 26.61 30.44
29.0
22.4
REAR 15.3 17.3
18.38 19.73 15.41 18.02 20.49
I 43.4
20.00 21.36 1 6.79 19.26 22.71
20.0
15.0
NOTES: (1) PTN is Pseudo Trajectory Normal Density (2) OLD is the previous method of calculating debris density
546