eeee00hhe00hhi - dtic
TRANSCRIPT

AO-AO 6A AA I EEOMETCNE AMNTRPAARRF TINVESTIGATION OF TRANSIENT INDUCED AERODYNAMICS IN A MOVING DEC -ETC U)
UNL0aI FEB 80 R E PALMERUNCLASSIFIED NADC60-60NL
ENDEEEE00hhE00hhI

36
1111IL25 1.4
MICROCOPY Pi S{ U1RN It', HR

REPORT NO. NADC-79260-60
INVESTIGATION OF TRANSIENT INDUCED AERODYNAMICS
:0 IN A MOVING DECK ENVIRONMENT
0
R. E. PalmerzNAVAL AIR DEVELOPMENT CENTER
Aircraft and Crew Systems Technology DirectorateWARMINSTER, PENNSYLVANIA 18974
7 FEBRUARY 1980
FINAL REPORTAIRTASK No. AO3V/0000/001B/9F41-400-000
Work Unit No. ZA602
Approved for Public Release; Distribution Unlimited
Prepared forNAVAL AIR SYSTEMS COD4'AND
• * Department of the Navy
Washington, DC 20361 ALUG 2 1 1980
2 0e80 8 21 058
NADC-79260-60
NOTICES
REPORT NUMEERNG SYSTEM - The numbering of technical project reports issued by the Naval Air Deve zmen:Center is arranged for specific identification purposes. Each number consists of the Center acronym, the caiendaryear in which the number was assigned, the seauence number of the report within the sneciic czlendar year, andthe official 2-dicit correspondence code of the Command Office or the Functional irectcratze resoonsibie for tnereport. For example: Report No. NADC-78015-20 indicates the fifteeth Center report for the year 1972., and preparedby the Systems Directorate. The numerical codes are as foqows:
CODE OFFICE OR DIRECTORATE
00 Commander, Naval Air Development Center01 Technical Director, Naval Air Development Canter02 Comptroller10 Directorate Command Projects20 Systems Directorate30 Sensors E Avionics Technology Directorate40 Communication & Navigation Technology Directorate50 Software Computer Directorate60 Aircraft & Crew Systems Technology Directorate70 Planning Assessment Resources80 Engineering Support Group
PRODUCT ENDORSEMENT - The discussion or instructions concerning commercial products herein do not cunst.tutean endorsement by the Government nor do they convey or imply the ficense or right to use such products.
APPROVED BY: _ _ _ _ _ _ _ DATE: . //'/Ji J. STURM
CDR USN
a
k:-, . .. . . . .. ,21 1

UNCLASSIFIEDItECUPAITY CLASSIFICATION Oir THIS PAGE (fthen boto Ent~ved)________________
REPDSTI~TOR TET DOUMNATO PAGE. REAeISTRCTO)
IBFOR SUPPLLMENTAG FOTRS
y. E WRDS (CUu1t1nue oi. GOwers ACCESIO .0 ne1.m Pi&'d* CATALOG~ NUMBER ~rVSTO
oerai in a Moving Deck Environment haebe ainaed Oly sinle9axis~~~~~~~~~~~~~~ deck moinRfhavpth erl eecnidrd yaieffects ~ ~ ~ ~ ~~~~~~~~O are dicNe Mihrsecoosatcdtendcmaisnnhw
using ~~~ ~ ~- aN deeoedpeicinmehd
DD T S. 1473RA NTO NS IS fSOET

SECURITY CLASSIFICATION OF THIS PAGE IWhen Det EMIGe
59CUNITY CLASSIPICATION OF THIS PAGILbhM Dbat En'ow0
NADC-79260-60
S U MMA RY
Transient induced aerodynamic adata has been analyzed for a subsonicVSTOL aircraft model operating inamoving deck environment. Only thesingle axis deck motions of heave, pitch, and roll have been considered.The equations governing this analysis are presented along with themethods used to reduce and analyze the data. Dynamic effects are discussedf or each deck motion and time history comparisons shown using developedprediction methodology. Conclusions are presented for this analysisalong with recomendations for further investigations into this area.
Appendix A presents a detailed discussion of the governing equationsalong with a description of the computer programs utilized. The transientinduced aerodynamic data which were analyzed for heave, pitch, and rollmotions are presented in Appendices B, C, and D respectively.
-Noma"

NADC-79260-60
T A BLE 0OF CO0N TE NT S
Page
Summary. .. .................. .............
List of Figures. .. ................... ...... 3
Introduction .. ................... ........ 5
Approach .. ................... .......... 5
Results. .. ................... .......... 7
Heave .. ................... ......... 7Pitch .. ................... ......... 21Roll. .. ................... ......... 33
Conclusions and Recommendations .. .......... ........ 50
References .. ................... ......... 54
List of Symbols .. ......... .................. 55
Appendix A - Governing Equations and Computer Programs .. ....... A-i
Appendix B - Heaving Motion Time History Data. .. ........... B-i
Appendix C - Pitching Motion Time History Data .. ........... C-1
Appendix D - Rolling Motion Time History Data .. .............D-i

NADC-79260-60
L I ST O F FI GU R ES
Figure No. Page
1 Three View of Subsonic VSTOL Configuration .. ........ 6
2 Heave, Pitch, and Roll Coordinate Systems. .. ....... 8
3 Typical Correlative Analysis Procedure .. .. ........ 9
4 Static and Dynamic Induced Lift in Heave, w - 1 Hz . .. 10
5 Static and Dynamic Induced Lift in Heave, w - 2 Hz ... 11
6 Static and Dynamic Induced Lift in Heave, w 3 Hz ... 12
7 Induced Lift versus Height Over Deck for Zero Deck Rate . 14
8 Induced Lift Time History Comparisons. .. ......... 15
9 'Static and Dynamic Induced Pitching Moment, h/de - 0.8 24
10 Static and Dynamic Induced Pitching Moment, h/de -2.0 26
11 Static and Dynamic Induced Pitching Moment, hide - 5.0 27
12 Static and Dynamic Induced Pitching Moment, h/de - 8.0 28
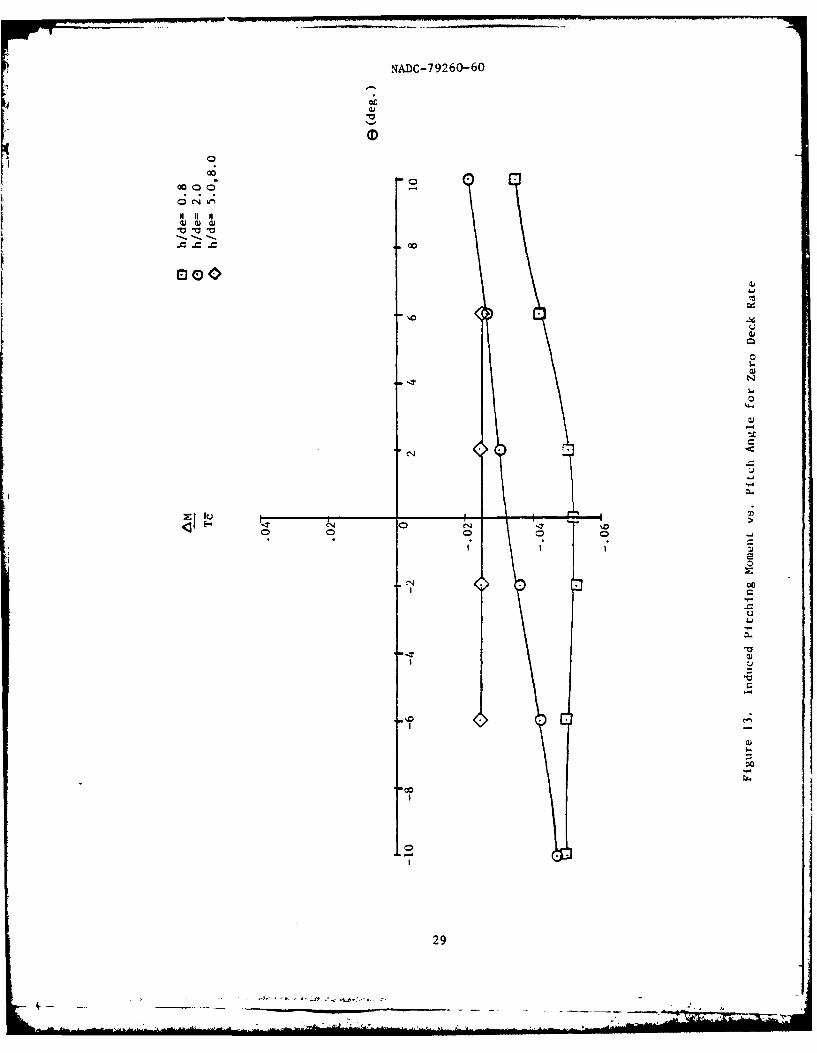
13 Induced Pitching Moment versus Pitch Angle for ZeroDeck Rate .. ......... ............... 29
14 Induced Pitching Moment Time History Comparisons . . . . 30
15 SaticandDynaic nducd Rllin Moenth/d - 08 4
15 Static and Dynamic Induced Rolling Moment, h/de - 20.. 43
17 Induced Rolling Moment versus Roll Angle for ZeroDeck Rate .. ........ ................ 46
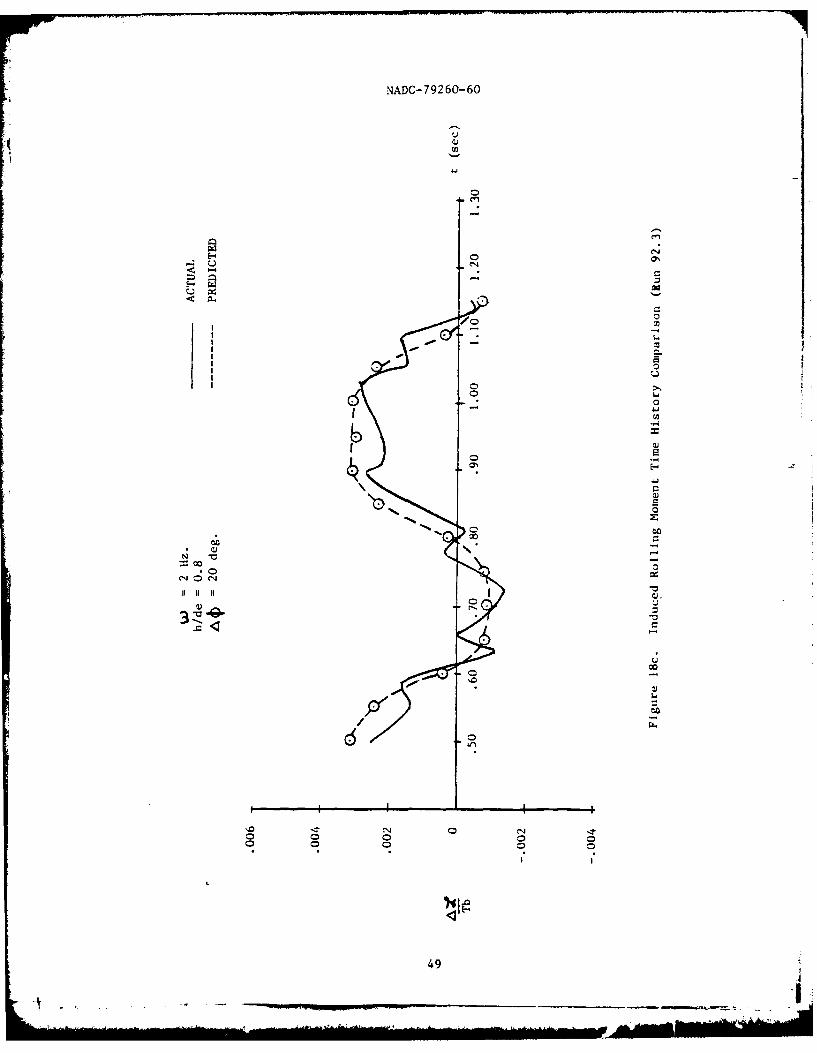
18 Induced Rolling Moment Time History Comparisons. .. .... 47
A-1 Data Analysis Flow Chart. .......... ....... A-6
A-2 Time Values as a Function of Frequency .. .......... A-8
B-1 Subsonic Heaving Motion Data - Run 89.2. .. ........ B-3
B-2 Subosnic Heaving Motion Data - Run 90.5. .. .........- 3
B-3 Subsonic Heaving Motion Data - Run 90.4. .. ........ B-4
3

NADC- 79260-60
L IS T 0OF FI G UR ES (CO0N T 'D)
Figure No. PMe
B-4 Subsonic Heaving Motion Data - Run 90.2. .. .........- 4
B-5 Subsonic Heaving Motion Data - Run 384.2 .. .........- 5
C-i Subsonic Pitching Motion Data - Run 82.1 .. ........ C-3
C-2 Subsonic Pitching Motion Data - Run 82.2 ... ....... c-3
c-3 Subsonic Pitching Motion Data - Run 82.3 ... ....... C-4
C-4 Subsonic Pitching Motion Data - Run 82.6 .. ........ C-4
c-5 Subsonic Pitching Motion Data - Run 82.5 .. ........ c-5
c-6 Subsonic Pitching Motion Data - Run 82.4 .. ........ c-5
C-7 Subsonic Pitching Motion Data - Run 85.1 .. ........ c-6
c-8 Subsonic Pitching Motion Data - Run 85.2 .. ........ c-6
C-9 Subsonic Pitching Motion Data - Run 85.3 ... ....... C-7
C-10 Subsonic Pitching Motion Data - Run 87.1 .. ........ C-I
C-li Subsonic Pitching Motion Data - Run 87.2 .. ........ c-8
C-12 Subsonic Pitching Motion Data - Run 87.3 ... ....... c-8
D-1 Subsonic Rolling Motion Data - Run 92.1. .. ........ D-3
D-2 Subsonic Rolling Motion Data - Run 92.2. .. ........ D-3
D-3 Subsonic Rolling Motion Data - Run 92.3. .. ........ D-4
D-4 Subsonic Rolling Motion Data - Run 163.1 .. ........ D-4
D-5 Subsonic Rolling Motion Data - Run 163.2 ... ....... D-5
4
NADC-79260-60
INTRODUCTION
Operating a V/STOL aircraft in ground effect can greatly alter theaerodynamic forces and moments acting on the aircraft. By introducing amoving ground plane, such as the deck of a DD963 class destroyer, thecomplexity of the resulting flow field is significantly increased. Thisadded complexity makes it even more difficult to perform successfulshipboard takeoff and recovery operations. In order to fully utilizethe potential shipboard operational capabilities of V/STOL aircraft abetter understanding of these phenomena is required.
To accomplish this, the effects of basic single axis deck motionsmust be examined. Analysis of these independent deck motions (heave,pitch, roll) enable the development of prediction technqiues applicableto a preliminary design envirorment. These methods provide the designera tool for estimating the transient aduced aerodynamics acting on aV/STOL aircraft in a moving deck environment.
Data for the three-fan subsonic V/STOL configuration oE-refarence (a)was selected for study. A three view drawing of the full scale configu-ration is shown in Figu~ei. As evident in this figure, the aircrafthas a low wing and high tail with two lift/cruise fans mounted above thewings and one lift fan in the forward fuselage. The method of analyzingthis data in terms of single axis deck motions will be discussed indetail in the following sections.
APPROACH
This analysis was limited to sinusoidal deck motions of heave,pitch, and roll only. Combined motions such as heave and roll were notconsidered due to the complexity that they introduce. These combinedmotions, however, should be considered in future analyses of transientinduced aerodynamics acting on a VSTOL aircraft.
The dynamic effects caused by a moving deck were investigatedthrough examination of the induced forces or moments in terms of frequency,amplitude, and height-above-deck. For each deck motion the inducedforce or moment was assumed to be a function of deck position and rate.In the cases of pitch and roll the effect of height-above-deck wasalso included as shown below:
AL.
T-- f(h,h) (1)
AiMf g(=, -, h) (2)
A~ k(o, $h) (3)Tb

NADC-79260-60
1 51.9 ft
Figure 1. Three View of Subsonic VSTOL Configuration.
6
NADC-7 9260-60
The equations defining the deck positions and attitudes at any time, which wereaifferentiated to obtain the desired rates, are presented below:
h -ho + Ah sin(wt) (4)2
0 - 9 + AO sin(wt) (5)2
- + AO sin~wt) (6)2
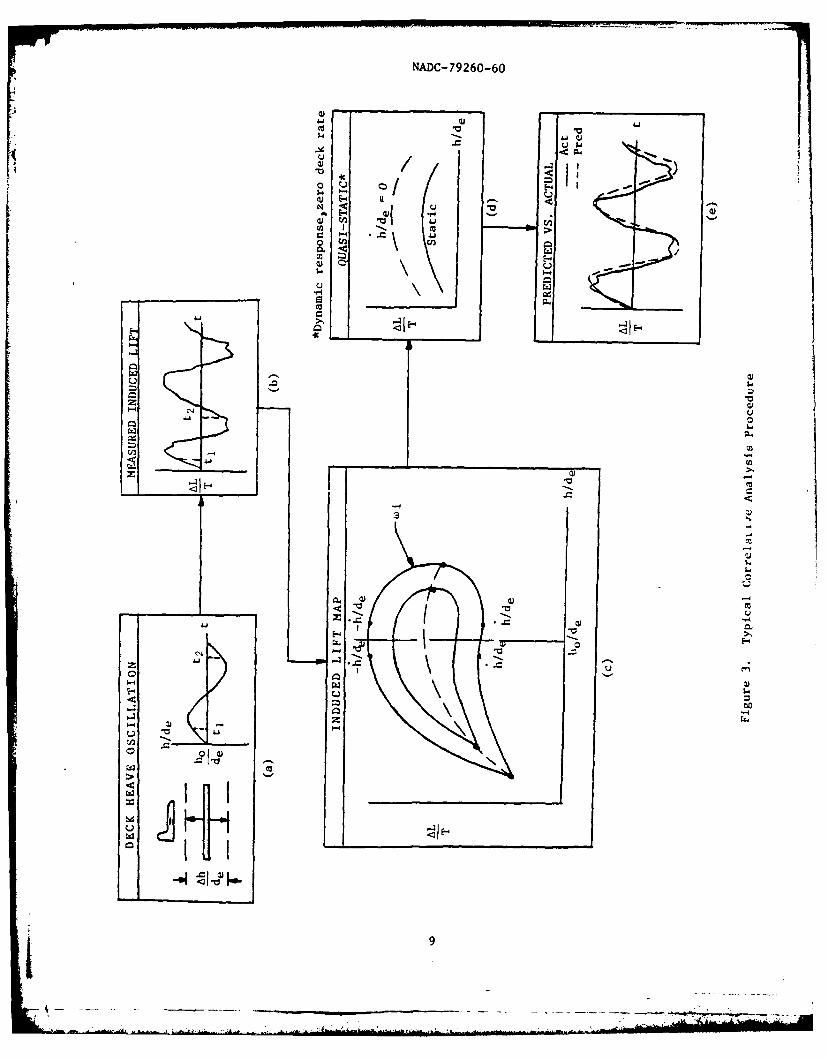
Figure 2 defines the various parameters of these equations. The deckposition and rate are used in a correlative analysis technique to determine thetransient induced effects as illustrated in Figure 3 ((a) through (e)). Thisexcample is limited to the transient induced lift resulting from variations indeck heave only; this being typical of the method applied to the cases for pitchand roll.
Through selection of a deck rate ( i/de) the corresponding position (hide)and time (tl, t 2 , ... ) were obtained, Figure 3(a). Knowing the measured inducedlift as a function of time, Figure 3(b'), and the corresponding deck position,the induced lift was cross-plotted with position. Since the deck motion wassinusoidal these data occurred in pairs about the neutral point (ho/de) for thespecified deck rate, Figure 3(c). By varying deck rate, an envelope of inducedlift versus position was developed corresponding to a given set of test para-meters, i.e., deck neutral point, ho/de, frequency, w, and amplitude, Ah/de.From this map a quasi-static (h/de = 0) induced lift was obtained in order topredict the actual transient induced effects, Figure 3(d). Comparisons of thesepredicted transient effects with the actual test data, Figure 3(e), are pre-sented in subsequent figures for selected test conditions.
R ES U LTS
Each of the three deck motions will be discussed in terms of the accompany-ing static and dynamic aerodynamic characteristics. Comparisons of actual timehistories of dynamic data with predicted time histories will also be presented.
HEAVE
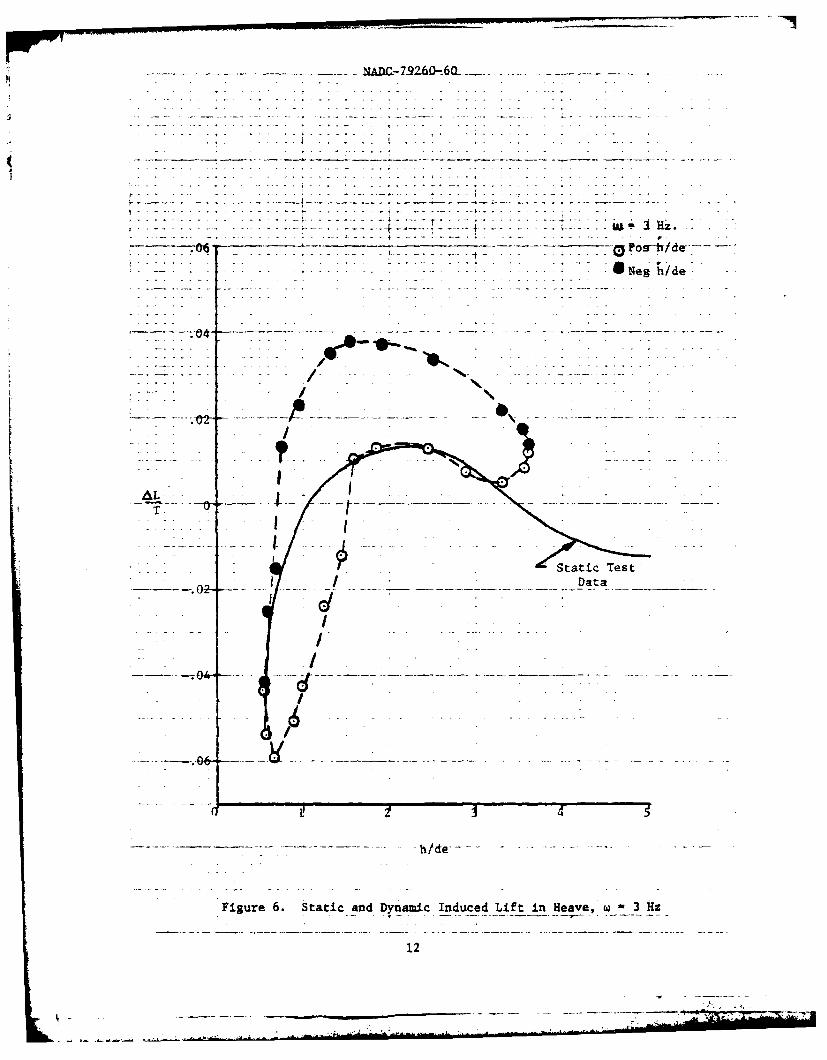
For the heaving deck motion, induced lift is the parameter which isexamined. Figures 4, 5, and 6 show induced lift plotted versus height above-deck for frequencies of 1, 2, and 3 Hz. As noted on these figures, the opensymbols correspond to positive rates (model heaving away from deck) while thec.Losed symbols represent negative rates (model heaving toward the deck). Forclarity, only the data run at the largest amplitude is plotted for each fre-quency although all amplitudes tested were considered in the analysis. Also,the neutral points for these figures correspond to the data run presented andnot necessarily to the other amplitudes.
7

NADC-79260-60
5
IC70 - ifi l l
-NIPC
WI
Uk... .. .j 'C ,' Z . .. ! I .... I L~ ... ".. .. '" ---
I.r.I, ., I,-.,
NADC- 79260-60
J.4c CIA4
Ccu
Cu /
ia
IV-
J-4
010
uC
4-9

- - - --- *-NADC-79L26-6. . . -..-.
--- -- - - - -- - - --.........- -......... ..j-Wj L Hz.
- OPo, h/de
.. Neg L/do.
. . . .. -. - - - -
010
~~7

*~2 Mi-.-
.... .... ....---- 0.. . . . .d.. . . .. . - . . .
* Neg h/dO
.4 T -
- - - - - - - - - - - - - - - - - --- Data-- -
96 -..
Figure 5. Static and Dynamic Induced Lift in Heave. w 2 Rz
4M1
C .. 2.6 ..~ ..
.. . .. .- Nei..--.
4------...........
* - - . ., - .- . ..- . . . .
. . . . . . . . . . . . . . . .. . ..-.- . ...... ... ~ h de
AL ____
T.
_ ~Data ___
//e-
Figure 6. Static and Dynamic Induced Lift in Heave, w 3 Hz
12
Aib".
NADC-79260-60
In Figure 4, w 1Hz, the dynamic data differs from the static datafor both positive and negative rates. This is also the case for w = 2Hzand w = 3Hz as shown in Figure 5 and 6 respectively. In each case thedynamic data shows a hysteresis type of effect depending on the ratebeing positive or negative. For negative rates, the dynamic resultsshow an increase in the static data over all values of h/de for w - Iand w = 3Hz. As shown for w = 2Hz for negative rates the dynamic resultsindicate a decrease in the static AL/T for h/de less than 1.1 and anincrease for h/de greater than 1.1. In each case for positive rates theresults indicate a decrease in the static AL/T up to a value of h/debetween 1.25 and 1.50. After this, an increase is seen up to an h/de of3.5 which was the maximum value tested. This increase gets smaller asthe frequency increases from w = I to 3 Hz with values close to staticvalue at w = 3Hz. The hysteresis effect described is consistent withthe findings of reference (a) and is attributed to the compressioneffect associated with the fountain. In the case of a positive rate,where the deck is heaving away from the model, a larger value of AL/T isevident as compared to a negative deck rate with the same magnitude.This indicates that positive rates amplify the suckdown while negativerates amplify the fountain force.
Data from Figures 4, 5, and 6 along with data for the amplitudeswhich are not plotted were used to develop a curve of induced liftversus height-over-deck for a zero value of deck rate. This curve isshown as Figure 7 along with the static test data. As seen in thisfigure, from an h/de of 0.5 to 1.0 the curve indicates a decrease inAL/T as compared to the static data.Above h/de = 1.0, the curve showsan increase in AL/T for all values up to the maximum of h/de = 3.5.
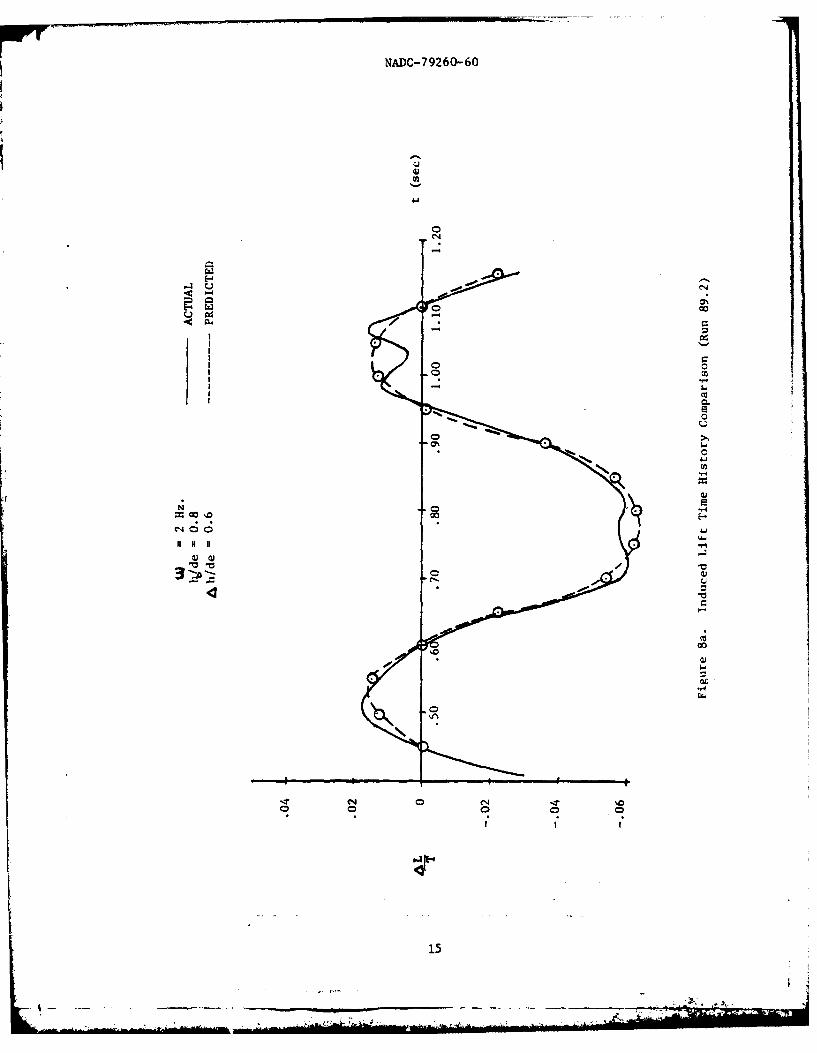
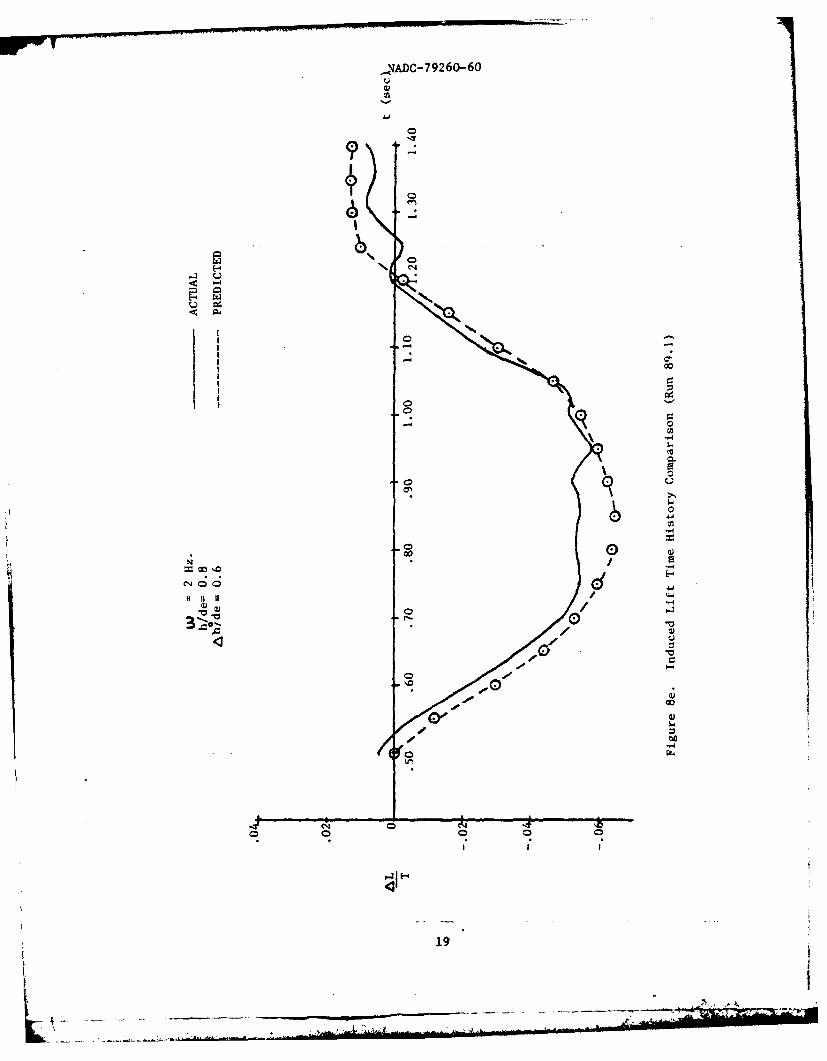
This curve of zero deck rate was used to estimate the induced liftas a function of h/de. By comparing these estimates with actual timehistory data the dynamic effects could be examined. These time historiesare shown in Figures 8a through 8h with the neutral point, amplitude,and frequency indicated. Also shown are the estimated values fromFigure 7 as indicated by the dotted lines. Figures 8a through 8d(w = 2Hz) are presented first since a more complete data base was avail-able for this frequency. Very good agreement is seen for an ho/de - 0.8over the time segment shown with peak values matching very well and noapparent time shift.
For ho/de = 2.0, Figures 8b through 8d, the predicted values arewithin 1.2% of the actual data. As the amplitude, Ah/de, is increasedthe response shows a larger suckdown effect. For Ah/de - 1.0 the smallestvalue of AL/T is 1.0% while at Ah/de - 3.0 a value if -6.0% is obtained.Also, the response becomes smoother and more sinusoidal as Ah/de isincreased.
Figures 8e and 8f show time histories for w - 1Hz and 3Hz at anho/de = 0.8 and Ah/de - 0.6 respectively. In Figure Be a good correlationis shown which is within 1.0% of the actual values for the time segmentpresented. It should be noted that these time histories are representativeresponses form the original 5 second data runs of reference (a). For
13
..

- -- .---..-- . -.-- - - NADC-79260-60 - -- . - -
- - ... - -.. . . . . .. . . ..
4---------.... .. ... . ~ -. f
- ~Zero Deck Rate
T
- tatic Test
1 I. Data
0 ~ -
5 II I- T
0.1-23 4 5
hide -
Figure 7. linduceed LVft vs. HeiZht Over Deck fo- Zero Deck Rate
14
NADC-79260-60
CC
CC
0S4
0~
co 00
0

NADC-79260-60
WU
0
11 0
~- co
24
-0 CN o
16u
..........

If NADC-7 9260-60
0 •
-4 ~ -
t) -
S0 0
! I
172

NADC-79260-60
c'4v
L)t
3
A -
181
.4: p..
I ..
0
/"I
10.
,JADC-79260-60
co 10
"( 6
.01
00
- -)
Of0o
190

NADC-79260-60
co-4
00
200

NADC-79260-60
w = 3Hz, figure 8f, good agreement is seen with the actual data wherepeak values are within 1.0%. For increasing values of AL/T and time thepredicted values are within 1.0% while a maximum difference of 2.0% isseen for decreasing values of AL/T and increasing time.
As indicated by figures 8e and 8f for w 1 I and 3Hz respectivelyand figure 8a for w - 2Hz, frequency does not appear to effect inducedlift at a neutral point of ho/de - 0.8. In each case the maximum positivevalue of AL/T is approximately 1.4% while maximum negative values areabout -6.0% AL/T.
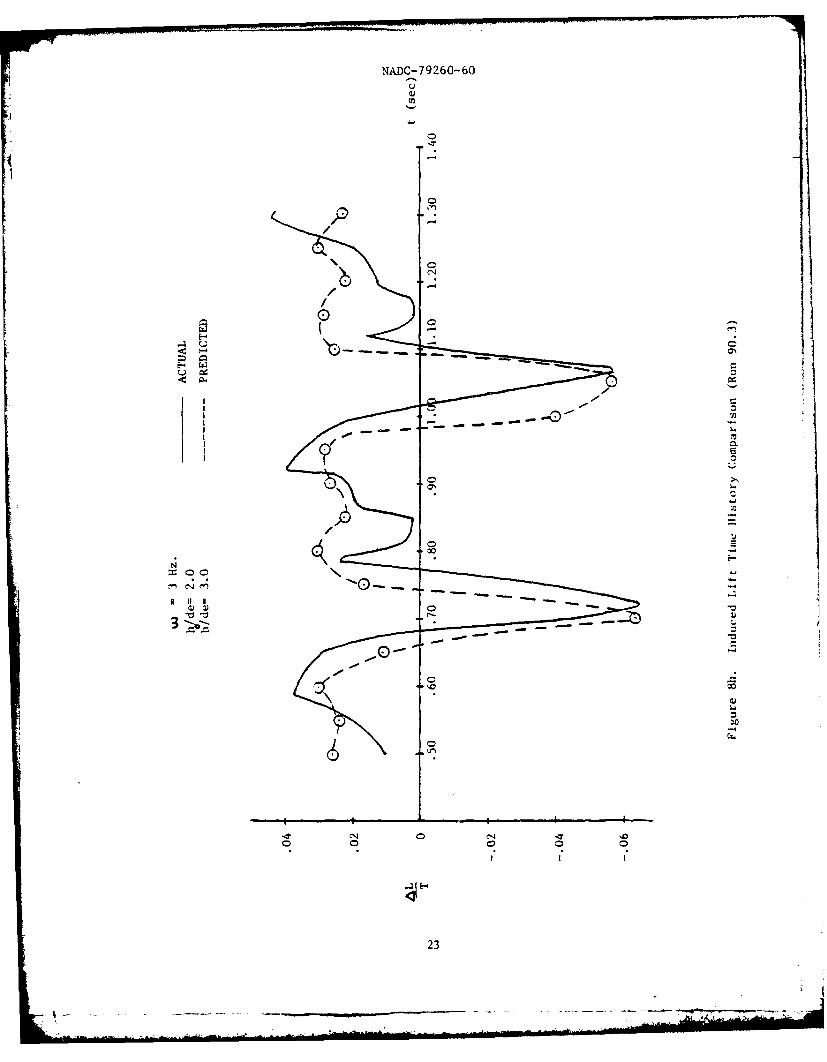
A slight phase shift is evident for frequencies of w - 1 and 3Hz althoughpeak values show fair correlation as indicated in figures 8g and 8h.These data correspond to a neutral point of ho/de = 2.0 and an amplitudeof Ah/de = 3.0 as does the data of figure 8d for a frequency of w = 2Hz.However, no phase shift is evident for this frequency (w = 2Hz) or anyof the other data runs except the two previously mentioned cases (figures 8gand 8h). This indicates that the phaseshift probably resulted from theinability to precisely define the initial time used for plotting thesedata runs.
Several observations can be summarized with regard to the heavingmotion results described above. First, a hysteresis effect is evidentdependent upon the direction of the motion. For a positive deck rate, alarger value of AL/T is evident as compared to a negative rate with thesame magnitude. Second, developing a curve of induced lift versusheight-above-deck for a zero deck rate to estimate the dynamicresponse correlates reasonably well. Third, increasing the amplitudefrom 1.0 to 3.0 showed an increase in suckdown of nearly 7.0% indicatingthat amplitude can have a large effect. Fourth, frequency showed only asmall increase in suckdown for a given amplitude and neutral point.Fifth, a slight phase shift was evident for frequencies of w = I and 3Hzat a neutral point of ho/de = 2.0 and is attributed to the difficulty inprecisely identifying an initial time for plotting these data runs.
PITCH
For the pitching deck motion, the induced pitching moment is theparameter examined. Figures 9 through 12 show induced pitching moment(AM/TE) plotted versus pitch angle (9) for w = 2Hz at various heightsand amplitudes. Positive and negative rates (9) are shown on thesefigures by open and closed symbols respectively, along with the statictest data indicated by the solid line. The effect of frequency couldnot be determined from the available data since only w = 2Hz was tested.
At an h/de - 0.8, figure 9 shows significantly larger negativevalues of pitching moment for the dynamic data where the magnitude isapproximately twice the static value. For NG - 40 a small hysteresiseffect is present while AG = 12* does not show this effect. The mostpronounced hysteresis effect is shown for the case of AO - 200 wheredifferences between positive and negative rates are as much as 2.0%. Itis interesting to note that for negative pitch angles the positive rates
21

NAD ,-79260&%O
EJ-
06.
00
0
o0
IT C14
C!-
E0
220
NADC-79260-60
00
pqC4I/E
23

NADC-79260-60
(D
* K:,000
>x 10 0 0
I0 4
t0r
,-I
C4.
00-4
0 0 0 0 0cc.
w
Go
24
- . ., --- - -},,8V -
NADC-79260-60
show a more positive value while the reverse is true f or positive pitchangles. Increasing amplitude does not show a significant effect on thepitching moment for this h/de as the data falls within a snall band forthe three amplitudes shown.
Figure 10 shows the induced pitching moment at h/de - 2.0 for thethree amplitudes of 40, 128, and 200. As expected, the hysteresiseffect is very pronounced since the fountain is the strongest at thisheight. At AG 40 positive rates show more positive values over allpitch angles than do the negative rates. The reverse is true for amplitudesof 12* and 20* with differences as much as 4.0 AM/TE- evident. For thisheight the static data shows a significant increase over the values ath/de = 0.8 where all values shown are negative. The dynamic data alsoshows an increase on the order of 3.0% as the height is increased from0.8 to 2.0 as indicated in figures 9 and 10. It should also be pointedout that for an h/de = 2.0 the static values become positive over almostthe entire range of pitch angles shown.
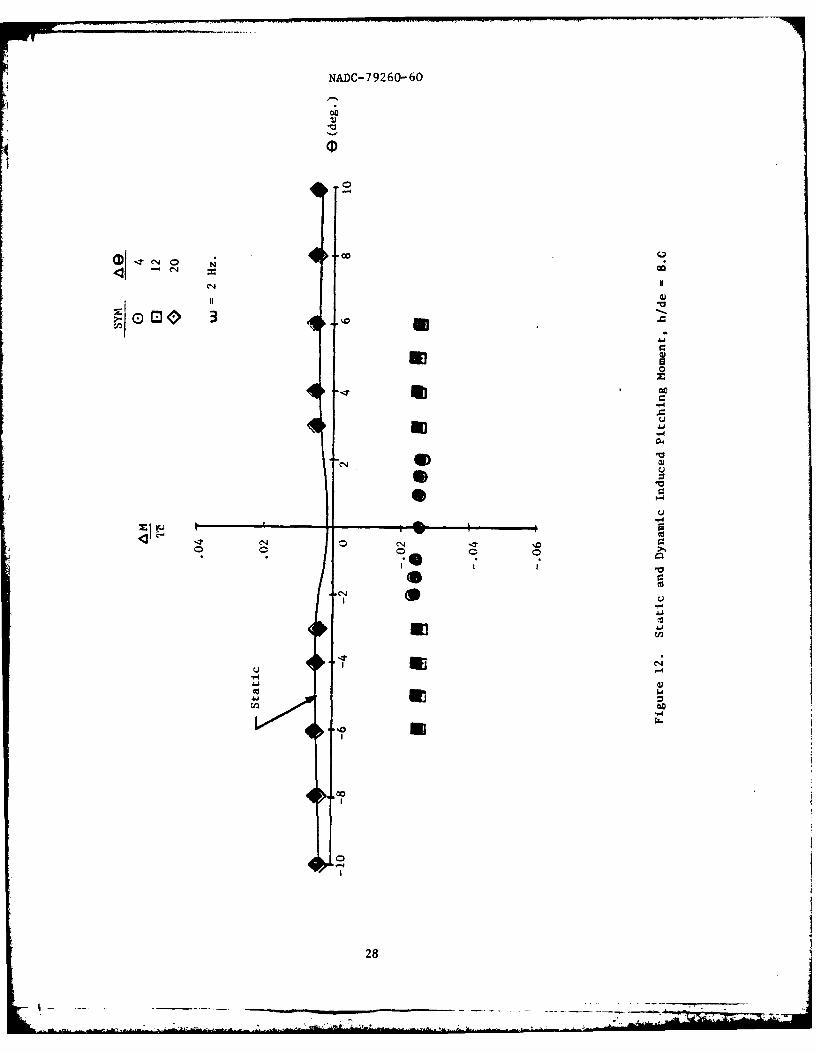
As indicated in figure 11, increasing h/de to 5.0 produces significantchanges in pitching moment. The static data is positive for both positiveand negative pitch angles while the dynamic data shows an unexpectedincrease at AG - 20*. This is also the case for an h/de -8.0 as indicatedin figure 12. At heights of 5.0 and 8.0 the induced pitching momentshould be very small in magnitude and close to the static values sincethe model is essentially out of ground effect. For AG = 40 and 120these data show an almost constant value of -0.025 for induced pitchingmoment. This fact, along with the data for A = 200 being so close tothe static value at both h/de = 5.0 and 8.0 indicates a zero shift inthe data. This shift may also apply to figures 9 and 10 where largedifferences are seen between the static and dynamic responses. In orderto develop a curve for a zero value of pitch rate to estimate the dynamicresponse it is necessary to account for this zero shift. To accomplishthis the response for A - 200 at both h/de - 5.0 and h/de -8.0 wasassumed to fall at a constant level of -0.025 to be consistent with thedata for A = 40 and A = 120. Also, the effect of height must beincluded since significant differences in pitching moment are seen atvarious values of hide. Figure 13 presents the curves developed for thefour values of h/de which were tested. The height effect was accountedfor in this way to show that at lower values of h/de this effect is muchstronger than at the higher values.
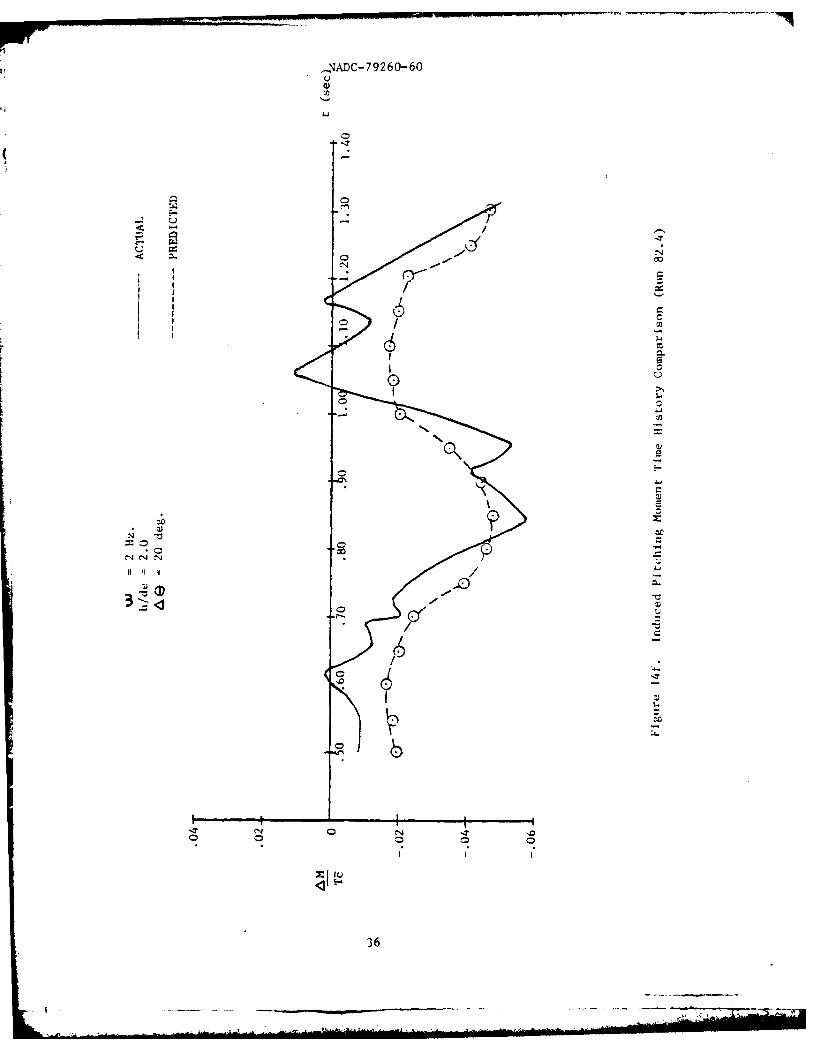
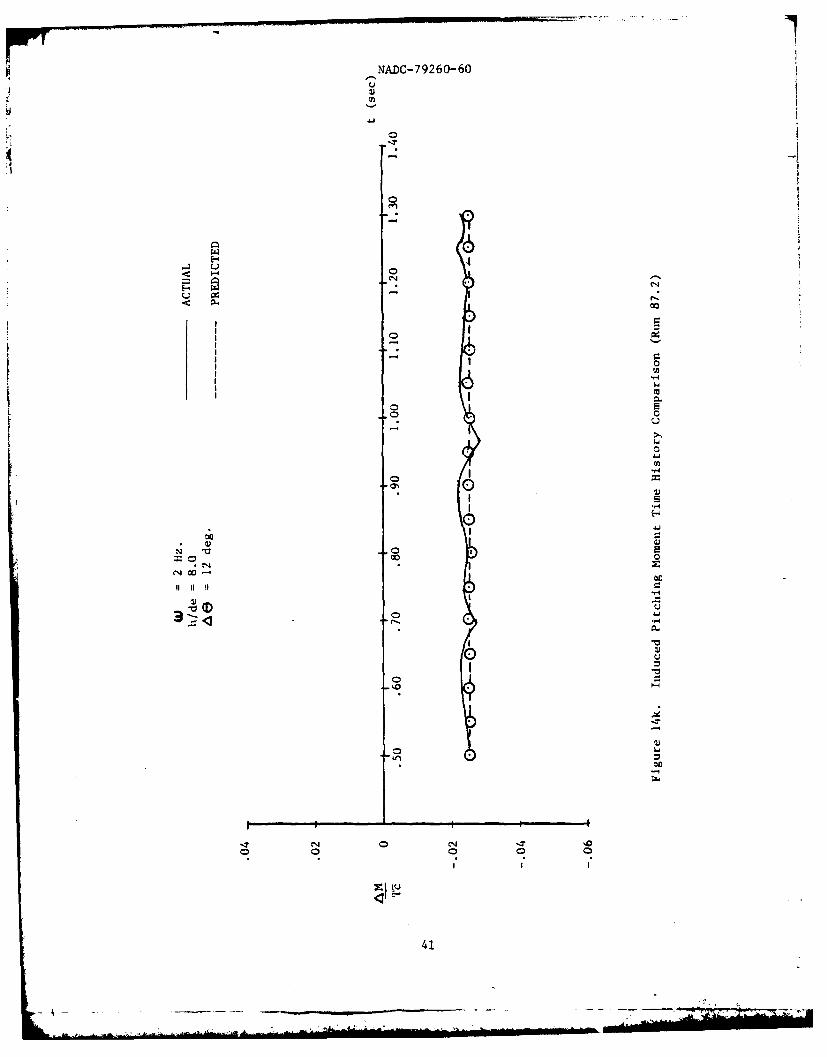
Figure 13 was used to predict the induced pitching moment as afunction of pitch angle and height. These predictions were comparedwith actual time history data and are shown in figures 14a through 141with predicted values indicated by the dotted line.
Figures 14a through 14c present induced pitching moment versus timefor h/de - 0.8 and amplitudes of 4, 12, and 20* respectively. Goodcorrelation is seen between the actual and predicted values for eachamplitude with differences of less than 1.0% AM/TE. As the amplitude isincreased the magnitude of the dynamic response shows larger fluctuationsof induced pitching moment.
25

NADC-79260-60
ID -
C-4
<303
0
Eli
'-4
26
L C'....hi !

NADC-79260-60
3*""
0
ci
'-W
0 'cu
0C 0
04 -H
I ccI
&j
c-4
27
NADC-79260-60
0
loo Q
44
00
S00
I" N I" I
U U
4
.0
*4
00
co4
28
pU
NADlC- 79260-60
00
00
C'4 00
0
low-O-W N.

NADC-79260-60
- 0-
-0 Q 0
- 30

NADC-79260-60
Q cz
i0
0
- 9"
0 I- I
• I
C-4
/ 0
I I UI
31
• _ 2":;; /
II IlI II

NADC-79260-60
00
-c
0
co
' o/ e
C-4'-4
-" 0
o \ u
CN C.4
320
000 //
II i
'0 0

NADC-79260-60
For h/de - 2.0, figures 14d through 14f show induced pitchingmomenit versus time for the three amplitudes tested. A fair correlationis shown between the predicted and actual responses at each amplitude.At N - 40 differences of up to 1.5% are evident while at A9 - 200 anerror of 2.5% can be seen. These figures also show that increasingamplitude has the same effect on induced pitching moment at this h/de asit did at h/de - 0.8, where larger fluctuations in the magnitude of thedynamic response are seen for increasing amplitudes.
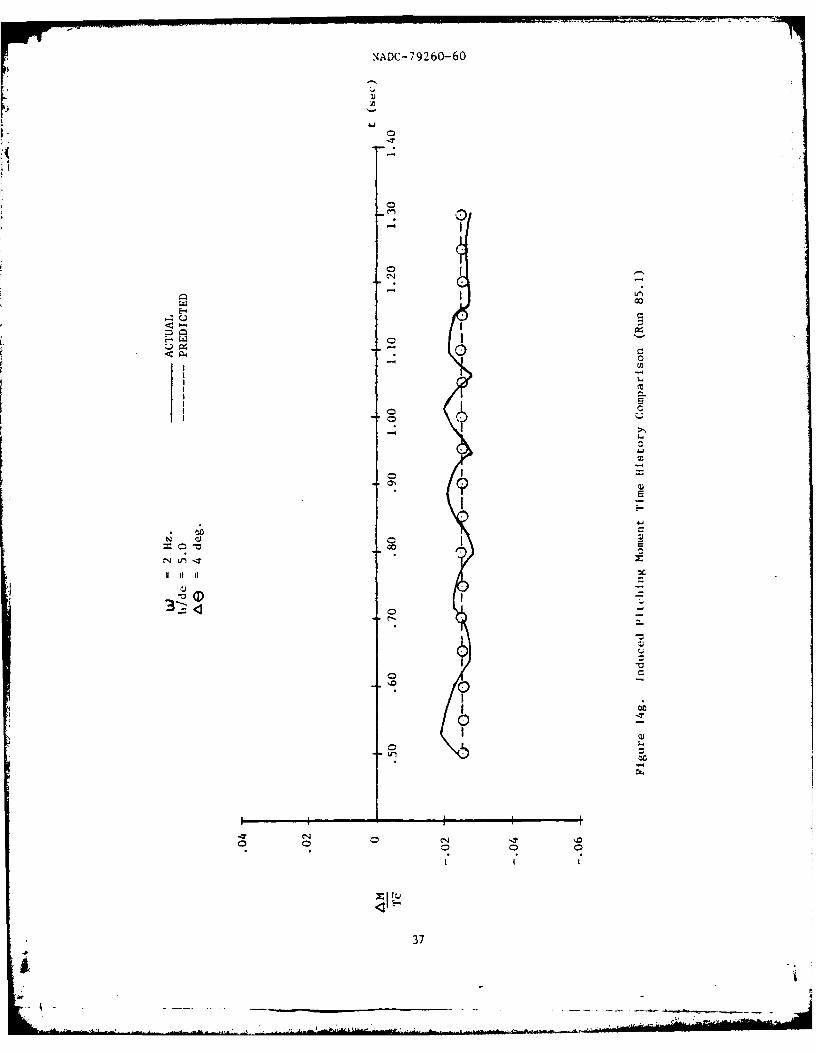
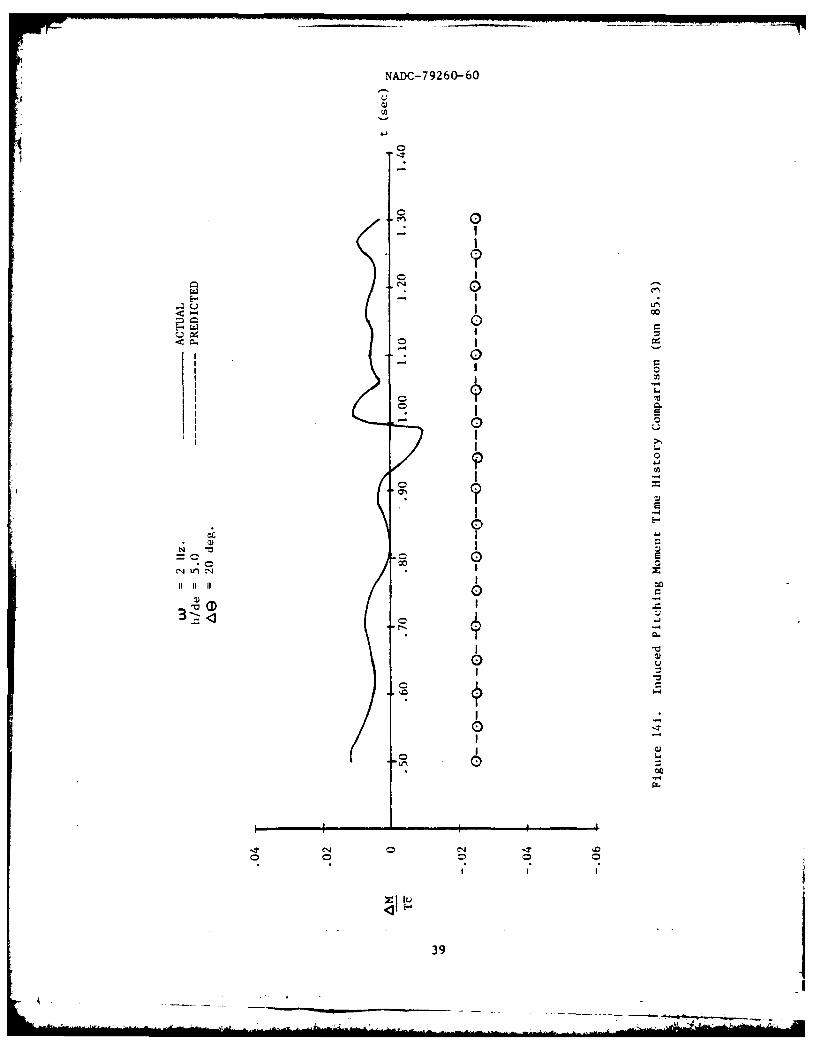
Induced pitching moment versus time for an h/de - 5.0 is shown infigures 14g through 141. The dynamic response at this height should benearly zero since the model is essentially out of ground effect. Figures 14gand 14h show good agreement between predicted and actual values althoughthe magnitudes are on the order of -0.025 AM/T. These values are notzero due to the zero shift which has been previously discussed. Anotherresult of this shift is seen in figure 14i where a poor correlationexists between the predicted and actual values even though the actualresponse is very small as expected.
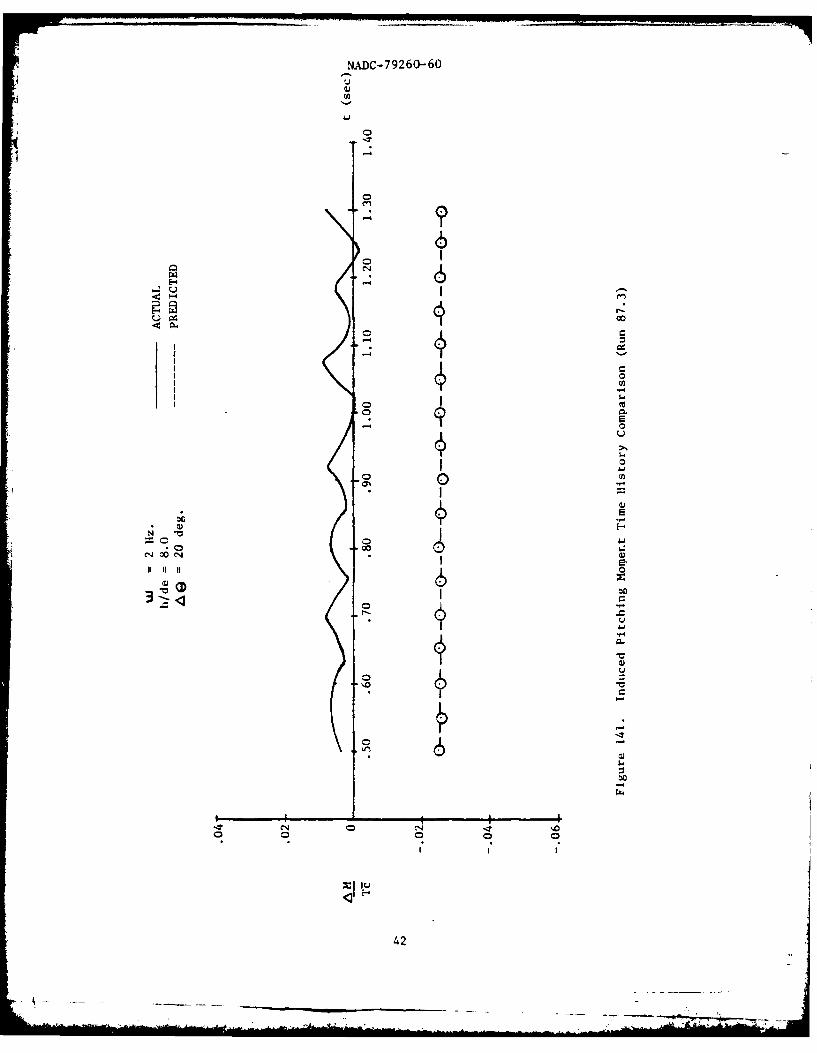
In figures 14j through 141, for an h/de = 8.0, characteristicssimilar to those just discussed for an h/de = 5.0 are present. A goodcorrelation is seen for amplitudes of V and 120 although the magnitudesare again on the order of -0.025 AM/7c-. For AO = 200 (figure 141) apoor correlation is seen even though the magnitude of the actual responseis nearly zero as anticipated.
Several observations can now be summarized with regard to thepitching motion results described above. First, reasonably good correlationis seen between the actual data and the predicted values using a curveof dM/Tc- versus pitch angle for a zero pitch rate. Second, a hysteresiseffect is present in the data which is most pronounced at an h/de - 2.0where the fountain is the strongest. Third, height shows a large effecton AM/T-c at the lower values of h/de, 0.8 and 2.0, while at heightsgreater than 5.0 little or no effect is seen. Fourth, frequency effectscould not be determined from these data since w -2Hz was the onlyfrequency tested. Fifth, increasing the amplitude for a given heightproduces larger fluctuations in the magnitude of the actual response.Sixth, a zero shift is apparent in the data for h/de -5.0 and 8.0 whichcauses large differences between actual and predicted values at anamplitude of N - 200.
ROLL
For the rolling deck motion the parameter examined is the inducedrolling moment, d4fTh. Figures 15 and 16 show induced rolling momentversus roll angle for the various amplitudes, frequencies, and height-above-deck conditions which were tested. The open symbols indicate apositive roll rate ( ), while negative rates are shown as closed symbols.The static data for each figure is indicated by the solid line.
33

NADC-79260-60
C.,,
.. ~~ ~ -.
0 0
34-

NADC-79260-60
C,
0
IJ*
0 co
41"
°- 0
0
o 0.
o A0
,/
CN1
I I - /I
35
,NADC-79260-60
aN
00
100
< E-
N 36
0
-7
o
° I
o C
oQ
oI I I
T E
N .- c
J , t., . -.• .,,1" 0
! ! I
1111111
370
o. ,

NADC-79260-60
p4n
00
,-oo
E-IrW
o
IN 0
00
- 24
o= J
38
NADC-79260-60
0
S- ,
- I
o I
- I
== 0
- I
- °1 ..o -1
I -
o -CQ U
I _-I-,-
I ""
'0
* T

NADC-79260- 6 0
u
U,
C14
00
0
4 I
kQ
400
o ,I
o o
00
.. .... , . .. ' .-, -_
NAD-79260--60
0
C.,d
-I 0
o . 0
-I II
NADC-79260-60
i.n
0
- °
0
.0
6
I
C14i \ o
I -7
,' 0
o 42
om
-r- 0
I=
NN
11110o I 0
0 z
0 -00
I I I
*0
.12

NADC-79260-60
C14~00
VN a.a43*:
0
C-44
0O
U
-l
an
!U
000
43
. -i

NADC-79260-60
C,.,4
*EU 0-4
*1-4
CN,
-i 010 IT C0 C-4 1-fc.
0 El 0-
00
0 0 0
I.
44

NADC-7 92 60-60
Figure 15 shows the variation of induced rolling moment with changesin roll angle (AO) for w =2Hz at an h/de = 0.8. The dynamic data
( differs from the static data for each angular displacement at bothpositive and negative rates as shown. For =0* the static value of 4t/Tbis zero while the dynamic value shows a shift of about 0.15%. Bothstatic and dynamic data appear fairly symmetric about 0 - 00 as expectedfor this motion. Varying & from 4V through 200 does not show a largeeffect on rolling moment as indicated. The data for AO 40, 12*, and20* fall within a relatively small band similar in shape to the staticcurve but shifted up 0.15% for both positive and negative roll angles.Although there are differences in rolling moment for positive and negativerates, these differences are small in magnitude. A small hysteresiseffect is present in this figure, but is not a pronounced effect at thishide. For h/de -2.0 and AO = 30*, as shown in figure 16, the hysteresiseffect is very pronounced at both frequencies indicated. It should benoted that for w - 2Hz the negative rates indicated by the closed symbolsshow a higher value of induced rolling moment than do the positiverates. This is true except at the extreme roll angles where a slightreversal is indicated. For w = 3Hz the opposite trend is indicatedwhere the positive rates show a higher rolling moment than do the negativerates. The difference in magnitude for positive and negative rates atthis h/de is much larger than for an h/de = 0.8. This is due to thefact that for this configuration the fountain is strongest at an h/de =2.0and therefore the largest variations should be seen at this height. Theresults for pitching moment also shoved the largest variation at anh/de = 2.0, although the overall magnitudes are on the order of +0.35%which is very small.
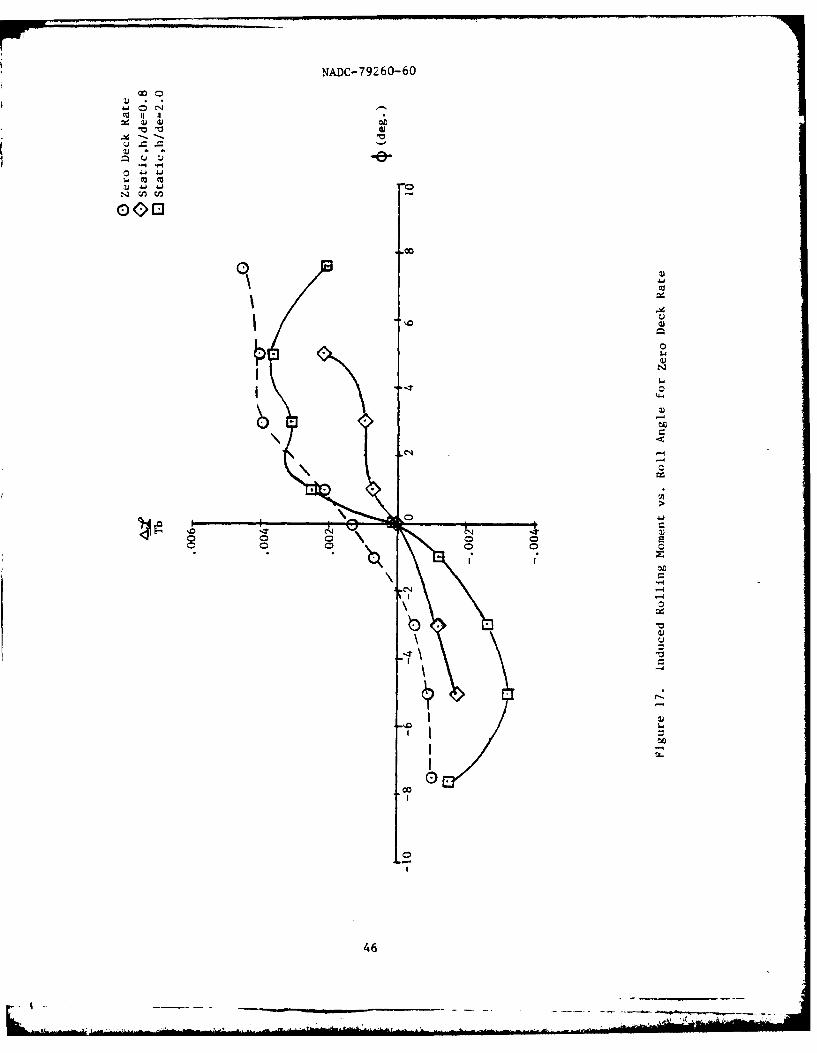
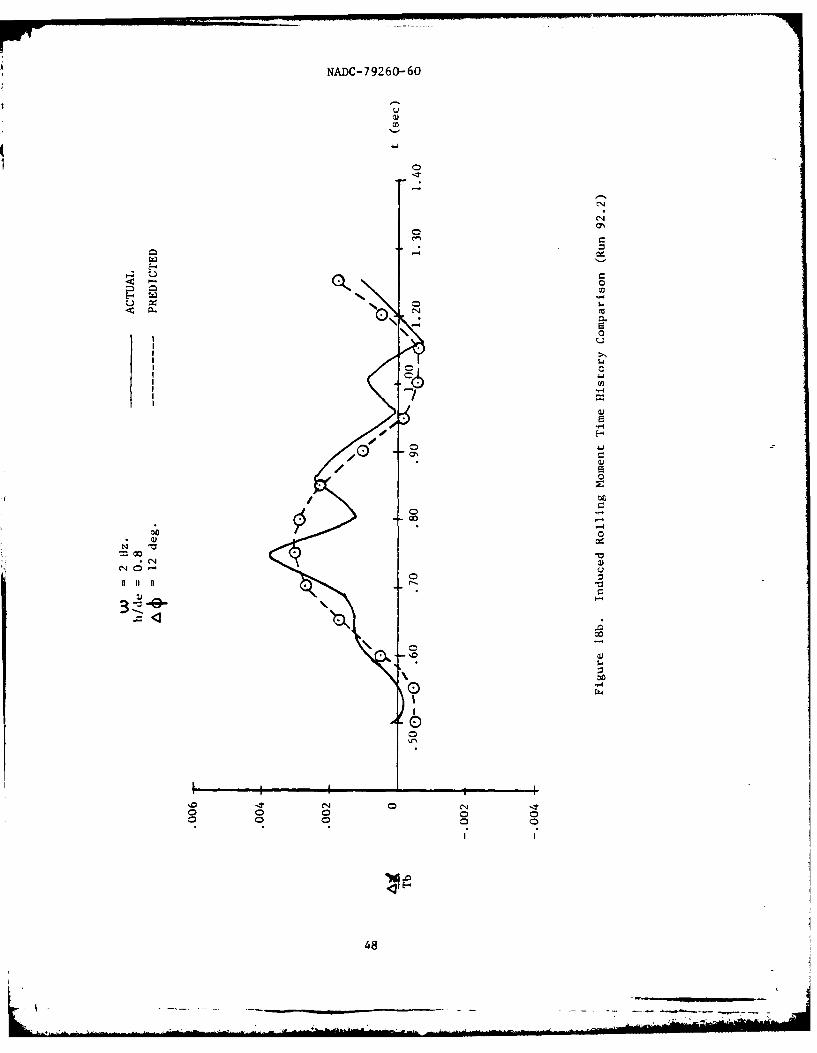
By combining figures 15 and 16 for rolling moment at the variousamplitudes, frequencies, and heights indicated, a curve of inducedrolling moment versus roll angle was obtained corresponding to a Zerovalue of deck roll rate. Figure 17 shows this curve indicated by thedotted line along with the static test data for both h/de = 0.8 and 2.0.As indicated in this figure the dotted curve does not pass through theorigin. For this rolling motion a symmetry about the origin was expectedas shown for the static data, but a shift of about 0.15% is indicated.This shift was investigated and the probable cause is a bias in settingthe neutral point statically and dynamically. Assuming this shift isdue to measurement error, the zero curve can be lowered 0. 15% to passthrough the origin and compared to the static data at h/de -0.8 and2.0. This shifted zero curve was used to predict the rolling moment asa function of roll angle and compared with actual time history data.These comparisons are shown in figures 18a through 18e with predictedvalues indicated by the dotted line. Since the values for rollingmoment are very small the discussion of these figures will focus ontrends and not on percent differences between predicted and actualvalues. It should be noted that the effect of frequency on the inducedrolling moment at this h/de cannot be determined since only one frequencywas tested.
Figures 18a through 18c show induced rolling moment versus time forw 2Hz, h/de =0.8, and at amplitudes of 40, 120 and 200. The predicted
45
NADC-79260--60
II ii*.0 -4-
w w
(OD~
I '0o0
I0
IN
00
46
--- "

NADC-79260-60
0
0 LU
co
00
1-4
0!
I
II
47
- .. _- . . .. . . . . .- -L _ _j --N" -- ,
NADC-79260-60
C1
ot
00
C14N
0..
cli °
C-4,
48
. .g -
NADC-79260-60
(.2
o CN
'-4
L)
- o
I •-I -,
b z"
09
=. ". .. . . . .. . . . . ' ... ... ':... .. i lll nnnm /I m II II/INIIII1

NADC-79260-60
values correlate reasonably well with the actual response for eachamplitude. As the amplitude is increased from 40 to 12* the positivepeak values show a large increase while negative peak values remainfairly constant. A further increase from 120 to 200 only shows anincrease in negative peak value.
Figures 18d and 18e show induced lift for h/de = 2.0, AO - 3Q0, andfor two frequencies (w = 2 and 3Hz). In both cases a slight time shiftseems apparent, however this shift is attributed to the difficulty inprecisely identifying an initial time used to plot the time history.Peak values correspond well with the actual data and frequency changesshow little or no effect on rolling moment. Although the fountain isthe strongest at h/de =2.0, no appreciable difference in magnitude isseen between the response at h/de = 0.8, 60 = 200 and at h/de - 2.0,A= 30*. Based on this limited data base, height does not seem to have
a large effect on induced rolling moment.
Several observations can be summarized in regard to the rollingdeck motion results described above. First, the magnitude of the responsefor any of the conditions tested is very small (less than 0.5%). Second,the dynamic response showed a shift of approximately 0.15% above thestatic data and is attributed to a bias in setting the neutral point.Third, based on the limited amount of data available, frequency andheight do not appear to have a large effect on induced rolling moment.Fourth, an increase in amplitude does not have a large effect for thevarious amplitudes, frequencies, and heights which were tested. Fifth,a slight time shift was observed in several of the figures and is attributedto the difficulty in identifying precisely an initial time from thedata.
C0 NC LU S 10 NS A ND R ECOM ME N DA TIO N S
Transient induced aerodynamic data for a 3-fan subsonic VSTOL modeloperating in a moving deck environment have been analyzed in terms ofsingle axis deck motions. These include heaving, pitching, and rollingmotions only. Combined deck motions, such as heave and pitch, were notconsidered for this first correlation analysis due to the added complexitythat they introduce.
A method has been developed to predict the dynamic response ofinduced forces and moments based upon a zero value of deck rate for eachmotion. In general, good correlation is seen between the actual andpredicted values. The following represent the more pertinent conclusionswhich have been reached as a result of this analysis.
HEAVE
0 A hystersis effect is present for this motion where the inducedlift loss, AL/T, is greater for the deck heaving away from the model ascompared to the deck heaving towards the model.
50

NADC-7 9260-60
U
-4
oC4 '0
0 -4
0
E-e 0o
~-45.4Cu0.00
5-.04-I
-4z
0 -,-4
4-I0
00
0
0-4-4
N 0 0
II II IIw 0
-o0-4
*0
5.4
I I'0 -~ c.,J 0 C4 -~o o o 0 0o 0 0 0 0
I I
51
-- 4 - - ---. - ----------. ~----------------- - - - ------

NADC-7926060
00
oc
4 52

NADC-79260-60
0 For a given amplitude and neutral point, frequency did nothave a large effect on the induced lift.
0 Increasing the amplitude increased significantly the suckdowneffect. As much as 7.0% suckdown was seen for an increase of amplitudefrom 1.0 to 3.0 h/de.
* Predictions of transient lift variations based on a quasi-static (zero deck rate) assumption correlate within about 1.5% ofactual test results.
PITCH
* Height has a significant effect on induced pitching moment atlower values of h/de. At values of h/de = 5.0 and 8.0, height effectsbecome negligible because the model is out of ground effect.
* A hysteresis is present and most noticeable at h/de - 2.0where the fountain is the strongest.
* Frequency effects could not be determined because of thelimited data available.
* Increasing the amplitude of the sinusoidal motion increasesthe magnitude of the actual response by up to 1.5% tM/T-.
0 For h/de = 5.0 and 8.0 a zero shift is apparent in the dataand is on the order of about -0.025 AM/Ttr.
ROLL
* The magnitude of induced rolling moment for any of the heights,amplitudes, and frequencies tested was less than 0.5%.
* A shift of approximately 0.15% was observed between the dynamicresponse and the static data at both heights tested due to a bias insetting the neutral point (0o).
* Amplitude did not have a large effect on induced rollingmoment for any of the conditions tested.
* Frequency did not have a significant effect on the inducedrolling moment based on the limited amount of data available.
These conclusions show that a moving deck can produce substantial changesin induced lift and pitching moment for this configuration. The majorcontribution for heaving motion is the amplitude where as much as a 7.0%difference in induced lift was seen for two different values of Ah/de.In the case of pitching motion, the driving factor is height over deckwith a 3.0% difference in pitching moment evident between an h/de - 0.8and 2.0. This 3.0% difference can be important to a pilot in hover whois trying to maintain trim.
53
NADC-79260-60
This analysis has shown that a quasi-static curve, as developed
for each deck motion described, can provide a reasonable estimate of
the dynamic response. As more data becomes available it is recomended
that this approach be modified as required to improve estimation accuracy
at the preliminary design stage.
It is also recommended that the data of reference (a) for the
supersonic configuration be examined in a similar manner to facilitate acomparison of the subsonic and supersonic configurations. This comparisonwould be especially valuable since the supersonic configuration isdominated by suckdown and the subsonic configuration is more fountaindominated.
REFERENCES
(a) Kamman, J. H., and Hall, C. L., "Lift System Induced Aerodynamicsof V/STOL Aircraft in a Moving Deck Environment", NADC-77-107-30,29 Sep 1978.
(b) Caddy, M. J., "TIGS-An Interactive Graphical System for the Creationand Correction of Tabular Data Sets", NADC-78229-60, unpublished.
(c) Caddy, M. J., "TREAD/TLOOK-Multipurpose Computer Routine for Inter-polation and Extrapolation of Tabular Data", NADC-76366-30, 11 Jan 1977.
54
NADC-79260-60
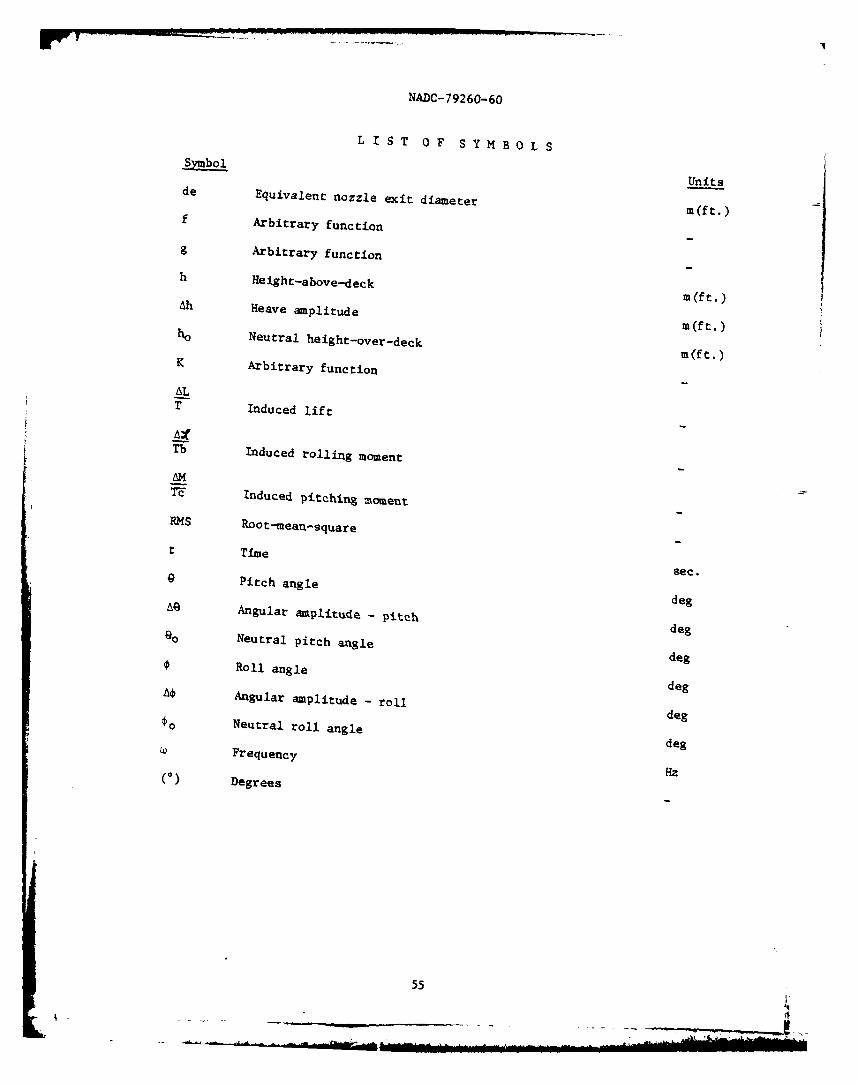
LIST OF SYMBOLS
S Unitsde Equivalent nozzle exit diameter
m(ft.)f Arbitrary function
f Arbitrary functionh Height-above-deck
m(ft.)Ah Heave amplitude
w(fr.)Neutral height-over-deck
M(ft.)K Arbitrary function
T Induced lift
Th Induced rolling moment
AM
TF Induced pitching moment
RMS Root-mean-square
t Time sec.
0 Pitch angledegA0 Angular amplitude - pitch deg
o Neutral pitch angledegRoll angle deg
Angular amplitude - roll deg
o Neutral roll angledegFrequency
Hz(0) Degrees
55

4ADC-79260-60
APPENDIX A
GOVERNING EQUATIONS AND COMPUTER PROGRAMS
A-i

NADC-79260-60
A P P E N D I X A
This appendix outlines the formulation of the governing equationsfor sinusoidal deck motions. The reduction of the reference (a) datainto a form suitable for analysis as well as the computer program developedto analyze the data will also be discussed.
GOVERNING EQUATIONS
In the heaving direction, induced lift was assumed to be a functionof deck position and rate,
AL
T- fl(h) + fh) (1)
Since the deck motion is sinusoidal, the position of the aircraftat any time (t) can be obtained by the neutral point plus a value determinedby the sinusoidal motion. This can be written in equation form asfollows:
h-ho +Ah sin (wt) (2)
2
The equivalent nozzle jet exit diameter, de, was used to nondimensionalizeequation (2) in order to be consistent with the data of reference (a),
h = ho (des (2a)de - 2 s (t)
Using equation (2a) the deck rate was computed as a function of frequency,amplitude, and neutral point which are the parameters varied in thereference (a) data. Differentiating with respect to time yields,
(3)de 2T cos (Wt)
Rewriting equation (2a),
/h ho
sin (wt) - 2 kTe - - (4)Ah
dethe equation for deck rate is obtained and can be written in the followingform,
2 (2 (5)
A-3
NADC-79260-60
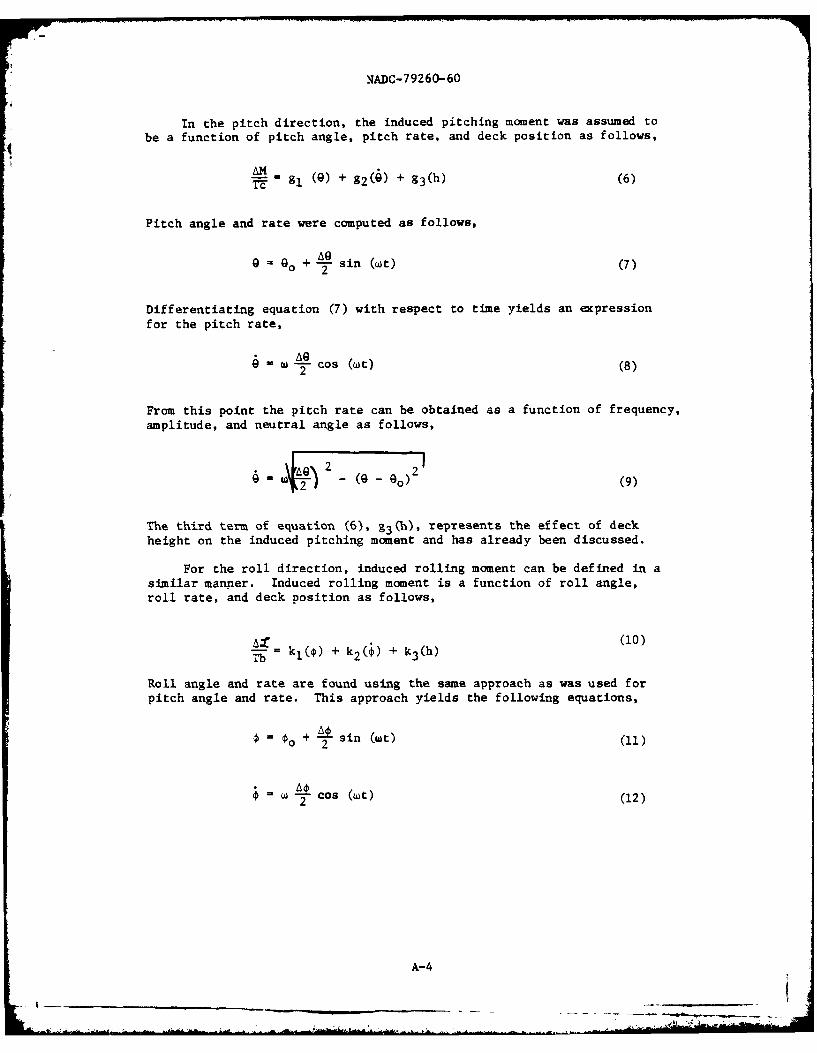
In the pitch direction, the induced pitching moment was assumed to
be a function of pitch angle, pitch rate, and deck position as follows,
AM
Tc= g1 ( ) + g2 (4) + g3 (h) (6)
Pitch angle and rate were computed as follows,
0 = go + sin (wt) (7)
Differentiating equation (7) with respect to time yields an expression
for the pitch rate,
4 - cos (Wt) (8)2
From this point the pitch rate can be obtained as a function of frequency,amplitude, and neutral angle as follows,
.AQ\- 2 29= ~j - (e--e0o (9)
The third term of equation (6), g3 (h), represents the effect of deck
height on the induced pitching moment and has already been discussed.
For the roll direction, induced rolling moment can be defined in a
similar manner. Induced rolling moment is a function of roll angle,roll rate, and deck position as follows,
(10)= kl(O) + k26 ) + k3 (h)
Roll angle and rate are found using the same approach as was used forpitch angle and rate. This approach yields the following equations,
0f - o + A sin (wt)2 (11)
$ W A - Cos (WO)2 (12)
A-4
I-
NADC-7 9260-60
(~~~ Fl~2 - 2
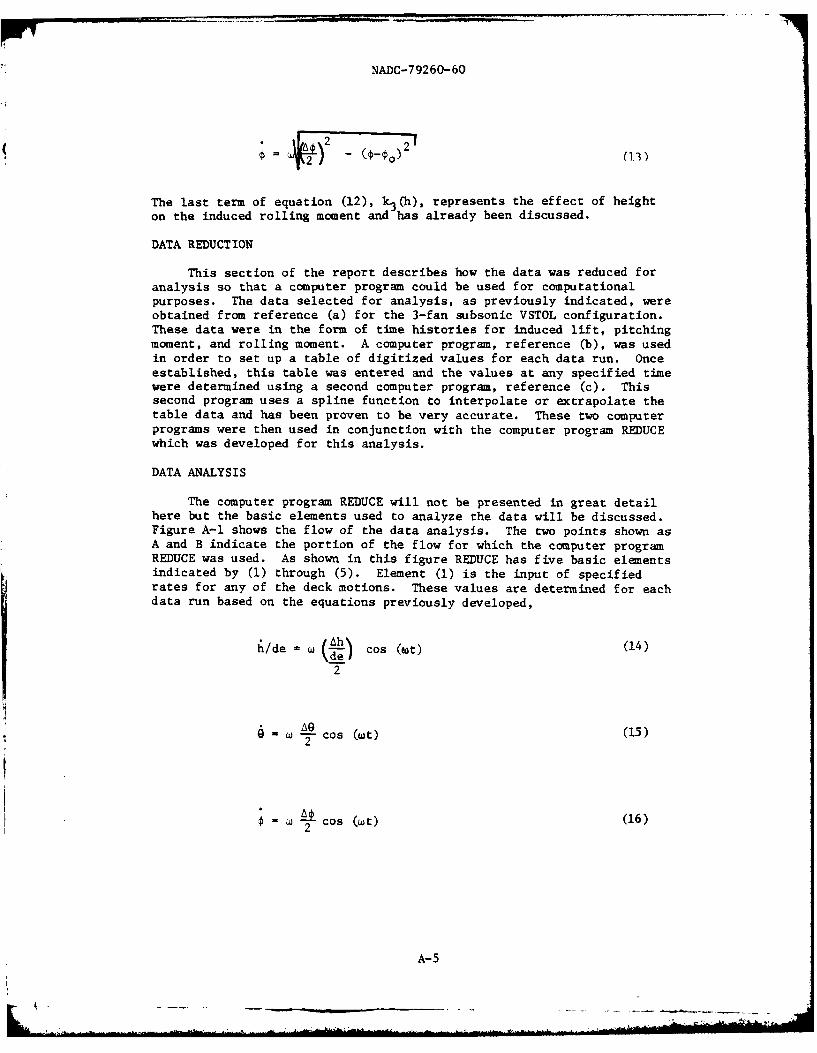
The last term of equation (12), k 3(h), represents the effect of height
on the induced rolling moment and has already been discussed.
DATA REDUCTION
This section of the report describes how the data was reduced foranalysis so that a computer program could be used for computationalpurposes. The data selected for analysis, as previously indicated, wereobtained from reference (a) for the 3-fan subsonic VSTOL configuration.These data were in the form of time histories for induced lift, pitchingmoment, and rolling moment. A computer program, reference (b), was usedin order to set up a table of digitized values for each data run. Onceestablished, this table was entered and the values at any specified timewere determined using a second computer program, reference (c). Thissecond program uses a spline function to interpolate or extrapolate thetable data and has been proven to be very accurate. These two computerprograms were then used in conjunction with the computer program REDUCEwhich was developed for this analysis.
DATA ANALYSIS
The computer program REDUCE will not be presented in great detailhere but the basic elements used to analyze the data will be discussed.Figure A-1 shows the flow of the data analysis. The two points shown asA and B indicate the portion of the flow for which the computer programREDUCE was used. As shown in this figure REDUCE has five basic elementsindicated by (1) through (5). Element (1) is the input of specifiedrates for any of the deck motions. These values are determined for eachdata run based on the equations previously developed,
hide -w (ALh ) Cos (Wat) (14)
w A w cos (wt) (15)2
=W 2t Cos (Wt) (6
A-5

NADC-79260-60
A
INPUT(1) RATES
(2) COMIPUTE tj
(3) MUE~ 4LI(4)COPUE POZO(5)1 INDUCED FORE OMOENT
B
PLOT INDUUCD FORCE OR MOMENT
VERSUS POSITIONRATE
Figure A-I. Data Analysis Flow Chart
A-6
' -- ' > 7;
NADC-79260-60
The maximum positive and negative rate values are readily obtained fromthese equations since the cosine has a maximum of +1 and the frequency
( and amplitudes are known.
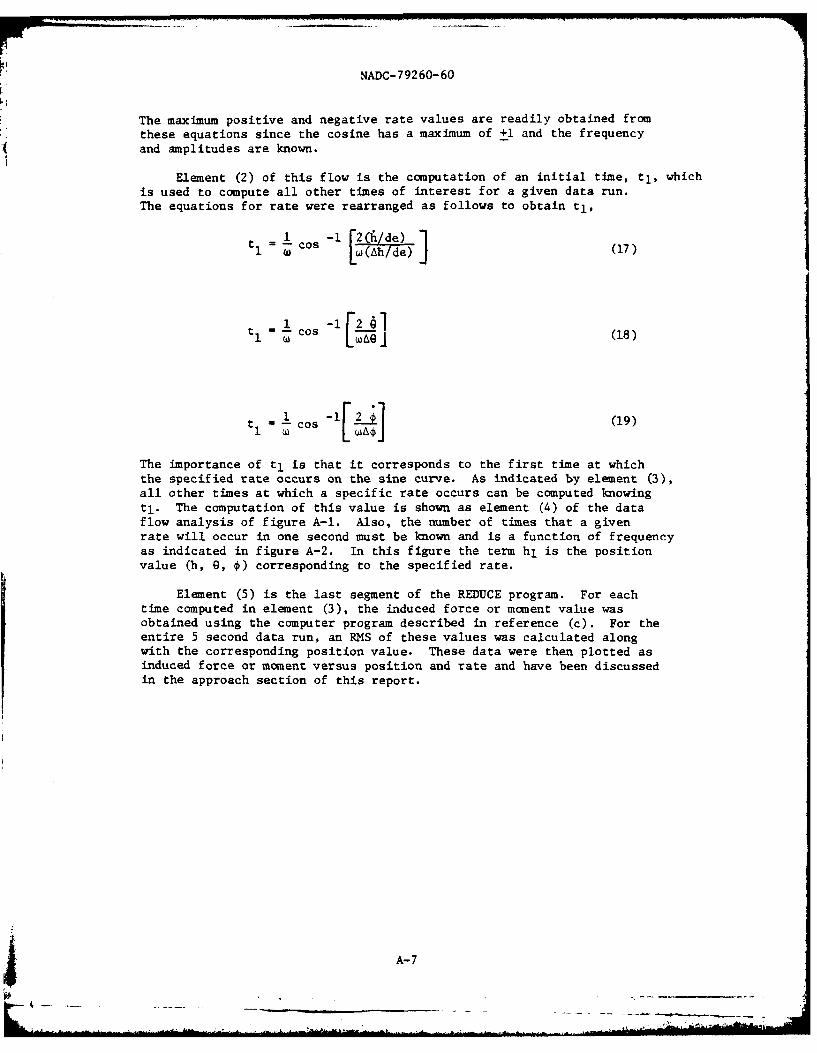
Element (2) of this flow is the computation of an initial time, tl, whichis used to compute all other times of interest for a given data run.The equations for rate were rearranged as follows to obtain tl,
1 o -1 2(fi/de)1I0 Lw(Ah/de) J (17)
=1 -1F[291 -Cos 64a1 (18)
t - [os-1 ] (19)
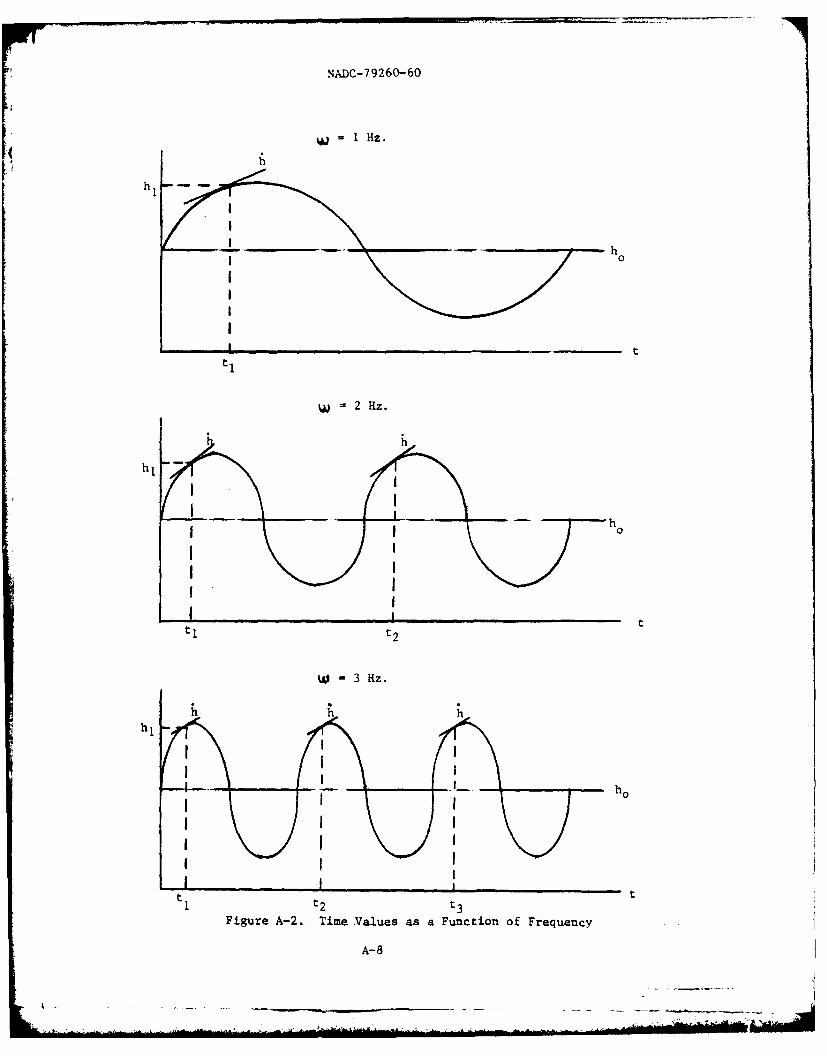
The importance of t1 is that it corresponds to the first time at whichthe specified rate occurs on the sine curve. As indicated by element (3),all other times at which a specific rate occurs can be computed knowingtl. The computation of this value is shown as element (4) of the dataflow analysis of figure A-1. Also, the number of times that a givenrate will occur in one second must be known and is a function of frequencyas indicated in figure A-2. In this figure the term hl is the positionvalue (h, 0, 0) corresponding to the specified rate.
Element (5) is the last segment of the REDUCE program. For eachtime computed in element (3), the induced force or moment value wasobtained using the computer program described in reference (c). For theentire 5 second data run, an RMS of these values was calculated alongwith the corresponding position value. These data were then plotted asinduced force or moment versus position and rate and have been discussedin the approach section of this report.
A ~ ~A- 7___
NADC-79260-60
=1 Hz.
hh
0
ti
w=2 Hz.
I I
h 0
t t2t
Figure A-2. Time Values as a Function of Frequency
A-8

NADC-79260-60
APPENDIX B
SUBSONIC HEAVING MOTION DATA
B-i
mom~ --

NADC-79260-60 RUd NO.DATA PT. S CFN9 COWZ'.,ig(g.)
H/D e , 0.8 h/D e 0.3 fh 2 Hz C " 00 " 00
3.6 - - -
h/De =0
.8 i - - -
INDUCED ILIFT.
CFNS
x 10"1 a-
--°
TIM
-1. -
.-.
* 50 1000 160 ae Z 00 3. 3500 4000 456 SeTIME. t x 10- (SEC)
r IrE
Figure B-I. Subsonic Heaving Motion Data (Run 89.2)
RUN NO.DAITA P1.3 CFNS CONFZG. 81( .5)
H/O0e = 2.0 h/D.j - +0.5 fh = 2z = O y=O
. 4- - - -- - - -
h/Dje = 0
LIFTS.8-
CFNS/
- - -i -
-1 .0*----------------------
0 60 ieee iso. a=ee ase 36 350011(i-3 TIME. t x 10"3 (SEC)
Figure B-2. Subsonic Heaving Motion Data (Run 90,5)
B-3

NADC-79260-60
I DATA PT.I CFNI COWIVG.x 19.4)10- 1 CFNS1.0-
.8
h/Dje 0
II
-. 2' -"
e e 0 Io 16" W" 9e 3"Q 3640 40" 460 64e1 - 3 SEC
TIME
Figure B-3. Subsonic Heaving Motion Data (Run 90.4)
1-1 C DATA PT.i cFPIS COIFZG. s1(90.2)
1±.6-
2.0- - -
S$0 10e 1500 0"0 3600 3000 3600 4000 4500 So019-3 SEC
TIME
Figure B-4. Subsonic Heaving Motion Data (Run 90.2)
B-4
I - __ _- -i-
NADC-7 92 60-60
DATA PT. 8 CFNS6 COFG.I(4.8)10- CFhtS
1.0---
h/Die 0
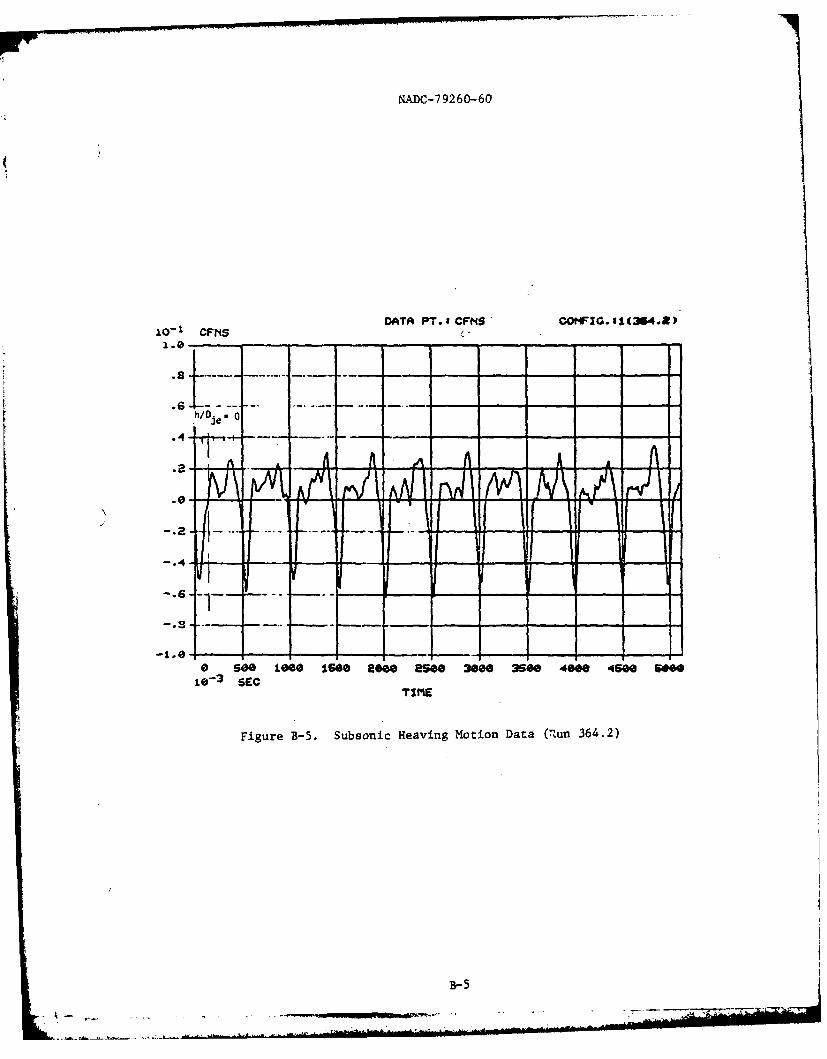
TIEEFigure B-5. Subsoni c Heaving Motion Data (qun 364.2)
B-5

7A NADC-79260-60
APPENDIX C
SUBSONIC PITCHING MOTION DATA
NADC-79260-60 DATA PT.ICFMS COt IG.,1(m. 110 - 1 cPrs
a2 SOO ... -1000 1-0 -O20 00 30 -08 -450 60
.6
.4 --- -- -- - - a -
-. 4 --- - - -t- - --
-1.6
* e ieee is.0 aS; e se0 2500 3000 3500 4000 4600e $00010- 3 SEC
TIME
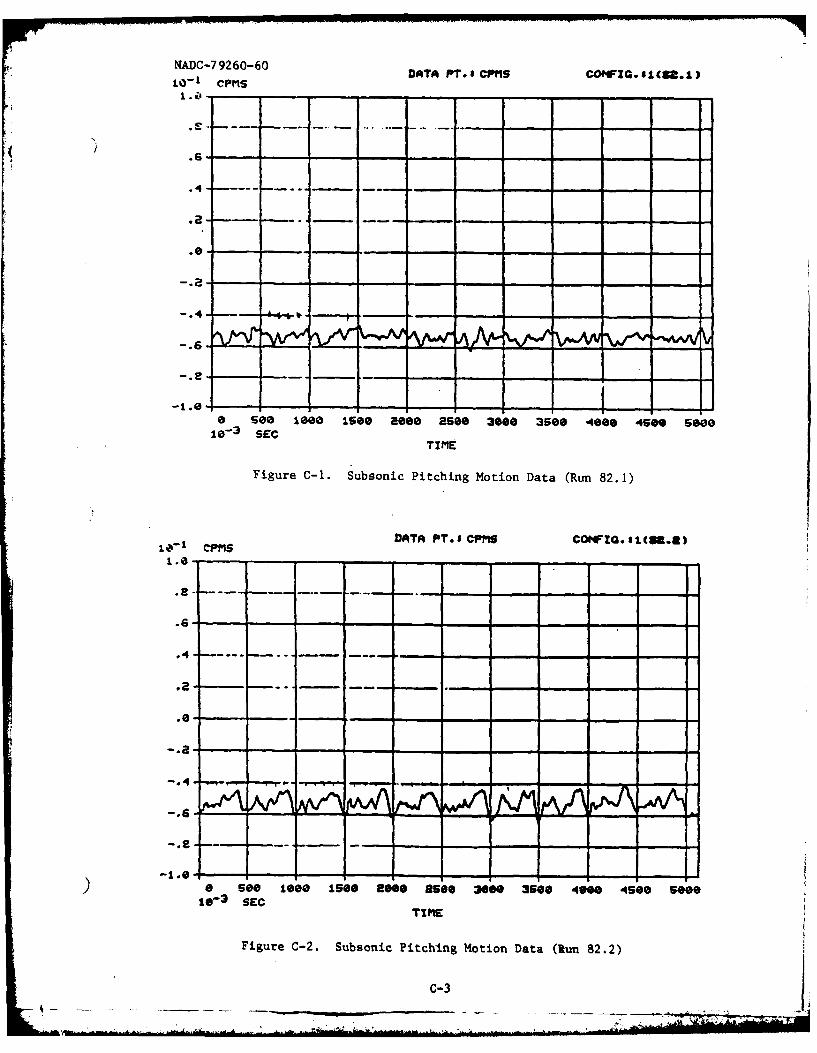
Figure C-1. Subsonic Pitching Motion Data (Run 82.1)
DATA PT. S CPMS CONFG. 1U.a I2e- ' cPriS
.4 ..... ---- a -
.4
-.8
-1 * a
) a see e lse 2000 asee 30" 2500 40 e see see10- 3 SEC
TIME
Figure C-2. Subsonic Pitching Motion Data (tun 82.2)
C-3
~ ~ jsJL..k..t7-

NADC-79260-60
DATA Pr. I CMvi COeIG. #1 (8.3)i,-i CPPS
10 - - - -,- - -
.8* -
.4
v v v
a SeO 10e0 1500 2000 2500 308 50 . ee 4see Seca4~ 00
TIME
Figure C-3. Subsonic Pitching Motion Data (Run 82.3)
DATA PT. I CPM9 COiFIG. $I(=t.a)10 - F CpMq
6.4
3.e-
2.0
1'_. * -- ..... ...--., - - - - -,
AA - .- A - - - - -
--. 0
0 see leee ise eee se 3e00 30 40e 4ee
e E3 CTIM
Figure C-4. Subsonic Pitching Motion Data (Run 82.6)
C-4
az

NADC-79260-60
-DATA PT. ClMO COWIG. I 1(82.5)
-.4.
iA A
0 6601061666 a666 WAG0 3*0 350 4660 460 660010- SEC
TIME
Figure C-5. Subsonic Pitching Motion Data (Run 82,5)
DATA PT. C. "S COWI s I(=. 4)
1 . ' -- - - - - - - - - - - - - - -
-8 -:" ---- i" - - --4 ---.- --.--- --- -- --
.6*
-.42 ,. ,- . -. - .
-.4'
- 6 - - '- --- - -"
-1.0 - - .. - -'- -
0 see ieee 160s6 86 8s6 36 3see 4e00 45ee s600- 3 SECTIME
Figure C-6. Subsonic Pitching Motion Data (Run 82.4)
C-5
NADC-79260-60
DATA PT. I CPS COtIG. I1 (8S. 1)10 - 2 CpqS
4.0-
3.0-
a.e - - .
* .e -- Ar
-3.0-- ---
-4.0
0 Se 1000 1500 2000 RseG 3000 3500 4000 4500 ieee1-3 SEC
TIE
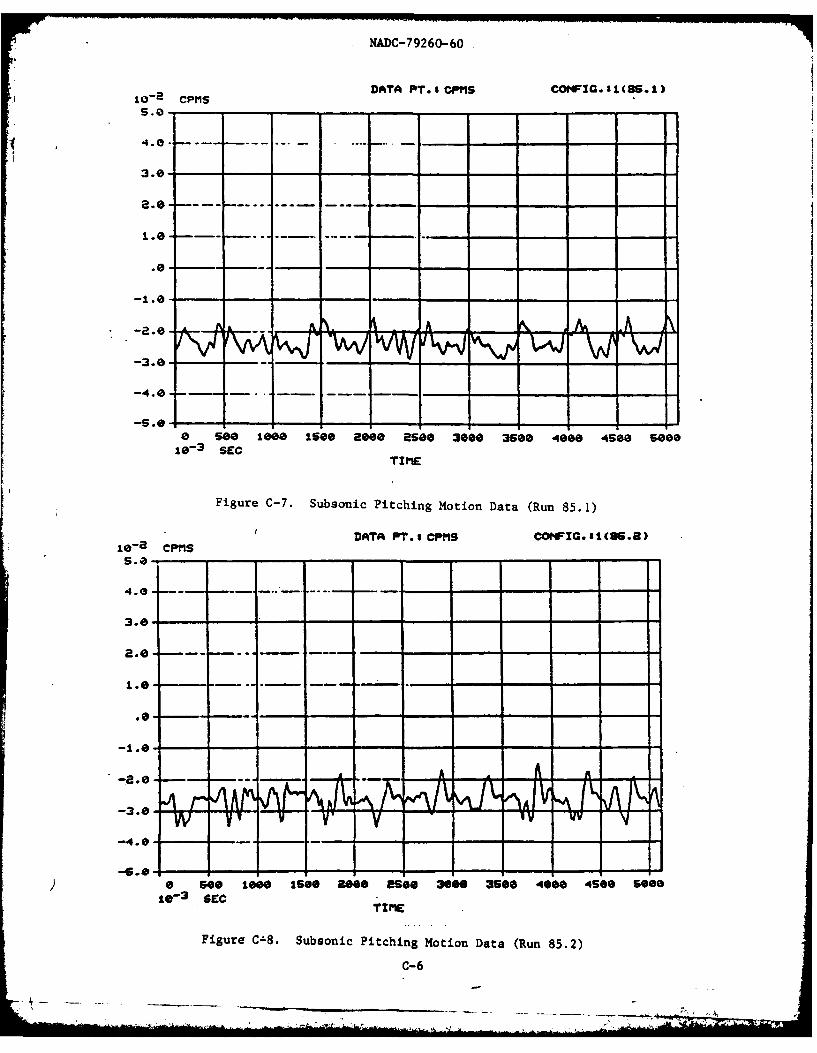
Figure C-7. Subsonic Pitching Motion Data (Run 85.1)
DATA PT. S CPPIS coeF!G.s(S.)le - a CPTqS
3.40-
2.0 -
-4.0 - -
-4.0 -- - - - - - - - -
a "00 1068 Is60 a"'0 3s 300 3500 4068 450 SO01e- 3 SEC
TIME
Figure C'8. Subsonic Pitching Motion Data (Run 85.2)
C-6

NADC-7 9260-60
10-2 CprS DATA PT. I CPMS CONF!G. 8 1 (S.3)
3.0---
-3.0e
a 6"0 1000 ISOO 2000 2560 3080 350" 40" 4500 SO0
i*~ SECTIME
Figure C-9. Subsonic Pitching Motion Data (Run 85.3)
02 p DATA PT. 9CP1S CO4FIG. 1 (27. 1
4.0 -- -"*
3 * 0"- - -- ---
a
-3- SE TIM
Figure C-10. Subsonic Pitching Motion Data (Run 87.1)
C-7
NADC-79260-60
1 oprS DATA iT.s CPftS COWFZG. 8s(67.2)
5.;
3.0
1.e--
.0-
-1.0-
-4.0 -
-5.0- - - - - -- - - -0 600 1000 1500 000o eS0 3000 3500 400 4500 500016-3 SEC
TIME
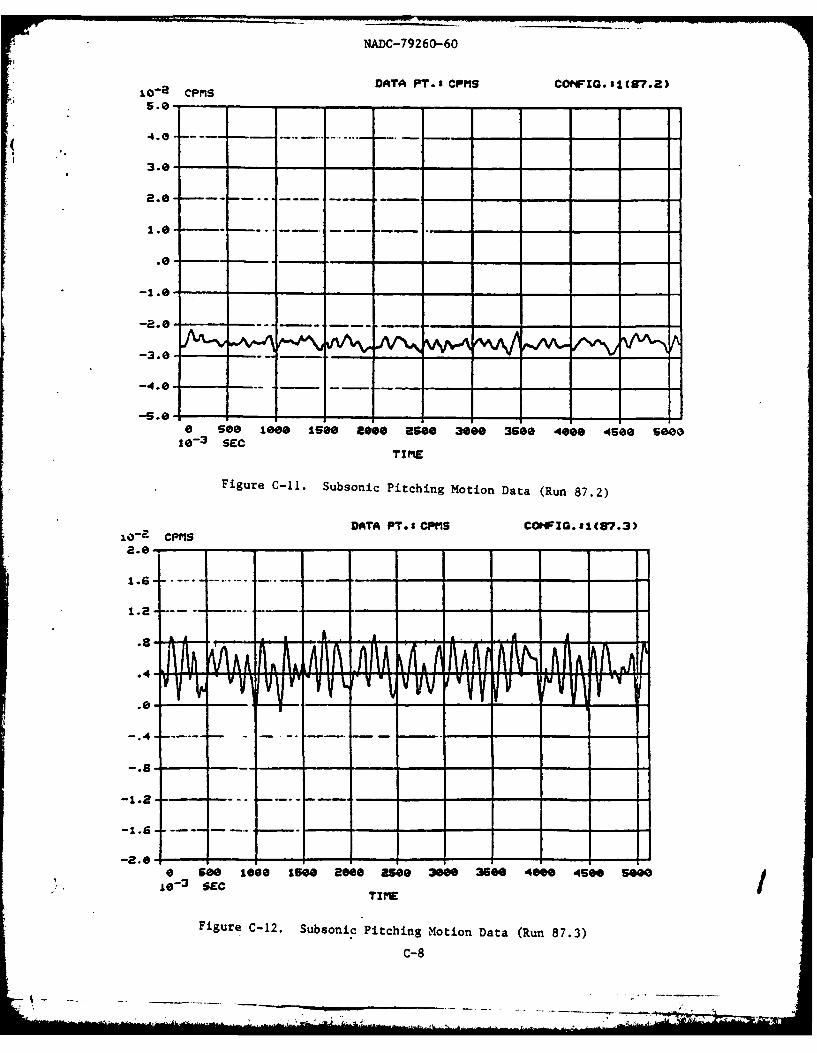
Figure C-I1. Subsonic Pitching Motion Data (Run 87.2)
DATA PT.S CPS COWFIG.s1(87.3)10 -1 CPrIS
1. -
-.4 --.-- " -. - . - --". - - - - - -. .-- - - - - -
-.8 - - - - - - - - - - - - - - - - - - - - \I -
-. 4 L.. A .. .
-it. 0. --a 600 1000 15'" 1000G 2500 3000 3660 4"0 4500 Se0
TIME/
Figure C-12. Subsonic Pitching Motion Data (Run 87.3)c-8
A- e-e - se ,ee -- e ee -se ,-ee 4so -e

NADC-7 9260-60
APPENDIX D
SUBSONIC ROLLING MOTION DATA
Dl-1
NADC-79260-60
DATA PT. s CRMS COFIG SSc92.1)
S.-
( N 4.0 --
3.0 -
?..0 .A I , I IA
1.0 f
-2.0
-3.0
-4;.0 - - - -
0 See 1000 SO 2e00 2Seo 3OO 3500 4000 4500 500810- 3 SE;C
TIME
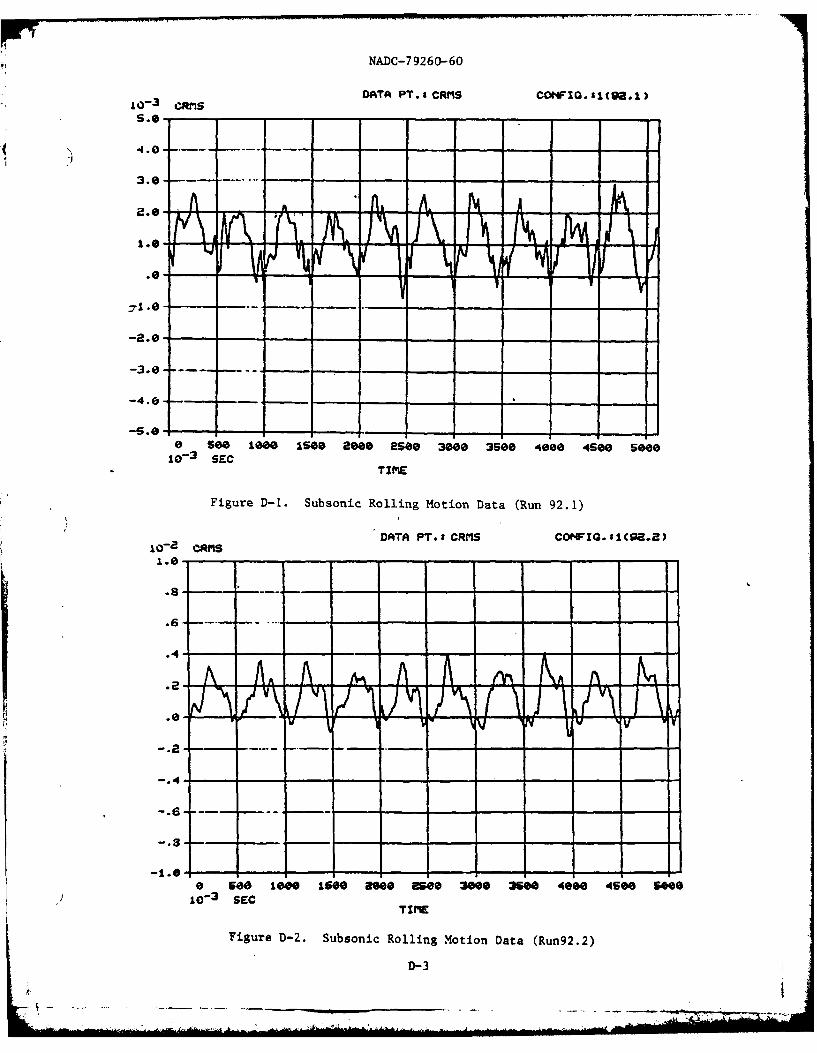
Figure D-1. Subsonic Rolling Motion Data (Run 92.1)
1 DATA PT. # CRMS COFIG. $1(9€.2)
AA- A A to Nt skl.2
.0
1 0- 3 SEC T M
TIr
Figure D-2. Subsonic Rolling Motion Data (Run92.2)
-D-

NADC-79260-60
DATA PT. 8 CRS coj4FZO s1(Q3)10- 2 CRff$
-. '4
a- - -
A -°
.0- - -V.
-g.2
0 60 1000 is"0 8000 8-ee 3000 3see 4000 466 50010 - 3 SE'C
TIME HISTORY
Figure D-3. Subsonic Rolling Motion Data (Run 92.3)
10 -a C DATA PT.' CSOMS COt,.31 (163.1)10- - -fi
.4 I
"" v w V v 11 V1 v IV Im V
f, ,1 A
- . 2 - - - -
-1 .6
a 500 1000 1600 3000 35660 3060 3666 400 4S0 5000IS- 3 SEC
TIME
Figure D-4. Subsonic Rolling Motion Data (Run 163.1)
D-4

NADC-79260-60
0 CfS DATA PT.8 CRM$ CONFZG.S1 (163.2)
I.3 --
-S --- SE-
-. 8 - . - bn Ro -l - - -
-.8 --- --o e ,1,eeoe is.. a... as.. 3000 3500 4@o. 4500 50 01 - SEZC
Figure D-5. Subsonic Rolling Motion Data (Run 163.2)
D-5