market analysis of housing and retail trends
TRANSCRIPT

A L O H A T O M O R R O W
Market Analysis of Housing and Retail Trends
Prepared for
Washington County Department of Land Use and Transportation
Prepared by
Johnson Economics LLC
3/15/17


I
Contents Section Page
INTRODUCTION AND SUMMARY ............................................................................... 1-1
1 RESIDENTIAL MARKET ANALYSIS ........................................................................... 1-2 1.1.1 Ownership Housing ......................................................................................................... 1-2 1.1.2 Ownership Housing Demand (2017-2037) ...................................................................... 1-5 1.1.3 Rental Housing ................................................................................................................ 1-8 1.1.4 Rental Housing Demand (2017-2037) ........................................................................... 1-12 1.1.5 Summary of Housing Findings ....................................................................................... 1-13
2 RETAIL MARKET ANALYSIS ................................................................................... 2-1 2.1.1 Retail Supply .................................................................................................................... 2-1 2.1.2 Retail Space Demand (2017-2037) .................................................................................. 2-4 2.1.3 Summary of Retail Findings ............................................................................................. 2-5
3 CURRENTLY FEASIBLE DEVELOPMENT FORMS ........................................................... 3-1
4 DEVELOPMENT CONSIDERATIONS .......................................................................... 4-1 4.1.1 Drivers of Development .................................................................................................. 4-1 4.1.2 Challenges to Redevelopment ........................................................................................ 4-2
5 DISPLACEMENT CONSIDERATIONS .......................................................................... 5-4 5.1.1 Factors behind the trend ................................................................................................. 5-4 5.1.2 Who is impacted by displacement? ................................................................................ 5-5


SECTION 1
1-1
Introduction and Summary This report provides market analysis and discusses trends and conditions in housing and commercial real estate within the Study Area as part of the Existing Conditions phase of the Aloha Tomorrow planning project. The findings presented in this report are meant to help build a foundation and understanding of the Study Area which will inform future phases of the project.
This analysis focuses on the following real estate categories: ownership housing, rental housing, and retail space. For each type of real estate, we provide an overview of the existing supply as well as a summary of current pricing and long-term market trends. We also make demand projections for each type of real estate within appropriate market areas.
Sources: This analysis relies heavily on geocoded property data from Metro RLIS and market data from the Regional Multiple Listing Service (ownership housing), Axiometrics and Rainmaker (rentals) and CoStar (commercial). For our demand projections, we also make use of household projections and retail spending data from Nielsen Claritas.
For the purposes of this analysis, the Study Area is defined as the “project area” boundaries, as originally proposed in the project grant. The following map shows the locations within the Study Area of the three types of real estate evaluated in this analysis.
Chart 1.1. Location of Evaluated Real Estate Forms in the Study Area
Source: Metro, QGIS, JOHNSON ECONOMICS
Summary of Findings. The following is an overview of major findings detailed in this report. Please see the appropriate section for more detail on all of these topics.
Residential demand will exceed available land in Aloha. There isa forecasted need for roughly 5,000 new units in the Aloha CDP(census-designated place), with an estimated 920 units (18.5%)demanded in the Study Area. Most new development will bemulti-family and targeted at renters. Demand for ownershiphousing will increasingly be met by infill and attached solutionswith more density than the traditional housing stock in the area.
Demand for commercial, and especially retail space, willincrease along with the population in Aloha and nearby SouthHillsboro. Properties south of TV Highway that front ShawStreet tend to draw lower lease rates than those on the northside. Properties with visibility and access from TV Highway maysee increasing lease rates and some redevelopment to larger,strip malls with a larger anchor tenant.
Planning decisions can impact the type of development thatmay occur in the Study Area. For instance, without changes topolicy, most commercial development will continue to be autooriented. With intervention, a more walkable form may beachievable.
Ownership Housing
Rental Housing
Retail/Commercial

1-2
1 Residential Market Analysis This section discusses trends in ownership housing and rental housing. 20-year growth projections are provided for each and overall findings for housing trends are summarized.
1.1.1 Ownership Housing Ownership Housing Inventory. According to taxlot data from Metro, there are 1,661 ownership housing units within the Study Area. These make up 53% of the area’s approximately 3,100 total housing units. This is a lower share of owner-occupied units than that found in Aloha as a whole (66%), Washington County (60%), or the Metro area (61%).
Chart 1.2. Location of Ownership Housing in the Study Area
Source: Metro, QGIS, JOHNSON ECONOMICS
Chart 1.3. Ownership Housing Units by Type, Study Area
Source: Metro, JOHNSON ECONOMICS
Some 60% of the ownership units are single-family detached housing, while 32% are multi-plexes and townhouses on separately owned land
(fee simple), and 8% are condominium units. Of the condominiums, the vast majority are multi-plexes and townhouses, and only a handful are stacked flats.
The homes were built between the late 1800s and 2016, and have an average age of 35 years (built 1982). The single-family detached homes are generally older than attached homes and condominiums. The average age of detached homes are 42 years, while attached homes are on average 26 years old, and condominiums average 21 years old.
Chart 1.4. Ownership Housing Units by Year Built, Study Area
Source: Metro, JOHNSON ECONOMICS
In terms of size, the homes range from 530 to 4,800 square feet, with an average of 1,500. The condominiums are the smallest, with an average of 1,130 square feet. The attached and detached single-family homes have similar averages, 1,515 and 1,540, respectively. Though attached homes typically are significantly smaller than detached homes, the Study Area has a number of older detached homes that are relatively
Housing Type Units
Single-family detached 1,004
Single-family attached (multi-plex, townhouse) 524
Condominium attached (multi-plex, townhouse) 129
Condominium multi-family (stacked flat) 4
Total, for-sale units 1,661
SF Det.60%
SF Att.32%
Condo Att.8%
Condo MF0%
0
50
100
150
200
250
300
350
400
450
Ho
me
sDecade
By Year Built
SF Det.
SF Att.
Condo
1-3
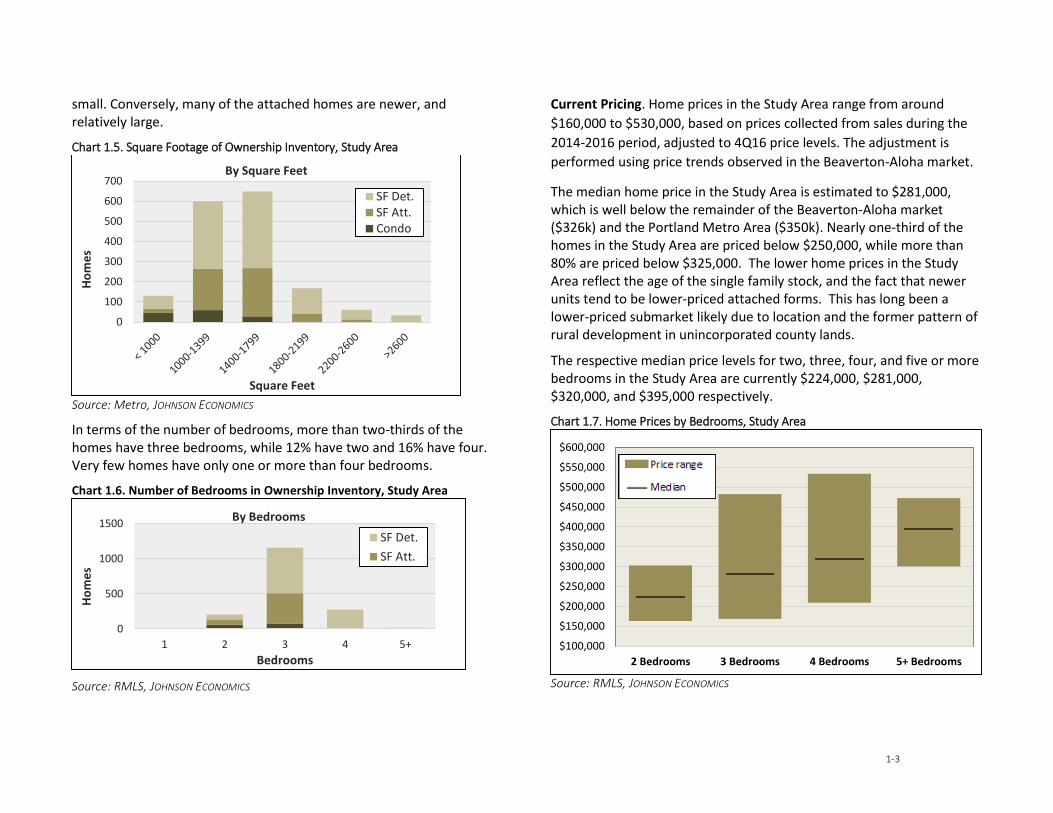
small. Conversely, many of the attached homes are newer, and relatively large.
Chart 1.5. Square Footage of Ownership Inventory, Study Area
Source: Metro, JOHNSON ECONOMICS
In terms of the number of bedrooms, more than two-thirds of the homes have three bedrooms, while 12% have two and 16% have four. Very few homes have only one or more than four bedrooms.
Chart 1.6. Number of Bedrooms in Ownership Inventory, Study Area
Source: RMLS, JOHNSON ECONOMICS
Current Pricing. Home prices in the Study Area range from around
$160,000 to $530,000, based on prices collected from sales during the
2014-2016 period, adjusted to 4Q16 price levels. The adjustment is
performed using price trends observed in the Beaverton-Aloha market.
The median home price in the Study Area is estimated to $281,000, which is well below the remainder of the Beaverton-Aloha market ($326k) and the Portland Metro Area ($350k). Nearly one-third of the homes in the Study Area are priced below $250,000, while more than 80% are priced below $325,000. The lower home prices in the Study Area reflect the age of the single family stock, and the fact that newer units tend to be lower-priced attached forms. This has long been a lower-priced submarket likely due to location and the former pattern of rural development in unincorporated county lands.
The respective median price levels for two, three, four, and five or more bedrooms in the Study Area are currently $224,000, $281,000, $320,000, and $395,000 respectively.
Chart 1.7. Home Prices by Bedrooms, Study Area
Source: RMLS, JOHNSON ECONOMICS
0
100
200
300
400
500
600
700
Ho
me
s
Square Feet
By Square Feet
SF Det.SF Att.Condo
0
500
1000
1500
1 2 3 4 5+
Ho
me
s
Bedrooms
By Bedrooms
SF Det.
SF Att.
$100,000
$150,000
$200,000
$250,000
$300,000
$350,000
$400,000
$450,000
$500,000
$550,000
$600,000
2 Bedrooms 3 Bedrooms 4 Bedrooms 5+ Bedrooms

1-4
Chart 1.8. Ownership Housing Inventory by Price Level, Study Area
Source: RMLS, JOHNSON ECONOMICS
Sales and Price Trends. The ownership housing market in the Study
Area has recovered over the past three years, after a seven-year period
of weakness following the mid-2000s foreclosure crisis and ensuing
recession. The sales volume in 2016 was above the 2006 level, and
represents more than a doubling of the annual volume over the 2007-
2013 period.
The sales trend resembles the wider trend in the Beaverton-Aloha market, though the latter started the recovery earlier and has seen more gradual improvement over the recent past. In part, this reflects the housing inventory in the Study Area, which appeals to relatively price sensitive homebuyers. These buyers were disproportionately hard hit by the last economic downturn.
In terms of pricing, the Study Area has tracked changes in the Beaverton-Aloha market relatively closely, though the price recovery began in 2013 rather than 2012. The 2016 median price in the Study Area represents a 69% increase from the post-recession low point. This is a stronger increase than in the Beaverton-Aloha market (+62%), but the latter also saw a more limited decline over the prior years. Compared to the 2006 median price level, both geographies have seen the same change in pricing over the past ten years (+25%).
The housing market has seen increasing price appreciation over the past three years, reflecting the limited supply of homes on the market. Within the Study Area, the appreciation in 2014, 2015, and 2016 was 11%, 8%, and 12%, respectively. In comparison, Beaverton-Aloha recorded appreciation of 7%, 9%, and 13% over these three years, respectively.
These trends are based on sales reported through the Regional Multiple Listing Service (RMLS), which records most but not all sales. These trends are generally representative for a market as a whole, but do not present absolute sales volume.
0%
2%
4%
6%
8%
10%
12%
14%
16%
18%
20%
SF Det.SF Att.Condo
1%7%
14%
30%
48%
67%
82% 85%91%
97% 100%
0%
20%
40%
60%
80%
100%
120%
Ho
me
s
Square Feet
By Price Level, Cumulative

1-5
Chart 1.9. Sales and Price Trends, Ownership Housing
Source: Metro, RMLS, JOHNSON ECONOMICS
1.1.2 Ownership Housing Demand (2017-2037) JOHNSON ECONOMICS has developed a housing demand model that translates estimates of market-area household growth into demand for housing of different forms. Our model begins with household growth estimates stratified by age and income, as these are the variables that best predict housing preferences. Our household growth estimates are based on five-year projections developed by Nielsen Claritas, a third-party data provider that draws on multiple data sources to identify trends that impact the household base within specific geographies. We extrapolate and adjust these projections to reflect a 20-year forecast period. The projections reflect underlying demand (preferences) rather than expected realized household growth, which is constrained by supply.
After developing a segmented projection of overall housing demand for the market area, we use census data to establish local, segment-specific rates of housing tenure (owners/renters) in order to derive assumptions of future housing preferences. The demand forecast is developed for the Aloha CDP. The Study Area’s potential capture of this demand is estimated by applying capture rates derived from existing housing ratios between the two geographies.
Over the coming 20 years, our baseline forecast is for a demand increase of roughly 5,000 housing units, or 250 units per year in Aloha as a whole. This represents annual growth of 1.2%, which is slightly lower than the 1.3% average annual growth seen since 2000.
The demand forecast indicates a shift to somewhat older segments over the forecast period. This is in part a reflection the aging of the baby boomers; in part a function of the broader societal trend of young single people migrating from suburban and rural environments towards more urban areas. These households may migrate back when they form families and to seek first-time home buyer opportunities.
0
500
1,000
1,500
2,000
2,500
3,000
3,500
4,000
0
20
40
60
80
100
120
140
160
2006 2007 2008 2009 2010 2011 2012 2013 2014 2015 2016
Be
ave
rto
n-A
loh
a
Stu
dy
Are
a
SalesStudy Area
Beaverton-Aloha
$0
$50,000
$100,000
$150,000
$200,000
$250,000
$300,000
$350,000
2006 2007 2008 2009 2010 2011 2012 2013 2014 2015 2016
Median Price
Study Area
Beaverton-Aloha

1-6
Chart 1.10. Household Age and Income Trends, Aloha CDP
Source: Nielsen Claritas, JOHNSON ECONOMICS 2017 Dollars
In terms of income, the forecast indicates demand growth across the entire spectrum, but with the strongest increase seen among households making $100,000 or less.
Chart 1.11 displays our assumptions for segment-specific ownership rates, derived from census data. These rates are applied to the total housing demand forecast in order to estimate demand for ownership units.
Chart 1.11. Ownership Rates by Age and Income, Aloha CDP (2017)
Source: U.S. Census Bureau, JOHNSON ECONOMICS
Applying the ownership rates to our housing forecast yields a baseline demand estimate of 3,650 ownership units over the coming 20 years in the Aloha CDP. This represents 73% of the total demand growth. The demand is expected to be concentrated among family-age households and empty-nesters/retirees. The net increase in demand from younger households is expected to be marginal. In terms of income, the demand is anticipated to be dominated by middle-income households.
Currently, the Study Area represents 11% of the total inventory of ownership housing in the Aloha CDP (estimated through a GIS analysis of taxlot data). For the purpose of this study, we will assume that new demand will reflect this balance. This indicates potential demand of 400 ownership units in the Study Area.
0
1,000
2,000
3,000
4,000
5,000
6,000
15-24 25-34 35-44 45-54 55-64 65-74 75+
Ho
use
ho
lds
2017
2037
0
1,000
2,000
3,000
4,000
5,000
6,000
Under$15k
$15k -$24k
$25k -$34k
$35k -$49k
$50k -$74k
$75k -$99k
$100k -$124k
$125k -$149k
$150k -$199k
$200k +
Ho
use
ho
lds
2017
2037
Owner %
Income Cohort 15-24 25-34 35-44 45-54 55-64 65-74 75+ Total
< $15k 4.0% 18.7% 24.6% 29.5% 51.7% 49.6% 41.6% 32.3%
$15k-$24k 5.8% 25.6% 32.8% 38.5% 61.6% 59.6% 51.6% 42.1%
$25k-$34k 12.6% 44.6% 53.3% 59.4% 78.9% 77.5% 71.4% 61.6%
$35k-$49k 11.5% 42.0% 50.7% 56.9% 77.2% 75.7% 69.2% 57.5%
$50k-$74k 17.5% 54.2% 62.6% 68.3% 84.7% 83.5% 78.6% 68.1%
$75k-$99k 30.4% 70.8% 77.5% 81.6% 91.9% 91.3% 88.3% 79.9%
$100k-$124k 30.9% 71.3% 77.9% 81.9% 92.1% 91.4% 88.5% 82.5%
$125k-$149k 30.9% 71.3% 77.9% 81.9% 92.1% 91.4% 88.5% 80.6%
$150k-$199k 45.6% 82.3% 86.9% 89.5% 95.6% 95.2% 93.5% 89.7%
$200k+ 45.6% 82.3% 86.9% 89.5% 95.6% 95.2% 93.5% 87.2%
Total 14.5% 54.7% 65.4% 69.9% 82.8% 79.1% 66.8% 67.6%
Age Cohort

1-7
Chart 1.12. Projected Ownership Demand by Age & Income, Aloha (2017-2037)
Source: JOHNSON ECONOMICS
0 200 400 600 800 1,000 1,200
15-24
25-34
35-44
45-54
55-64
65-74
75+
Households
Age
Co
ho
rt
0 200 400 600 800 1,000
< $15,000
$15,000 - $24,999
$25,000 - $34,999
$35,000 - $49,999
$50,000 - $74,999
$75,000 - $99,999
$100,000 - $124,999
$125,000 - $149,999
$150,000 - $199,999
$200,000+
Households
Inco
me
Co
ho
rt

1-8
1.1.3 Rental Housing Rental Housing Inventory. According to taxlot data from Metro, there are nearly 1,500 rental homes within the Study Area, accounting for 47% of the area’s housing supply. These units are distributed across 81 properties. This count does not include units that are sold individually, even if they are rented out for shorter or longer periods (included in ownership counts).
Chart 1.13. Location of Rental Housing in the Study Area
Source: Metro, QGIS, JOHNSON ECONOMICS
The vast majority of the rentals are apartments of the stacked flat format. These total 1,380 units and make up 94% of the rental supply. Nearly 100 units are multi-plexes and townhouses.
The rental supply within the Study Area was largely built out in two construction periods. The first was a prolonged phase from 1968 to 1983, during which 690 units (47% of all rentals) were built. The second period was a shorter but more intense building boom, with larger projects. This took place between 1994 and 1998, when 575 units (39% of inventory) were built. Only 24 units have been built since 2000 in three projects (one of 18 units, and two small projects).
In terms of project scale, the properties range from 2 to 120 units, with an average of 18. Only 8 properties have more than 50 units, but these account for 45% of the total unit supply. Only 11% of the units are on properties with fewer than 10 units. 27 properties have between 10 and 49 units, representing 44% of the rental supply.
Chart 1.14. Profile of Rental Housing Inventory, Study Area
Source: Metro, Axiometrics, JOHNSON ECONOMICS
0
100
200
300
400
500
600
700
0
5
10
15
20
25
< 1960 1960-69 1970-79 1980-89 1990-99 2000-09 2010-16
Un
its
Pro
ject
s
Decade
By Year Built
Projects
Units
0
50
100
150
200
250
300
350
400
450
0
5
10
15
20
25
30
35
40
2-4 5-9 10-29 30-49 50-69 70-89 90-110 110+
Un
its
Pro
ject
s
Units in Project
By Project Size
Projects
Units

1-9
Data on the breakdown of units by number of bedrooms is not available for the Study Area itself, but in Aloha CDP, the Census estimates that a large majority of rental units feature two or three bedrooms. An estimated 39% are two bedroom units, and an estimated 43% are three bedroom units. Only 10% are estimated to be one bedroom units, and only 8% total are studios or have more than three bedrooms.
Current Pricing. Our analysis of rental rates in the Study Area is based on rates reported by Axiometrics and Rainmaker. These providers had recent data on 20 of the largest market-rate rental properties in the area. Together, these properties account for 750 units, and thus represent two-thirds of the market (see right hand table). Smaller, independent rentals not represented in this sample are likely to have somewhat lower average rents than these larger complexes.
Current market rates across the surveyed properties range from $779 to $1,650. The average rent level is estimated to be $1,135. We estimate one-fourth of the units to be priced below $1,000 per month, and roughly 45% to be priced between $1,000 and $1,200. One-fourth of the units are estimated to priced above $1,200, including 4% above $1,400.
Chart 1.15. Rent Level by Bedrooms, Study Area
Source: Axiometrics, Rainmaker, JOHNSON ECONOMICS
The following chart displays rent ranges and averages by unit type (Bedrooms/baths). One-bedroom units average roughly $1,018, while two-bedroom/one-bath units average approximately $1,078, and the larger units average just below $1,335.
Chart 1.16. Sample of Rental Housing Supply by Price Level, Study Area
Source: Axiometrics, Rainmaker, JOHNSON ECONOMICS
$400
$600
$800
$1,000
$1,200
$1,400
$1,600
$1,800
$2,000
1B 2B/1b 2B/2b 3B+
YEAR TOTAL
NAME BUILT UNITS 1B 2B/1b 2B/2b 3B+
Market Rate Housing Sample
CASCADE WOODS 1997 92 $1,175 $1,150 $1,300
REEDVILLE COMMONS 1994 88 $1,082 $1,352
HANOVER APARTMENTS 1998 84 $1,165 $1,350 $1,502 $1,650
OAKWOOD II 1969 72 $1,008 $1,074 $1,204 $1,374
THE PATRICIAN 1974 63 $968 $1,061
COVINGTON SQUARE 1988 60 $836 $1,010 $1,138
ALOHA CREST 1973 32 $779 $997 $1,076 $1,147
SPRING PARK 1998 32 $1,032 $1,244
COUNTRY WOOD 1972 31 $1,067 $1,260
ST. MARY'S CROSSING 1970 29 $1,032
REEDVILLE MEADOWS 1997 28 $954 $1,060
VALLEY WOODS 1981 28 $943 $1,139
ROCHELLE 1971 25 $980 $1,123
CAMBRIDGE PARK 1972 24 $1,017
JOHNSON ST APTS 2015 18 $1,253
OAK VILLA 1980 16 $920
ALOHA WEST 1960 14 $830 $955
VIKING VILLA 1962 10 $927
3395 SW 178TH AVE 1973 4 $1,175
KEERI ANN 1978 4 $1,110
Min 1960 4 $779 $920 $1,076 $1,138
Average 1985 38 $1,018 $1,078 $1,282 $1,332
Max 2015 92 $1,175 $1,350 $1,502 $1,650
AVERAGE RENT

1-10
Affordable Housing. The Washington County Affordable Housing
Development Strategy prepared in 2016 identified 1,647 affordable
housing units in the Aloha CDP (Chart 1.17).
Chart 1.17. Affordable Housing Supply in Aloha CDP (2016)
Source: Washington County Affordable Housing Development Strategy (Pg.55), JOHNSON ECONOMICS
Johnson Economics identifies the following affordable housing
properties within the study area itself. These include two larger
properties of 120 and 78 units. In the Aloha Town Center focus area
there are 213 identified units. A smaller project of 18 units is located in
the western end of the study area, north of the South Hillsboro planning
area.
Chart 1.18. Affordable Housing Supply Identified Within Study Area
Source: RLIS, OHCS, JOHNSON ECONOMICS
YEAR TOTAL
BUILT UNITS
Subsidized Housing
WILLOW SPRINGS 1995 120 Town Center
BRENTWOOD OAKS 1996 78 Town Center
TRI-HAVEN MENTAL HEALTH 1998 15 Town Center
MARILANN TERRACE 1960 18 Near SW 211th
TOTAL: 231
NAME LOCATION

1-11
Rent and Vacancy Trends. Data on vacancy rates and historical rent trends are not available for the Study Area. However, the Aloha market is covered by the biannual survey conducted by Multifamily NW, and we expect trends observed in the Aloha market to be representative also for the Study Area. The Multifamily NW survey includes data from roughly one-fourth of the apartment inventory in the Portland Metro Area, and covers 7,400 units in Aloha.
The vacancy rate in Aloha has largely tracked the metro-wide vacancy rate in recent years, though the smaller size of the market causes more volatility from survey to survey, due to the smaller sample size. Only during the last recession did Aloha’s vacancy rate depart notably from the remainder of the region, reaching a high of 8.6%. This might reflect that the market’s apartment inventory attracts relatively young renters, which were disproportionately hard hit by the recession.
The current vacancy rate is 3.6%, on par with the metro-wide average. A vacancy rate at this level is low in a historical context, and indicates an undersupplied market. A 5.0% rate is typically considered to represent a healthy balance between supply and demand. In general, the lower the vacancy rate, the higher the rent growth.
According to the Multifamily NW survey, the average rent level in Aloha CDP is $1,186, approximately $100 higher than our estimate for the Study Area. The current rent level represents an increase of 11% from the year before. This follows annual rent growth of 8% and 7% over the two prior years. Over the past five years, the average annual rent growth is 9%.
The historical rent growth observed in Aloha is in line with the regional rent growth. As with vacancy, it was only during the last recession that Aloha deviated significantly from the remainder of the Metro Area. As renters hit by the downturn were vacating their units, property managers discounted their units in order to fill them with new tenants. This trend reversed in 2010, and we have seen steady rent increases over the last six years.
Chart 1.19. Vacancy and Rent Trends, Aloha
Source: Metro, RMLS, JOHNSON ECONOMICS
0%
1%
2%
3%
4%
5%
6%
7%
8%
9%
10%Vacancy
Aloha
Portland Metro
-20%
-10%
0%
10%
20%
30%
40%
50%
60%
70%
80%Rent Growth Since 2008
Aloha
Portland Metro

1-12
1.1.4 Rental Housing Demand (2017-2037) Our demand projections for rental housing follow the same methodology as for ownership housing, and are estimated using the same model. However, instead of applying ownership rates to the total demand estimates, we apply rates for renter tenure.
Our demand model indicates a net demand increase of nearly 1,400 rental units in Aloha CDP over the next 20 years, or around 70 units per year, on average. This represents 27% of the projected total housing demand in Aloha.
The net increase in rental demand is anticipated to be more evenly distributed across age groups than ownership housing, though with a decline among 25-to-34-year-olds, who typically are prime apartment renters. Seniors above 75 years of age are anticipated to account for approximately one-third of the demand growth.
In terms of income, the rental demand is projected to be dominated by those earning $75,000 or less, with a high concentration in the lowest income brackets. This is based on past income trends and projected future growth in these income cohorts in the Aloha CDP.
This suggests support for additional subsidized or rent-regulated units as well as market-rate units. Two-thirds of the net-new demand is projected to come from households with annual incomes below $50,000.
Currently, the Study Area represents 38% of the total inventory of rental housing in Aloha, according to data from Metro. Assuming the same rate for capture of new demand indicates demand growth of 520 units in the Study Area over the forecast horizon. As noted in our projections for ownership demand, the Study Area might capture a higher share of the demand if the remainder of Aloha is undersupplied over this period.
Chart 1.20. Projected Rental Demand by Age and Income, Aloha (2017-2037)
Source: JOHNSON ECONOMICS
-400 -200 0 200 400 600
15-24
25-34
35-44
45-54
55-64
65-74
75+
Households
Age
Co
ho
rt
-100 0 100 200 300 400
< $15,000
$15,000 - $24,999
$25,000 - $34,999
$35,000 - $49,999
$50,000 - $74,999
$75,000 - $99,999
$100,000 - $124,999
$125,000 - $149,999
$150,000 - $199,999
$200,000+
Households
Inco
me
Co
ho
rt

1-13
1.1.5 Summary of Housing Findings This section summarizes findings on current housing conditions and projected demand in the Study Area from the preceding sections.
Ownership Housing. Aloha remains an area of lower cost housing in Washington County. Over the last two years, the median home price in the Study Area ($280k) has been 16% lower than the broader Beaverton/Aloha housing market, and 25% lower than the Portland Metro median. 85% of sales in the Study Area were for less than the Metro median home price.
Single family homes in the Study Area tend to be older and smaller than the broader market, providing lower cost opportunities for home ownership. Since 2000, a range of attached housing types have been for sale, including townhomes, duplexes and triplexes. While these may replace existing single family homes, these new attached units also provide good opportunities first-time homebuyers and middle to lower-income households, while providing more units per parcel.
Rental Housing. The Study Area represents an outsized share of Aloha’s total rental stock. In comparison to the attached ownership housing in the area, the rental stock is relatively old, with nearly all rental units constructed before 2000. The largest periods of new construction were the 1970s and 1990s.
The vintage of these properties has helped contribute to keeping rent levels in check. However, as with much of the Metro area, Aloha is now seeing rapid increases in rent levels. Rents have risen an estimated 11% in the last year, and over 50% in five years. On a per-square-foot basis, average rents in Aloha are estimated to be roughly equal to Beaverton and 7% lower than the Metro-area average.
Within the Study Area, the average surveyed rents are roughly 10% lower for one bedroom units, but equivalent to community-wide averages for larger units.
Tenure Split. According to the Census, Aloha households are roughly 66% homeowners and 34% renters. However, in the Study Area the split is 53%/47% indicating that this area contains a greater share of rental units than other parts of the community. In fact, the Study Area contains an estimated 38% of Aloha’s rental units, despite making up just 17% of all housing units overall.
Given these trends, current zoning designations, and policy goals for transit corridors, it is reasonable to assume that rental units will continue to make up a larger share of new housing. The projections presented above indicate a 20-year demand for 520 rental units and 400 ownership units in the project study area. These are net new units which may come in the form of new development or redevelopment of existing properties with additional units.
Rental housing is associated with more multi-family housing types and higher residential density.
Future Development Forms. Given the trends towards more rental units and more attached types of ownership housing, we anticipate that future development will continue to favor higher density forms. New single family homes will make up a smaller share of new housing construction in the Study Area.
The development forms and densities which are currently feasible are discussed in more detail in Section 3 of this report.


SECTION 2
2-1
2 Retail Market Analysis 2.1.1 Retail Supply Retail Space Inventory. According to taxlot data from Metro, there are 182 acres of land with commercial uses within the Study Area. A large portion of this is occupied by non-retail tenants, and Metro’s data does not identify the specific commercial use that occupies each property. In our evaluation of the Study Area’s inventory of retail space, we therefore rely on a qualitative survey of a sample of properties rather than quantitative data for the entire market. Our evaluation is based on taxlot data for properties identified as retail properties along TV Highway (101 properties; 660k SF) referred to as the larger sample, and on a survey of seven properties with currently available retail space (see next page).
Chart 2.1. Location of Commercial Land in the Study Area
Source: Metro, QGIS, JOHNSON ECONOMICS
The Study Area’s retail properties are primarily freestanding buildings and small strip malls. Half the properties in our larger sample are smaller wood-frame structures with pitched roofs. Due to their more limited window line, such properties generally carry less appeal with retail tenants, and thus capture relatively low lease rates.
Among the buildings in our larger sample, total building area ranges from a few hundred to around 60,000 square feet. Some of the malls encompass multiple buildings. Two thirds of the sample have less than
5,000 square feet, while only three have more than 40,000 square feet; two strip malls and one grocery store.
Most of the retail space appears to have been constructed in the sixties, seventies, and eighties, though there are more recent examples.
Chart 2.2. Retail Buildings by Roof Type and Square Feet, Study Area Sample
Source: Metro, Axiometrics, JOHNSON ECONOMICS
Our comparable survey includes seven properties ranging in size from 1,200 to 80,000 square feet (the latter includes multiple buildings), representing a total of 167,000 square feet. Six of these are single-story buildings exclusively offering retail space. Among these, floor area ratios (FARs) range from 0.23 to 0.50, with an average of 0.35. As a general rule, 0.25 is typical for modern, suburban retail space.
Among the same six properties, parking ratios range from 1.3 to 5.2 spaces per 1,000 square feet of retail space, for an average of 3.3. Modern, suburban retail projects typically feature 3 to 4 parking spaces per 1,000 square feet.
Current Pricing and Vacancy Rates. A summary of our sample survey of retail space is included on the next page. A discussion of observed lease rates and vacancy rates is provided following this summary.
0%
5%
10%
15%
20%
25%
30%
< 1k 1k-3k 3k-5k 5k-10k 10k-20k 20k-40k 40k +
Squ
are
Fe
et
Flat Roof
Pitched Roof


SECTION 2
2-1
Chart 2.3. Survey of Retail Properties with Available Space in the Study Area
Source: CoStar, Metro, JOHNSON ECONOMICS

2-2
Among the seven properties surveyed in detail, current asking rates range from
around $13.00 modified gross to $24.00 triple-net1. We assume that modified
gross rates in the sample are $3.00-4.00 higher than equivalent triple-net rates.
On this basis, the properties represent an average lease rate of roughly $18.00
triple-net. When weighted by square footage, the average is around $20.50.
There is a clear distinction between the strip malls and the smaller freestanding buildings in terms of the lease rates they can charge. The highest rates are observed at the two largest strip malls, Market Centre East and the Aloha Mall, which provide spaces large enough to accommodate national anchor retailers. These are typically attracted by high visibility, convenient access and parking, and extensive window lines. Once the anchors are in place, the properties can charge a premium for the exposure to anchor-driven traffic.
The lowest rates in the sample are observed at properties that are unsuitable for larger anchor retailers. For instance, the low parking ratio at the Pacific Watersports Buildings (1.3/1.000 sf.), combined with its partial window line, disqualifies it from meeting the requirements of national retailers. At 18385 SW TV Hwy, the limited size of the building and site make it unsuitable for a large retailer. With their lower lease rates, such properties serve an important function in accommodating smaller local retailers.
Vacancy rates at the surveyed properties range from 1% to 100%, and average 10%. This rate is not representative for the Study Area, as the properties were identified because they have available space and advertised lease rates. Considering this bias, and the fact that these are the only retail properties currently listed through commercial brokers in the Study Area, the total vacancy reflects a tight market. Dividing the identified vacant space by the total space in our larger sample of identified retail properties indicates a 2.4% vacancy rate.
Lease Rate and Vacancy Trends. Historical retail data is not available for small geographies. According to CoStar’s delineation, the Study Area is part of the
1 Under a “Full Gross” lease the property owner is typically responsible for all operational and maintenance costs, including taxes, utilities, maintenance, etc. A “Triple-Net” lease makes these costs the responsibility of the tenant. Due to these added costs to the tenant, a nominal triple-net rent is most often lower than a full gross rent would be for the same space. A “Modified Gross” lease is a hybrid with the property owner and the tenant sharing these costs in some fashion.
larger Sunset Corridor/Hillsboro market. The following chart compares this market to the remainder of the region.
Chart 2.4. 4Q16 Retail Space Market Statistics, Portland Metro Area
Source: CoStar
The average lease-rate in the Sunset/Hillsboro market is currently $18.37 per
square foot, below the average in our survey and on par with the metro-wide
Inventory Vacancy 2016 Net 2016 Under Avg. Asking
Submarket (SF) (%) Absorption Deliveries Constr. SF Rate
Kruse Way 780,898 4.9% 3,149 0 0 $28.02
Barbur Blvd/Capitol . 1,120,636 1.5% (267) 0 0 $25.50
Hayden Island/Swan I. 2,757,858 5.7% 26,996 25,050 14,665 $23.43
Johns Landing 352,448 2.7% 2,191 0 0 $23.23
Wilsonville 1,968,992 4.5% 4,577 0 86,600 $22.88
NW Close-In 1,661,363 3.4% (972) 0 0 $22.87
Tigard 3,286,382 5.0% (40,397) 0 0 $22.81
Lloyd District 5,564,753 4.3% 11,903 0 0 $21.92
CBD/West Vancouver 1,226,989 6.7% 3,931 0 0 $21.84
North Beaverton 5,136,161 4.9% 3,323 5,973 128,652 $21.72
NE Close-In 2,842,877 1.1% 1,303 0 0 $21.69
Tualatin 1,353,703 6.4% (14,563) 0 10,112 $21.61
Rivergate 375,540 1.4% 8,913 3,000 0 $21.09
Guilds Lake 164,787 1.1% (1,764) 0 0 $20.00
Camas/Washougal 1,261,747 5.2% 6,897 0 0 $19.76
Cascade Park 3,874,712 4.3% 62,990 9,768 15,500 $19.43
SE Close-In 3,654,220 1.5% 23,231 0 9,805 $19.20
CBD 4,820,506 4.0% 26,404 13,141 28,000 $19.14
Clackamas/Milwaukie 11,434,799 2.8% 210,487 200,011 71,380 $18.73
Sunset Corridor/Hill. 9,637,155 3.2% 95,155 53,000 15,859 $18.37
Vancouver Mall 2,276,129 0.2% 165,640 9,976 0 $18.34
Sherwood 1,217,491 3.8% 13,125 10,000 0 $17.64
Hazel Dell/Salmon Cr. 3,082,984 4.7% 29,349 8,152 36,000 $17.52
Lake Oswego/West Lin. 2,328,270 6.6% (13,519) 4,455 0 $17.15
St Johns/Cntrl Vanco. 3,661,945 5.0% 37,669 0 0 $16.97
217 Corridor/Beavert. 5,759,982 2.4% 51,121 0 0 $16.69
Orchards 3,381,793 7.4% (418) 19,890 0 $16.51
Gresham 3,960,903 5.3% 52,049 10,295 0 $16.33
Gateway 4,691,197 2.1% 9,455 1,000 0 $15.66
Oregon City 2,070,309 9.3% (52,850) 9,650 0 $15.51
Sylvan/Hillsdale 723,266 9.6% (55,055) 0 0 $15.25
Mall 205 5,663,494 3.9% 82,432 5,287 15,000 $14.16
East Columbia Corrid. 3,741,759 3.5% 27,091 14,820 0 $14.06
Airport Way 2,031,572 2.2% 385 0 0 $13.97
TOTAL 108,590,781 3.9% 773,961 403,468 431,573 $18.23
2-3
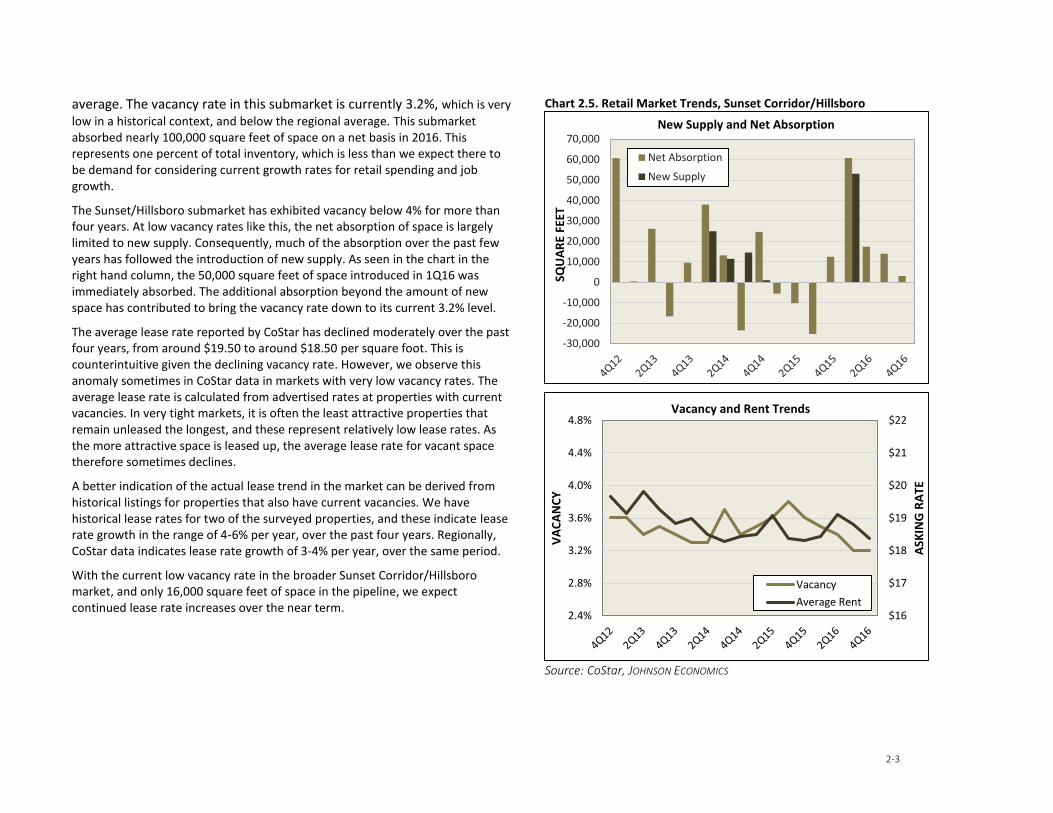
average. The vacancy rate in this submarket is currently 3.2%, which is very
low in a historical context, and below the regional average. This submarket absorbed nearly 100,000 square feet of space on a net basis in 2016. This represents one percent of total inventory, which is less than we expect there to be demand for considering current growth rates for retail spending and job growth.
The Sunset/Hillsboro submarket has exhibited vacancy below 4% for more than four years. At low vacancy rates like this, the net absorption of space is largely limited to new supply. Consequently, much of the absorption over the past few years has followed the introduction of new supply. As seen in the chart in the right hand column, the 50,000 square feet of space introduced in 1Q16 was immediately absorbed. The additional absorption beyond the amount of new space has contributed to bring the vacancy rate down to its current 3.2% level.
The average lease rate reported by CoStar has declined moderately over the past four years, from around $19.50 to around $18.50 per square foot. This is counterintuitive given the declining vacancy rate. However, we observe this anomaly sometimes in CoStar data in markets with very low vacancy rates. The average lease rate is calculated from advertised rates at properties with current vacancies. In very tight markets, it is often the least attractive properties that remain unleased the longest, and these represent relatively low lease rates. As the more attractive space is leased up, the average lease rate for vacant space therefore sometimes declines.
A better indication of the actual lease trend in the market can be derived from historical listings for properties that also have current vacancies. We have historical lease rates for two of the surveyed properties, and these indicate lease rate growth in the range of 4-6% per year, over the past four years. Regionally, CoStar data indicates lease rate growth of 3-4% per year, over the same period.
With the current low vacancy rate in the broader Sunset Corridor/Hillsboro market, and only 16,000 square feet of space in the pipeline, we expect continued lease rate increases over the near term.
Chart 2.5. Retail Market Trends, Sunset Corridor/Hillsboro
Source: CoStar, JOHNSON ECONOMICS
-30,000
-20,000
-10,000
0
10,000
20,000
30,000
40,000
50,000
60,000
70,000
SQU
AR
E FE
ET
New Supply and Net Absorption
Net Absorption
New Supply
$16
$17
$18
$19
$20
$21
$22
2.4%
2.8%
3.2%
3.6%
4.0%
4.4%
4.8%
ASK
ING
RA
TE
VA
CA
NC
Y
Vacancy and Rent Trends
Vacancy
Average Rent

2-4
2.1.2 Retail Space Demand (2017-2037) Our demand projections for retail space demand over the coming 20 years are derived from retail spending and sales data within the Aloha CDP, as reported by Nielsen Claritas. By applying rates of spending per household to anticipated household growth, we estimated the spending increase in the market over the forecast period. This can be converted to retail space by applying typical sales-per-square-foot ratios for each major retail category.
Based on 2017 figures, the average household in Aloha CDP spends $43,000 per year at brick-and-mortar retail stores. Collectively, this represents nearly $800 million. Drawing on our housing demand projections, we assume that the Aloha market will increase by some 5,000 households over the coming 20 years. The housing demand projection represents underlying demand; it is somewhat unlikely that all this demand will be realized given the limited availability of land in Aloha. At the same time, the buildout of South Hillsboro will likely contribute to increased retail demand within Aloha. Given the expected housing growth in Aloha and South Hillsboro, the housing demand projection of 5,000 households represents a reasonable assumption about retail space demand over the next 20 years.
Chart 2.6. Projected Retail Spending by Aloha Residents (2017-2037)
Source: Nielsen Claritas, JOHNSON ECONOMICS
With a market increase of 5,000 households, the Aloha CDP market will represent roughly $1 billion in retail sales by 2037 (2017 dollars). By applying typical sales-per-square-foot rates to each retail category, the increased spending translates
into demand for nearly 700,000 square feet of retail space. Assuming typical suburban format (FAR of 0.25), this represents demand for nearly 70 acres of additional retail development.
Chart 2.7. Projected Retail Space Demand in Sq.Ft., Aloha CDP (2017-2037)
1 "Dollars & Cents of Shopping Centers," Urban Land Institute, 2008. Adj. to 2016 dollars.
Source: JOHNSON ECONOMICS
Aloha is unlikely to capture the entire increase in retail space demand generated by the spending of its residents. According to Nielsen Claritas, retail spending within Aloha currently represents 39% of total spending by Aloha residents. In other words, Aloha exhibits a net retail “leakage” of 61% to surrounding areas. Assuming that this rate holds steady in the future, Aloha will see a demand increase of some 265,000 square feet of retail space over the forecast period, or 26 acres of retail land. We expect the Study Area to capture much of this increase in demand within Aloha, as it covers the entire stretch of the TV Highway commercial corridor.
Aloha might have the potential to reduce the retail leakage over the forecast period, and thereby capture more of the new retail demand. The retail leakage exhibited is across all spending categories, meaning that the area may be a good candidate for new retail businesses in a wide range of categories and formats. Some types of sales typically take place in “big box” or department stores, which may locate in a highway commercial environment like the study area. Other sales categories such as food and drink, clothing, and boutique stores may be a good fit for smaller spaces in the town center environment.
Aloha Per Household
NAICS Category Expenditures 2017 2027 2037 '17-'37 Δ
441 Motor Vehicles $9,173 $170 $193 $216 $46
441 Auto Parts & Tire Stores $735 $14 $15 $17 $4
442 Furniture and Home Furnishings Stores $946 $17 $20 $22 $5
443 Electronics and Appliance Stores $811 $15 $17 $19 $4
444 Building Materials and Garden Equipment $4,822 $89 $101 $113 $24
445 Food and Beverage Stores $6,255 $116 $131 $147 $31
446 Health and Personal Care Stores $2,351 $43 $49 $55 $12
447 Gas Stations $2,861 $53 $60 $67 $14
448 Clothing and Clothing Accessories Stores $2,229 $41 $47 $52 $11
451 Sporting Goods, Hobby, Book and Music $945 $17 $20 $22 $5
452 General Merchandise Stores $5,199 $96 $109 $122 $26
453 Miscellaneous Store Retailers $1,198 $22 $25 $28 $6
722 Foodservices and Drinking Places $5,432 $100 $114 $128 $27
Totals/Weighted Averages $42,957 $794 $902 $1,010 $216
Household Retail Spending (In Millions)
Aloha Sales Support
NAICS Category Factor 1 2017 2027 2037 '17-'37 Δ
441 Motor Vehicles $1,377 123,165 139,886 156,606 33,441
441 Auto Parts & Tire Stores $387 35,122 39,891 44,659 9,536
442 Furniture and Home Furnishings Stores $209 83,729 95,096 106,463 22,734
443 Electronics and Appliance Stores $302 49,637 56,376 63,114 13,477
444 Building Materials and Garden Equipment $389 229,205 260,322 291,438 62,232
445 Food and Beverage Stores $430 268,934 305,443 341,953 73,019
446 Health and Personal Care Stores $279 155,775 176,923 198,070 42,295
447 Gas Stations $735 71,977 81,749 91,520 19,543
448 Clothing and Clothing Accessories Stores $156 264,230 300,101 335,972 71,742
451 Sporting Goods, Hobby, Book and Music $199 87,768 99,683 111,598 23,830
452 General Merchandise Stores $164 586,135 665,706 745,278 159,143
453 Miscellaneous Store Retailers $127 174,381 198,055 221,728 47,347
722 Foodservices and Drinking Places $267 376,154 427,220 478,285 102,131
Totals/Weighted Averages 2,506,214 2,846,449 3,186,683 680,469
Spending Supported Retail Demand (SF)

2-5
2.1.3 Summary of Retail Findings This section summarizes findings on current retail conditions and projected demand in the Study Area from the preceding sections.
Retail Supply and Character. As with many well-established highway
corridors, the segment of the Tualatin Valley Highway that runs through
the Study Area is dominated by auto-oriented retail and commercial
service buildings of varying age and format. The strip itself is not
particularly bike or pedestrian friendly at this time and the commercial
properties reflect this. Nearly all of these businesses are served by
generous parking lots with most customers accessing these businesses as
drivers.
Commercial structures in the Study Area include standalone retail, small
office, warehouse and light manufacturing buildings, which tend to be
among the older properties along the highway. The Study Area also
includes multi-tenant strip-malls of varying age and size. The largest and
most up-to-date malls are located west of SW 198th Avenue. Finally, the
highway offers convenience and drive-thru businesses such as gas
stations, convenience stores and fast food restaurants.
This auto-oriented commercial character persists even in the 185th
Avenue and TV Highway commercial area and will be one challenge to
achieving a walkable town center.
Access and Visibility. Generally, TV Highway offers excellent visibility for
businesses due to the high volume of through traffic in the area. Vacancy
is low in the Study Area, even in smaller and older properties.
The accessibility of properties differs significantly between the north and
south sides of the highway. The north side features direct access on and
off TV Highway. A majority of businesses, in particular the strip-mall and
convenience businesses, are located north of TV Highway.
The south side of the highway features the barrier of the heavy rail tracks,
which means businesses on this side actually front SW Shaw Street, with
many fewer access points from TV Highway. The businesses on this
frontage street are a mixture of older, local businesses generally in small
spaces, and larger businesses that can still take advantage of the high
visibility but require fewer convenience stops from customers. These
include auto shops, self-storage, and light-industrial uses.
Given the continued complications to access presented by the rail line,
this bifurcation is likely to persist.
Retail Lease Rates. There was a wide range of lease rates identified in the
Study Area given the range of property types. In general, properties with
an anchor business such as a grocery store, large drug store, or
department store can achieve higher lease rates than smaller properties
and single-tenant properties. Properties north of the highway capture
significantly higher rates than to the south.
On average, the Study Area features retail lease rates similar to averages
in other parts of the Hillsboro and Beaverton market. This is likely due to
the high-traffic nature of the street, and its central location between
largely residential areas to the north and south.
Retail Demand. There is sufficient projected future demand in the Study
Area to drive new retail development, attract new tenants and new types
of businesses, and spur some redevelopment of existing properties. The
buildout of South Hillsboro will bring with it competition, in the form of
large new commercial centers planned for the area. However, South
Hillsboro will also bring thousands of new households, likely with above
average incomes for the area, who are likely to increase the customer
base. On balance, South Hillsboro should improve the business climate in
the Study Area.


SECTION 3
3-1
3 Currently Feasible Development Forms This section discusses the development forms that are currently the most feasible for new market-driven development in the Study Area. The development forms discussed here do not reflect the impact of public policies, funding tools, and design initiatives which might result from this planning process, and might influence the density and design of what is ultimately developed at the site.
Low-Rise vs. Mid-Rise Development The density of development forms is driven by achievable pricing/rent levels at the site in question. In a metropolitan environment, the highest rents and land values are typically found in the center of the city. Not coincidentally, this is where the most density occurs in the built environment. The central city is where high-rises, full-site coverage buildings, and parking garages are found. In short, the higher rent levels achievable in the city center justify the cost of more intense use of the land.
As one moves away from the central city, towards the suburban environment, achievable rents and land values tend to decrease steadily. In most suburban environments, achievable rent levels will support low-rise construction. (“Suburban” in this context means anything outside of Downtown Portland, and the immediately surrounding inner neighborhoods.)
Low-rise development is typically limited to two or three stories, and utilizes wood frame construction. The shift from four to five stories often includes switching to concrete and steel frame construction, which adds substantial cost. Unless achievable rents also rise, a building
that is feasible with low-rise construction can become infeasible by adding a single story.
Major factors which increase the cost for denser development can include materials (i.e. steel), structured parking, specialized labor and equipment, building elements such as elevators and firewalls, and costs of entitlement and the approval process. Because of this dynamic, most locations outside of Portland’s central city face difficulty in achieving a built form over three stories in height without subsidy.
The currently achievable rent levels in the Study Area will limit some of the development types that the market is likely to bring to the area. However, in an environment where most existing uses are single-story with ample surface parking, significant changes in density and design can be achieved while still relying on “low-rise” wood construction to control costs. Two- to three-story buildings, perhaps with reduced parking and other design considerations, can greatly increase the intensity of land use, without necessitating the higher construction costs of concrete and steel mid-rise buildings.
Likely Residential Forms Currently, the prevalent multi-family rental development type in the Study Area is a two-to-three story walk-up garden apartment, with surface parking. Such properties are wood construction, with apartment flats and occasionally two-story units. Such properties generally feature an FAR of .75 or less, and commonly no more than 0.5 FAR. The achieved density may be anywhere from 14 to 30 dwelling units per acre.
The following table presents examples of two common suburban development forms.

3-2
Chart 3.1. Low-Rise Residential Development Forms Garden Apartment or Condominiums with Surface Parking
Typically wood frame construction with surface parking, carports or stand-alone garages. Construction is usually two to three stories high, with a density approaching 30 units per acre. This is a predominant form outside the central city.
Attached Duplex/ Townhomes
Also typically wood frame, these units often have parking under the unit from street or back alley. Projects can be fee simple or with condominium ownership of the ground. 15 to 22 units per acre.
Source: Johnson Economics LLC
Attached ownership condos become rarer as one moves away from the central city. Typically, if condos are found in the suburbs it is in a specialized environment such as on a golf course, or in a retirement village. During the heated real estate market of a decade ago, condo development began to spread from its traditional location in the central city, driven by high demand and pricing. This market has softened considerably.
JOHNSON ECONOMICS believes it is unlikely that the market will deliver condos to suburban communities in any great number for the foreseeable future. This is because houses in these areas remain relatively affordable in comparison to the pricing level of a new-construction condo unit. As the Study Area develops with attractive amenities over time, condominium development may become more likely.
Ownership townhomes are a more viable development form in outer locations than condo flats. As recent trends show, attached single-family units (i.e. attached townhomes on separate tax lots) are an increasingly common form of ownership housing in the Study Area. This is likely to continue, with townhome construction more common than detached single family home construction as buildable land becomes scarce.
Townhomes can achieve a density of 16 to 22 units per net acre. Denser housing forms are more likely to be built as rental apartments than condo units in this submarket.
Likely Commercial Forms Low-rise commercial buildings are the most likely development type. Standalone retail is almost always single-story outside of an enclosed mall environment. Typical FAR for suburban retail is 0.2 to 0.3 to allow for ample parking. Standalone office development in the area will likely be one to two stories, served by surface parking.
It should also be noted that available parking is important to retail success. Parking needs to be convenient, but can be formatted in different ways – for instance, public parking lot or shared parking for a district. Storefront businesses with ample on-street parking or perhaps a lot within convenient walking distance may not require surface parking of their own.

3-3
For the time being, the most feasible forms of commercial development in the Study Area will remain auto-oriented strip development similar to today’s pattern. New multi-tenant shopping centers will seek one medium to large business to anchor the project. Smaller shopping centers without a strong anchor are less likely to be built speculatively. The corridor will remain attractive to convenience businesses such as gas stations and fast food restaurants.
Planning efforts such as Aloha Tomorrow have the potential to alter development patterns in the future and encourage different business types and more walkable environment.
Mixed Uses There is potential to achieve a limited amount of vertical mixed-use in a well-planned suburban environment. This usually entails two stories of residential or office space above a retail ground floor. While generally served by surface parking, the parking ratio may be lower, with lots located to the side or rear of buildings. Trying to focus mixed use development in a limited geography (i.e. a town center) can help build a self-reinforcing sense of place, and allows the greater density of uses to support each other. Spread across the Study Area in a disjoined way, isolated mixed use development is less likely to be successful.
Achieving mixed-uses in the Study Area may be challenging from a feasibility standpoint. The greatest barrier is often higher development costs than low-rise single-use buildings, which requires higher achievable rents to justify. Some additional costs associated with mixed uses include the logistics of separating the uses, and increased design, construction and entitlement costs associated with developing a more complex and unfamiliar building type.
The following is an example of low-rise suburban mixed-use development.
Chart 3.2. Low-Rise Mixed Use Development Forms
The development forms discussed here do not reflect the impact of public policies, funding tools, and design initiatives which might result from this planning process, and might influence the density and design of what is ultimately feasible in the Study Area.


SECTION 4
4-1
4 Development Considerations This section provides a general discussion of factors which impact the pace of development or redevelopment in a neighborhood. There is a perception that redevelopment, of commercial properties in particular has been slow in the Study Area. At the same time, this project is carefully considering the displacement pressure that new growth and development might put on households and businesses.
4.1.1 Drivers of Development Risk. At the most basic level the pace of development will be driven by perceived demand for real estate in a market and the achievable pricing. If demand and pricing are known to be strong, the perceived risk is reduced for developers, property owners, lenders and investors.
Unproven areas will have higher perceived risk, as will development forms that have not yet been tried in that market. When perceived risk of development is elevated, developers and investors demand a higher level of return from the project to compensate for the increased risk. If there is not a higher rate of return, the developer will pursue safer, more proven markets.
There are many areas of risk in real estate development including the following:
• Scale and Time – Most development projects beyond building a singlehome require a significant amount of capital to realize, often in themillions of dollars. Loans are most often required which represent alarge and binding obligation for the developer. At the same time,commercial development projects may take multiple years to complete,requiring upfront investment in a project that is unprofitable untilcompletion, and entails carrying costs during the process.
• Entitlement – Securing entitlements for development is often anuncertain and time consuming portion of the development process. Evenwhen the proposed development represents an outright allowed useunder the code, a project may be subject to issues such as design reviewrequirements and neighborhood outreach which may impact entitleduses and/or add time to the process.
• Financing – Financial commitments can be fluid during the developmentprocess, with lenders and/or equity partners backing out of deals orrenegotiating terms mid-development. These players can also limitflexibility. In addition, financing commitments are subject to appraisal,which always carries risk.
• Construction – There are many risk factors associated with construction.The cost of materials can fluctuate significantly, timing delays can impactcontractor availability windows, unforeseen problems may emergeduring site-work, etc.
• Market – Actual achievable rent levels and/or sales prices may besignificantly different than assumed at the time development wasinitiated. In addition, capitalization rates (a measure of value set by themarket) can shift significantly, which has a pronounced impact onincome properties.
Cost of Construction. Cost to develop is another key determinant on final development forms. As a general rule, the higher density development forms have a higher cost per square foot to construct (Chart 4.1). This is offset by a greater achievable density (units/acre), which has value when the achievable price is higher than the cost of construction excluding land.
However, when achievable pricing is below construction costs, there is no marginal value associated with the increase in density and development forms.

4-2
Chart 4.1. Development Forms from Less to More Density
Highest and Best Use. There are many considerations on whether a property or area is providing its “best use” in a general sense, including planning goals, social goals, equity, neighborhood fabric, etc. But for the purposes of this
discussion, a developer considering redevelopment of a property will usually seek to determine the “highest and best use” in the economic sense.
This term has a particular meaning in real estate development, which is the use that provides the best economic return, which leads to the highest value for the underlying land. The value of the underlying land is referred to as the “residual land value”.
For instance, under an obsolete use, a parcel may have a value of X. However, for a new use with a higher achievable rent and perhaps increased density, the developer may be willing to pay 2X for the parcel (i.e. for the buildable land). Under the new, more productive use, the land itself is literally worth more than the existing property (land and building) is worth under its current use.
4.1.2 Challenges to Redevelopment Often a property or area may not be attracting redevelopment activity despite appearing to be a good candidate for new uses. What most often happens in these cases is that the existing property, while it may seem obsolete or in poor condition, still retains enough total value under its existing use (land and building) that it would cost too much to purchase as a building site for a new use.
While the new use would be able to achieve higher rents and be more economically productive, it is not enough of an improvement to overcome the remaining value in the existing use.
Another factor may be costs in addition to land purchase, which may mean site clean-up costs, liens, entitlement issues. These costs should be, but are not always, reflected in the purchase price as a discount. The high cost and risk of preparing the site for redevelopment are why defunct gas station, dry cleaners and other potentially contaminated sites often sit vacant for very long periods.
For these reasons, areas which seem like good candidates for redevelopment can persist for some time if the underlying land has not become valuable enough to justify new uses.
Development Form Description Example Photo Duplex/Townhomes Also typically wood frame, these
units often have parking under the unit, from the front or an alley. Projects can be fee simple or with condominium ownership of the land and common area elements.
Type V (wood-framed) Construction with Surface
Typically wood frame construction with surface parking, carports or stand-alone garages. Construction is usually two to three stories high, with a density approaching 30 units per acre. This is the predominant multi-family form in most suburban communities.
Type V (wood-framed) Construction over Concrete Podium
Wood frame and/or steel stud construction over a single story concrete podium. This construction type is more common than mid-rise in communities where achievable pricing is somewhat lower. It is seen often on infill sites in the Portland Metro area, and is more common in suburban environments than mid-rise development.
Mid-Rise Steel and concrete construction, limited in height to 4-7 stories. In Oregon, these are mostly seen in inner Portland neighborhoods, in areas in which a high-rise solution is considered too large or costly in scale. This form has not been done in the Aloha area to-date, but can be found in Hillsboro and Beaverton.

4-3
Redevelopment in the Study Area. From this analysis, it appears that achievable pricing in the Study Area is high enough to attract some redevelopment and infill development of residential uses, both ownership and rental. This will differ from site to site based on the age and condition of the existing use, the size of the parcel and how many new units it can accommodate. As discussed in the previous section, the most likely residential forms are likely to remain low-rise attached buildings of three stories or less. In the current market, this activity is likely to take place in the interior of neighborhoods, off of the highway itself.
Currently, redevelopment of commercial properties along the Highway may remain more of a challenge. This is because achievable commercial lease rates are still modest enough that they will not justify the cost of redevelopment of most sites. This is particularly true south of the highway on Shaw Street where achievable lease rates are lower.
Commercial lease rates are higher at larger shopping centers with an anchor tenant, such as a grocery or department store. A new shopping center may be a potential user of new development. However, finding a parcel of sufficient size or assembling a collection of smaller parcels presents a challenge as this strip is largely built out.
It is possible that the development of a significant new shopping center(s) at South Hillsboro, along with the thousands of new households in that planning area, may change the dynamics of the study area sufficiently to entice new retailers. These retailers may refurbish older shopping centers or create new ones, however auto-oriented shopping center formats are likely to remain the dominant form.
There are areas in which public policy can impact the primary components of a highest and best use determination. The following categories (Chart 4.2) reflect some policy-sensitive variables and/or market interventions that can impact the highest and best use
determination. These levers can either raise achievable pricing, reduce the cost to develop, or improve the financial returns through lending terms of public partnership:
Chart 4.2. Potential Public Policy Levers on Development
Future phases of this project will discuss in more detail the public programs and policies which will impact future development in the Study Area.
Tradeoffs of Redevelopment. This project is particularly focused on identifying ways to prevent residential and commercial displacement from the Study Area (see next section). It is important to note the same factors which make development more likely (rising neighborhood popularity, property values and rents) are those which contribute to displacement. Public redevelopment programs which encourage economic and real estate revitalization must be cognizant of how they might unwittingly contribute to gentrification and displacement.
AMENITIES
HC TRANSIT
PUBLIC REALM
SDC WAIVERS
LAND WRITE-DOWNSPARKING MANAGEMENTVERTICAL HOUSING TAX CREDITSLENDING TERMS
LENDING TERMS
MASTER LEASESPUBLIC INVESTMENTS
COST TO DEVELOP
THRESHOLD RETURN
HIGHEST AND BEST USE
ACHIEVABLE PRICING

5-4
5 Displacement Considerations This section provides a general discussion of factors which may put residents and/or businesses of an area at risk for displacement. Subsequent phases of this project will address tools and solutions for addressing potential displacement in the Study Area.
5.1.1 Factors behind the trend There has been much discussion and study in recent years of displacement and the related topic of gentrification in many metro areas. The renewed interest in this subject is driven by many inter-related trends, such as:
The reversal of suburban flight since the 1990s, as many citieshave revitalized into more desirable places for people to live andwork, shedding prior decades of stigma;
The accompanying gentrification as new residents have broughthigher incomes, education levels and other resources intopreviously low amenity/low cost neighborhoods;
Neighborhoods which are considered less desirable nonethelessoften offer more affordable housing options to middle and lowerincome households. These areas also often feature more stablehousing due to a slower rate of change and improvement overtime;
Since the bust of the “housing bubble” in 2006/7, a greater shareof households found themselves in precarious housing situations,and the home ownership rate has fallen;
At the same time, much of the nation had experienced a longperiod of low production of new rental apartments, as developersfocused on the hot ownership market. This left a dramatic
shortfall of available rental units coming out of the recession that is still being met;
The Portland Metro area has experienced all of these trends, butfurther exacerbated by the current attractiveness of the region fornew residents, combined with a healthy economy;
On the margin, new households moving into the Metro regiontend to have higher education, higher income and/or are bringhome equity and other resources from higher-priced markets;
New job creation has been strong in the Metro region, and adisproportionate share of these jobs are in technology andprofessional services offering relatively high average incomes;
The Metro region features an Urban Growth Boundary (UGB)which restricts how quickly suburban markets can build outwardsand swiftly add new housing in times of high growth. The costs ofinfrastructure and land development further slow build-out of thenew lands which are brought into the UGB;
All of these factors and more have created pressure in high-demand, low-supply markets such as the Metro region whichresults in higher home prices and rents. After starting in innerPortland and Washington County employment centers, thispressure is increasingly felt in every corner of the Metro area.
Over the last decade in the Portland Metro area, many lowerincome households have been displaced from centralneighborhoods to outer neighborhoods and suburbs. Currently,the Metro area is experiencing a second wave, as many of thesesame suburban communities now suffer themselves from risinghousing costs and redevelopment pressures.
The impacts of Portland’s new “inclusionary zoning” policy remainto be seen. While it will provide some affordable housing units inPortland, it might also have the impact of pushing developers tosuburban markets to avoid the new requirement.

5-5
5.1.2 Who is impacted by displacement? Displacement is one symptom of the process of gentrification. “Gentrification” is a charged term, which can have different definitions depending on the context. The process has multifaceted socio-economic drivers and impacts.
For the sake of this discussion, the most important definition is that:
Gentrification is a process which brings new households and businesses with greater financial resources into areas which have historically been occupied by households and businesses with fewer financial resources.
The natural economic outcome of this process is the displacement of some of the households and businesses with fewer resources over time. However, typically displacement is not distributed evenly:
First and foremost, displacement is a much greater risk forrenters than owners. By definition, renters are more susceptibleto the whims of outside forces in their housing situation,including landlords and the general market. While a renter maylock in stability with a 6 or 12 month lease, there is considerableuncertainly at the end of that period, particularly in agentrifying market.
Homeowners have often locked in their housing costs for manydecades through a mortgage, while Oregon’s property tax lawsensure that tax bills won’t climb too quickly even if theneighborhood is greatly appreciating in value. If aneighborhood has been low cost for some time, many long-timeowners have paid off their mortgage, or have small monthlypayments based on a low purchase price.
Because of this dynamic, gentrification can be felt verydifferently by renters vs. property owners. Many owners havethe ability to stay in the neighborhood even as prices rise
around them. They also have the choice to sell their property and capitalize on the rising value. They may consider the increasing prices to be a positive trend.
Renting housing is correlated with lower income levels, andlower income levels are correlated with a range of demographiccategories including young people, single parents, disabled, andracial and ethnic minorities. Therefore these groups may bedisproportionately impacted by displacement depending on theprofile of the neighborhood.
Business displacement tends to lag residential gentrification,often by many years. In the early years of gentrification, thereis often long-neglected and vacant commercial space in theneighborhood which can be used for new and pioneeringbusinesses. Being underused, this type of space oftenrepresents a lower rent option compared to establishedneighborhoods. The pioneering small businesses taking achance on the neighborhoods in the early years may well sufferfrom rising rents in later years. Despite this, these pioneeringbusinesses may actually be viewed as part of the problem,bringing change and attracting newcomers to the area.
Once residential gentrification progresses and the cache of theneighborhood and increased spending power of new residentsis generally apparent, then the existing commercial space willmostly be rehabbed and leased and business lease rates willbegin to climb. When achievable lease rates get high enough,redevelopment of existing properties into new space becomesmore feasible.
As with residents, businesses that own their property will be ina much more stable situation than businesses that lease. Smalland emerging businesses are more likely to lease thanestablished businesses. However, commercial property owners

5-6
are more susceptible to rising property tax rates than homeowners.
It is important to remember that gentrification and displacement are the cumulative result of thousands of choices being made by individuals in the marketplace. This is why gentrification can seem so difficult for communities to address, and why individuals can feel powerless to change the trend even as they buy or sell a home in the neighborhood for a new higher price.
