ncomm ncml commodity market monitor · mandi price in rs/ quintal 27-10-2017 17 -10 2017 %change...
TRANSCRIPT

Date: 31-10-2017
NCML Commodity Market Monitor
HOME
NCoMM
NCML COMMODITY MARKET MONITOR
Cotton | Sugar | Soybean | RM Seed | Castor seed | Turmeric | Jeera
OUTLOOK
OTHER DATA Sowing progress | Advance estimates | Kharif and rabi MSP
WEEKLY ONLINE QUIZ
Click on the link above to participate
Participate in our weekly quiz and get a chance to win Amazon gift coupons. Winners will be announced in next report and rewarded.

Date: 31-10-2017
NCML Commodity Market Monitor
Fundamentals- Domestic & International
Price Trend & Technicals
14000
16000
18000
20000
22000
24000
No
v-15
De
c-15
Feb
-16
Ap
r-16
Jun
-16
Au
g-1
6
Oct
-16
De
c-16
Feb
-17
Ap
r-17
Jun
-17
Au
g-1
7
Oct
-17
Cotton - 29 mm - Rajkot
COTTON
Sharp increase in the areacge this year raising the expectation of
bumper production this year has taken a toll on the cotton prices. In
the days ahead we expect prices to continue trading under pressure
till the time they are hovering below Rs 18550 and test the next
support mark of Rs 18170 and even crack it. A sustainable breach of
Rs 18150 will result in further extension of the ongoing declining
streak. On the other side the resistance stands at Rs 18780 and a
move above it will result in further buying towards Rs 19240 levels.
But considering the current sentiments the chances of prices testing
the resistance level in the near future looks very less.
IMPORTANT LEVELS
S2 S1 CMP R1 R2
17700 18170 18415.45 18550 19240
Outlook: Prices will remain subdued till they are trading below Rs 18550. A move towards Rs 18150 can be seen.
• Additionally, there is a good carryover stock from the last season. India imported about 1.85 million bales (170 kg per bale) during CY 2016-17 till
June, up by 130% compared to previous year imports, as per data released on Department of Commerce. However, exports have been down by
16 per cent in CY 2016-17 to 5.68 million bales compared to 6.77 million tonnes in previous year.
• Bumper production would help India sell 7.5 million bales of cotton in the world market in 2017/18 season starting in Oct. Even though cotton
yarn exports have been on a decline, Indian garment exports have increased by 15% year-on-year which indicates that the country will consume
more cotton in coming season.
• The Gujarat government has declared a bonus of Rs 100 per 20 kg for cotton to be paid to farmers over and above the minimum support price
(MSP) to farmers who sell their produce to the Cotton Corporation of India. Gujarat produces three varieties of cotton whose MSPs range from
Rs 804 to Rs 864 per 20 kg. The bonus amount will be the same for all the varieties.
• According to International Cotton Advisory Committee (ICAC), global cotton output is likely to rise 10% to 25.4 million tonnes in 2017-18 (from
23.05 million tonnes previous year) on expected production increase in India and the US. The higher forecast is due expansion in acreage by 3
million hectares to over 32 million hectares across the world and stability of global prices in 2016/17.
• The most significant portion of the increase will come from the USA which should record an output of 4.6 million tons in 2017/18, up 23%
compared to the previous season. Other producers whose output is expected to rise include India, China, Pakistan & Brazil..
• Overall score of 2.7 shows bearishness in cotton prices.
Fundamental Summary
Price Drivers Impact Weightage Score (1-5)*
Sharp increase in cotton area sown Bearish 25% 2
Some damage reported due to erratic rains Bullish 10% 4
Bumper crop expectation despite damage Bearish 25% 2
Spurt in demand by textile mills Bullish 15% 4
Higher cotton garment exports Bullish 10% 4
High global production and availability Bearish 15% 2
Overall fundamental score 2.7
*Bearish; 2. Marginal Bearish; 3. Consolidation; 4. Marginal Bullish; 5.Bullish
• After hitting the lowest point in nine months, cotton prices recovered
marginally due to sudden spurt in cotton demand from textiles mills and on
some reports of crop damage due to erratic rainfall in the producing centres.
• The area under cotton increased sharply to 122.59 lakh ha till 29 September,
19.27% higher than 115.01 lakh ha sown in the last year till the same date.
• Despite some reported damage, the traders are estimating the cotton crop size
at 375 lakh bales this year against last year’s 337.25 lakh bales on better use of
seed and farm techniques. Thus the markets are going to be fully dominated by
supplies resulting into a subdued price trend this year.
BACK TO TOP
Mandi Price in Rs/ Qtl.
27-10-2017 17-10-2017 %Change
Akola (29 mm) 10818.5 10888 -0.64
Rajkot (29 mm) 10938 11075 -1.24
Abohar (28 mm)
9650 9518 1.39

Date: 31-10-2017
NCML Commodity Market Monitor
Price Trend & Technicals
Not much of the movement was seen in the sugar prices over the
last fortnight. Festive demand and delay in crushing have
collectively lent some support to the prices recently. Prices are
sustaining themselves above the technical support level which is
preventing prices from declining despite the expectations of higher
production, imposition of stock limits and allowing of concessional
imports of the government. The technical undertone is still positive
but any sharp spike from here on looks unlikely. Only a breach of Rs
3725 will result in generation of fresh selling pressure towards Rs
3675 mark. Recovery will continue till then and prices might move
steadily towards Rs 3825 before witnessing selling pressure again.
IMPORTANT LEVELS
• The sugarcane crushing operations are set to pick up in full force in
November. More than 512 mills are likely to operate this year as there is
good sugarcane output owing to better rains. Last year, only 490 mills were
able to operate because of tight supply of cane.
• As on 29 September, sugarcane acreage is up by 9.44% at 49.95 lakh ha
against 45.64 lakh ha last year till same date. Cane production may cross
3300 lakh tonnes against 3067.2 lakh tonnes last year.
• Indian Sugar Mills Association has forecast India’s sugar production at 25.1
million tonnes for the current crushing season (October 2017 to September
2018), a sharp increase from of 24% 20.3 mt the previous year.
Mandi Price in Rs/ Quintal
27-10-2017 17-10-2017 %Change
Muzzafarnagar 3770 3775.05 -0.13
Kolhapur 3617.8 3635.65 -0.49
Delhi 3814.05 3843.8 -0.77
• Production in UP is expected to be higher y-o-y by 19% at 10.5 mn t (8.8 mn t) this year. Maharashtra’s production, which came down to 4.2 mn
t in 2016-17, is expected to double to 8.4-8.5 mn t this year. Karnataka is also expected to see its production rise by over 80 per cent to 4 mn t.
Sugar mills in Maharashtra will begin crushing operations on 1 November.
• High demand by stockists and bulk consumers to meet festive demand is keeping the sugar season prices firm currently as the stocks are
running low. A large portion of carryover stocks of 7 mn tonnes was consumed during the season as sugar production last year was very low.
• UP government has increased the State Advised Price (SAP) of sugarcane by Rs 10/qtl over previous year from Rs 305/quintal to Rs 315/quintal.
• CACP has recommended Rs 20 per quintal hike in the fair and remunerative price of sugarcane at Rs 275 per quintal for next season,
• National Federation of Cooperative Sugar Factories (NFCSF) and the Indian Sugar Mills Association (ISMA) jointly introducing an online sugar
marketing platform named Indian sugar emarket, for greater access and better price realisation
• The global sugar production in 2017-18 is expected to climb by nearly 7% to a record 179.3 million tonnes. Brazil is expected to produce 39.38
million tonnes of sugar in 2017-18, 1.8% higher than the sugar produced last year in 2016-17.
• Brazilian mills increased the amount of cane used for ethanol production in the first half of October, and reduced sugar output. Lower Brazilian
sugar output in October led to upward movement in International sugar futures.
• Overall fundamental score of 3.2 shows a mild bullish undertone till the time crushing begins full force and new season supplies hit the market.
BACK TO TOP
S2 S1 CMP R1 R2
3675 3725 3770 3825 3900
Outlook: Mild recovery can be seen towards 3825. Selling will emerge only on a breach of Rs 3725 for Rs 3680 mark.
2,100
2,400
2,700
3,000
3,300
3,600
3,900
De
c-13
Ap
r-14
Au
g-1
4
Jan
-15
May
-15
Se
p-1
5
Jan
-16
May
-16
Se
p-1
6
Jan
-17
Jun
-17
Oct
-17
Sugar - M-grade : Muzaffarnagar
Fundamental Summary
Price Drivers Impact Weightage Score (1-5) *
Higher acreage of sugarcane & expected rise in cane production for 2017-18 Bearish 20% 2
Higher crushing and sugar output expected in 2017-18 Bearish 20% 2
High seasonal demand of sugar Bullish 25% 4
Crushing not picking full force before November as was advised by govt Bullish 15% 4
Lower 2016-17 ending stocks season due to lower 2016-17 production Bullish 20% 4
Overall fundamental score 3.2
*Bearish; 2. Marginal Bearish; 3. Consolidation; 4. Marginal Bullish; 5. Bullish
Fundamentals- Domestic & International
Mandi Price in Rs/ Quintal
02-06-2017 26-05-2017 %Change
Muzzafarnagar 3915 3892.5 0.58
Kolhapur 3837 3847.5 -0.27
Delhi 3932.55 3920 0.32
Fundamentals- Domestic & International
SUGAR
Date: 31-10-2017
NCML Commodity Market Monitor
Price Trend & Technicals
2700
2930
3160
3390
3620
3850
4080
4310
Jan
-15
Ap
r-15
Jul-1
5
No
v-15
Feb
-16
May
-16
Se
p-1
6
De
c-16
Ap
r-17
Jul-1
7
Oct
-17
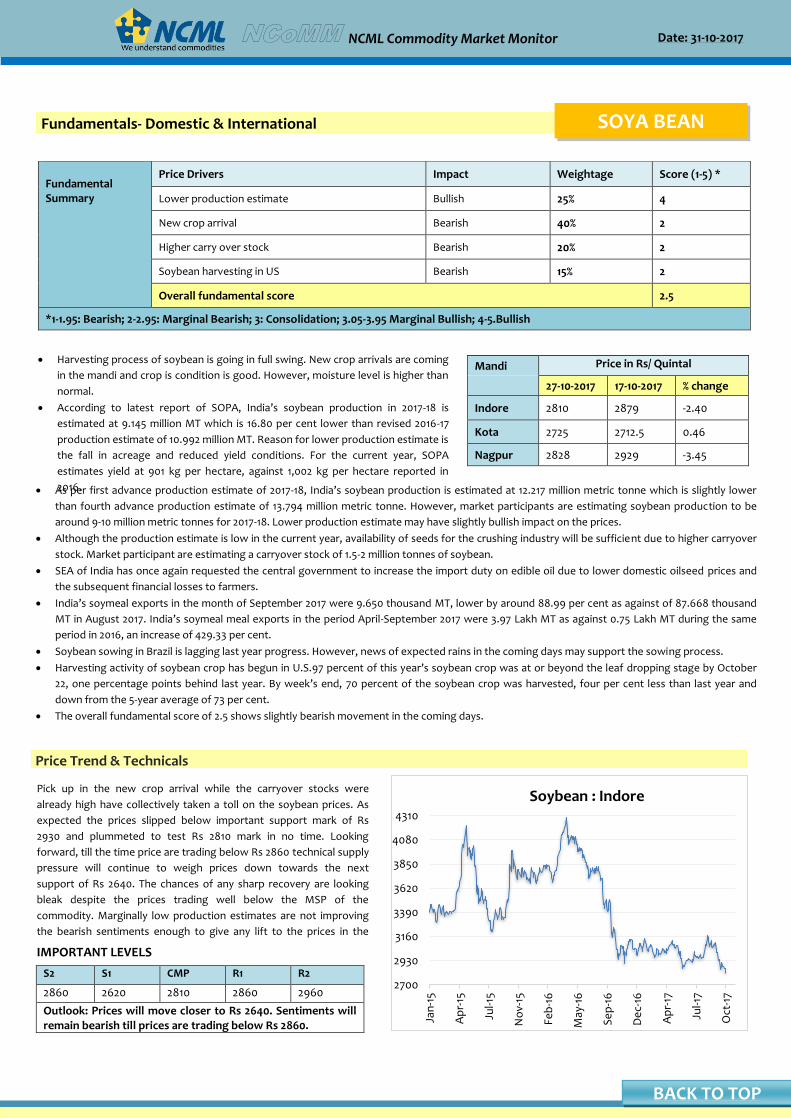
Soybean : IndorePick up in the new crop arrival while the carryover stocks were
already high have collectively taken a toll on the soybean prices. As
expected the prices slipped below important support mark of Rs
2930 and plummeted to test Rs 2810 mark in no time. Looking
forward, till the time price are trading below Rs 2860 technical supply
pressure will continue to weigh prices down towards the next
support of Rs 2640. The chances of any sharp recovery are looking
bleak despite the prices trading well below the MSP of the
commodity. Marginally low production estimates are not improving
the bearish sentiments enough to give any lift to the prices in the
near team.
IMPORTANT LEVELS
S2 S1 CMP R1 R2
2860 2620 2810 2860 2960
Outlook: Prices will move closer to Rs 2640. Sentiments will remain bearish till prices are trading below Rs 2860.
• Harvesting process of soybean is going in full swing. New crop arrivals are coming
in the mandi and crop is condition is good. However, moisture level is higher than
normal.
• According to latest report of SOPA, India’s soybean production in 2017-18 is
estimated at 9.145 million MT which is 16.80 per cent lower than revised 2016-17
production estimate of 10.992 million MT. Reason for lower production estimate is
the fall in acreage and reduced yield conditions. For the current year, SOPA
estimates yield at 901 kg per hectare, against 1,002 kg per hectare reported in
2016.
Mandi Price in Rs/ Quintal
27-10-2017 17-10-2017 % change
Indore 2810 2879 -2.40
Kota 2725 2712.5 0.46
Nagpur 2828 2929 -3.45
• As per first advance production estimate of 2017-18, India’s soybean production is estimated at 12.217 million metric tonne which is slightly lower
than fourth advance production estimate of 13.794 million metric tonne. However, market participants are estimating soybean production to be
around 9-10 million metric tonnes for 2017-18. Lower production estimate may have slightly bullish impact on the prices.
• Although the production estimate is low in the current year, availability of seeds for the crushing industry will be sufficient due to higher carryover
stock. Market participant are estimating a carryover stock of 1.5-2 million tonnes of soybean.
• SEA of India has once again requested the central government to increase the import duty on edible oil due to lower domestic oilseed prices and
the subsequent financial losses to farmers.
• India’s soymeal exports in the month of September 2017 were 9.650 thousand MT, lower by around 88.99 per cent as against of 87.668 thousand
MT in August 2017. India’s soymeal meal exports in the period April-September 2017 were 3.97 Lakh MT as against 0.75 Lakh MT during the same
period in 2016, an increase of 429.33 per cent.
• Soybean sowing in Brazil is lagging last year progress. However, news of expected rains in the coming days may support the sowing process.
• Harvesting activity of soybean crop has begun in U.S.97 percent of this year’s soybean crop was at or beyond the leaf dropping stage by October
22, one percentage points behind last year. By week’s end, 70 percent of the soybean crop was harvested, four per cent less than last year and
down from the 5-year average of 73 per cent.
• The overall fundamental score of 2.5 shows slightly bearish movement in the coming days.
•
•
•
Fundamental Summary
Price Drivers Impact Weightage Score (1-5) *
Lower production estimate Bullish 25% 4
New crop arrival Bearish 40% 2
Higher carry over stock Bearish 20% 2
Soybean harvesting in US Bearish 15% 2
Overall fundamental score 2.5
*1-1.95: Bearish; 2-2.95: Marginal Bearish; 3: Consolidation; 3.05-3.95 Marginal Bullish; 4-5.Bullish
Fundamentals- Domestic & International SOYA BEAN
BACK TO TOP

Date: 31-10-2017
NCML Commodity Market Monitor
Price Trend &Technicals
3,500
3,750
4,000
4,250
4,500
4,750
5,000
5,250
Jun
-15
Au
g-1
5
Oct
-15
De
c-15
Feb
-16
May
-16
Jul-1
6
Se
p-1
6
No
v-16
Jan
-17
Ap
r-17
Jun
-17
Au
g-1
7
Oct
-17
Rapeseed & Mustard-Black - 42% oil content : Jaipur
As a result of the increased MSP some sudden upmove was
witnessed in the Mustard seed prices over the last few days despite
the weakness in the other oilseeds. . For any significant upside
move prices have to convincingly breach and trade above Rs 3990.
On the downside Rs 3890 is seen as immediate support and a slip in
prices below that will infuse renewed weakness in the counter. On
the other side sustained trading above Rs 3990will result in some
more rise in prices towards Rs 4085. We expect prices to breach the
immediate resistance of Rs 3990 and trade with positive bias
moving closer to the next resistance of Rs 4085.
IMPORTANT LEVELS
S2 S1 CMP R1 R2
3830 3890 3971 3990 4085
Outlook: Prices can see some more recovery, on a breach of Rs 3990, towards Rs 3830 levels.
• India has frozen the request to commercially release a locally developed
genetically modified (GM) mustard.
• The government has increased the minimum support price (MSP) of
mustard for the crop year 2017-18 to Rs 4000 per quintal from Rs 3700 per
quintal. The increase in MSP is expected to boost acreage and production
of mustard crop.
•
Mandi Price in Rs/ Quintal
27-10-2017 17-10-2017 % change
Jaipur 3971.75 3950 0.55
Alwar 3922 3870.5 1.33
Sriganga Nagar 3850 3800 1.32
• However, deficit rainfall received in the monsoon may affect the sowing of mustard crop in the coming rabi season. Lower monsoon rainfall leads
to lower moisture content in soil and water shortage in reservoirs.
• As per first advance production estimate of 2017-18, India’s mustard production target is estimated at 8.1 million metric tonne which is 1.54 per
cent higher than last year fourth advance production estimate of 7.977 million metric tonne. Higher production estimate may have a marginal
bearish impact on the prices.
• Mustard arrivals in the mandis have slightly increased as compared to the last week as spot prices has increased due to higher MSP announced by
government and higher miller demand. Millers are buying on expectation of improved winter demand.
• India’s mustard meal exports in the month of September 2017 were 26.40 (provisional) thousand MT, lower by 62.72 per cent against 70.82
thousand MT in August 2017. Average FoB price of meal in September is recorded at $236 per tonne which is slightly lower than average price of
$239 per tonne in the month of August.
• As per SEA recent data, rapeseed oil imports for period Nov. ‘16-Sept. ‘17 is recorded at 2.55 lakh tonnes which is 23.42 per cent lower than last
year import of 3.33 lakh tonnes in the same period. Higher domestic production estimate of mustard has made India less dependent on imports.
• The overall fundamental score of 2.8 shows range bound to slightly bearish movement in the coming days.
Fundamental Summary
Price Drivers Impact Weightage Score (1-5)*
Increase in MSP of mustard crop Bullish 20% 4
Higher arrivals in the mandi Bearish 20% 2
Domestic winter demand Bullish 20% 4
Higher production estimate Bearish 20% 2
Lower meal export demand Bearish 20% 2
Overall fundamental score 2.8
* 1. Bearish; 2. Marginal Bearish; 3. Consolidation; 4. Marginal Bullish; 5.Bullish
Fundamentals- Domestic & International RM SEED
BACK TO TOP
Date: 31-10-2017
NCML Commodity Market Monitor
Fundamentals- Domestic & International
Price Trend &Technicals
2800
3050
3300
3550
3800
4050
4300
4550
4800
Jan
-15
Mar
-15
Jun
-15
Se
p-1
5
De
c-15
Mar
-16
May
-16
Au
g-1
6
No
v-16
Feb
-17
Ap
r-17
Jul-1
7
Oct
-17
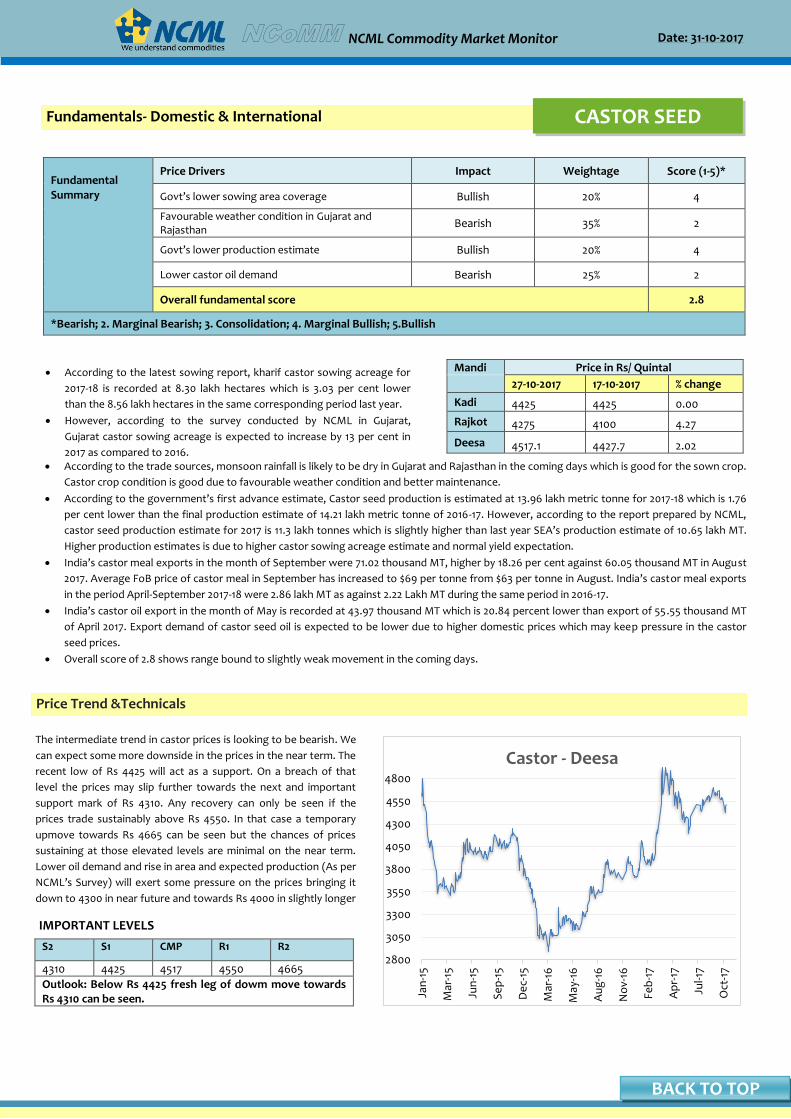
Castor - Deesa
CASTOR SEED
The intermediate trend in castor prices is looking to be bearish. We
can expect some more downside in the prices in the near term. The
recent low of Rs 4425 will act as a support. On a breach of that
level the prices may slip further towards the next and important
support mark of Rs 4310. Any recovery can only be seen if the
prices trade sustainably above Rs 4550. In that case a temporary
upmove towards Rs 4665 can be seen but the chances of prices
sustaining at those elevated levels are minimal on the near term.
Lower oil demand and rise in area and expected production (As per
NCML’s Survey) will exert some pressure on the prices bringing it
down to 4300 in near future and towards Rs 4000 in slightly longer
duration.
IMPORTANT LEVELS
S2 S1 CMP R1 R2
4310 4425 4517 4550 4665
Outlook: Below Rs 4425 fresh leg of dowm move towards Rs 4310 can be seen.
• According to the latest sowing report, kharif castor sowing acreage for
2017-18 is recorded at 8.30 lakh hectares which is 3.03 per cent lower
than the 8.56 lakh hectares in the same corresponding period last year.
• However, according to the survey conducted by NCML in Gujarat,
Gujarat castor sowing acreage is expected to increase by 13 per cent in
2017 as compared to 2016.
Mandi Price in Rs/ Quintal
27-10-2017 17-10-2017 % change
Kadi 4425 4425 0.00
Rajkot 4275 4100 4.27
Deesa 4517.1 4427.7 2.02
• According to the trade sources, monsoon rainfall is likely to be dry in Gujarat and Rajasthan in the coming days which is good for the sown crop.
Castor crop condition is good due to favourable weather condition and better maintenance.
• According to the government’s first advance estimate, Castor seed production is estimated at 13.96 lakh metric tonne for 2017-18 which is 1.76
per cent lower than the final production estimate of 14.21 lakh metric tonne of 2016-17. However, according to the report prepared by NCML,
castor seed production estimate for 2017 is 11.3 lakh tonnes which is slightly higher than last year SEA’s production estimate of 10.65 lakh MT.
Higher production estimates is due to higher castor sowing acreage estimate and normal yield expectation.
• India’s castor meal exports in the month of September were 71.02 thousand MT, higher by 18.26 per cent against 60.05 thousand MT in August
2017. Average FoB price of castor meal in September has increased to $69 per tonne from $63 per tonne in August. India’s castor meal exports
in the period April-September 2017-18 were 2.86 lakh MT as against 2.22 Lakh MT during the same period in 2016-17.
• India’s castor oil export in the month of May is recorded at 43.97 thousand MT which is 20.84 percent lower than export of 55 .55 thousand MT
of April 2017. Export demand of castor seed oil is expected to be lower due to higher domestic prices which may keep pressure in the castor
seed prices.
• Overall score of 2.8 shows range bound to slightly weak movement in the coming days.
•
Fundamental Summary
Price Drivers Impact Weightage Score (1-5)*
Govt’s lower sowing area coverage Bullish 20% 4
Favourable weather condition in Gujarat and Rajasthan
Bearish 35% 2
Govt’s lower production estimate Bullish 20% 4
Lower castor oil demand Bearish 25% 2
Overall fundamental score 2.8
*Bearish; 2. Marginal Bearish; 3. Consolidation; 4. Marginal Bullish; 5.Bullish
BACK TO TOP

Date: 31-10-2017
NCML Commodity Market Monitor
x
Price Trend &Technicals
13000
14000
15000
16000
17000
18000
19000
20000
Feb
-16
Ap
r-16
Jun
-16
Au
g-1
6
Oct
-16
De
c-16
Feb
-17
Ap
r-17
Jun
-17
Au
g-1
7
Oct
-17
Cumin Seed (Kala Jeera) - UnjhaProspects of higher sowing in Gujarat are high this year as a result
of higher prices last year & favrable pre sowing conditions. This will
be major factor playing on the jeera prices for some time from now.
Near term range can be pegged between Rs 18830 and Rs 19440.
Any significant move on the either side can only be seen on a
decisive move aboye any of the two levels. Below Rs 18830 we
might see a extension in decline towards Rs 18500. On the higher
side only a sustainable push beyond Rs 19430 can infuse some
positivity for an upmove towards Rs19700 -20000 levels.
IMPORTANT LEVELS
S2 S1 CMP R1 R2
18500 18830 19003 19440 19650
Outlook: Prices might trade rangebound within Rs 18830-19440 band.
• Subdued domestic and export demand followed by higher supplies
from the producing belts in Gujarat has kept pressure on Jeera.
• Market sentiments are strong in Jeera as the stock left is thin but the prices are likely to trade lower due to prospects of rise in Jeera acreage due to higher prices this year and good soil moisture.
• According to Traders Unjha based traders, fundamentals are strong in Jeera as limited stock is left in the market even though, the prices are weighed by the selling pressure by the stockiest.
Mandi Jeera: Price in Rs/ Quintal
27-10-2017 20-10-2017 % change
Unjha (NCDEX) 19003 18896 0.56
Rajkot 17000 16395 3.69
Jodhpur 18398 18296 0.55
• Farmers usually begin Jeera sowing around this time of the year but this year, sowing is delayed as the present temperature is around 35 degree
Celsius which is not adequate for the sowing. The idea and suitable temperature for Jeera sowing is below 30 degree Celsius.
• According to traders, Jeera stock in Gujarat were reported to be around 10 lakh bags (55Kg each) out of which 8-9 lakh bags are reported to be in
Unjha.
• Jeera per month consumption (Domestic and Export) is reported to be around 2-2.25 lakh bags keeping that in mind the stock will not be
sufficient until the new crop hits the market.
• According to market sources, India's exports of Jeera are likely to have risen 2 per cent on year to 70,000 tonnes in Apr-Sep due to lower stocks
in other major exporting nations. The country had exported 68,600 tonnes of the commodity in the corresponding period last year, according to
Spices Board of India.
• As per the latest available data from Department of Commerce, in the month of July 2017 Jeera export stood at 6,907.46 tonnes as against
8,406.52 tonnes in July 2016. As per market sources, India's Jeera shipment so far (April-August) likely around 60,000 metric tonnes versus
62,000 metric tonnes same period year ago. The total Cumin seed exported in 2016-17 stood at 122,992.91 tonnes.
• In 2016-17 Cumin seed harvest in India was 4.85 lakh tonnes as against 5.03 lakh tonnes harvested in 2015-16 according to the Spice Board of India.
• As on 29th October Jeera New stocks at NCDEX warehouses stood at 7063 metric tonnes as compared to 1919 metric tonnes.
• Overall fundamental score of 2.8 indicates that Jeera might be trading a range bound with bearish tone mainly due to weak demand.
Fundamental Summary
Price Drivers Impact Weightage Score (1-5)*
Expectation of higher acreage in coming season Bearish 20% 3
Buying at lower levels Bullish 20% 4
Weak domestic and export demand Bearish 25% 2
Tight global supplies Bullish 20% 3
Profit booking at higher levels Bearish 15% 2
Overall fundamental score 2.8
*1.Bearish; 2. Marginal Bearish; 3. Consolidation; 4. Marginal Bullish; 5.Bullish
Fundamentals- Domestic &International JEERA
BACK TO TOP
Date: 31-10-2017
NCML Commodity Market Monitor
Price Trend &Technicals
4800
5500
6200
6900
7600
8300
9000
9700
Jun
-14
Oct
-14
Mar
-15
Jul-1
5
De
c-15
Ap
r-16
Se
p-1
6
Jan
-17
Jun
-17
Oct
-17
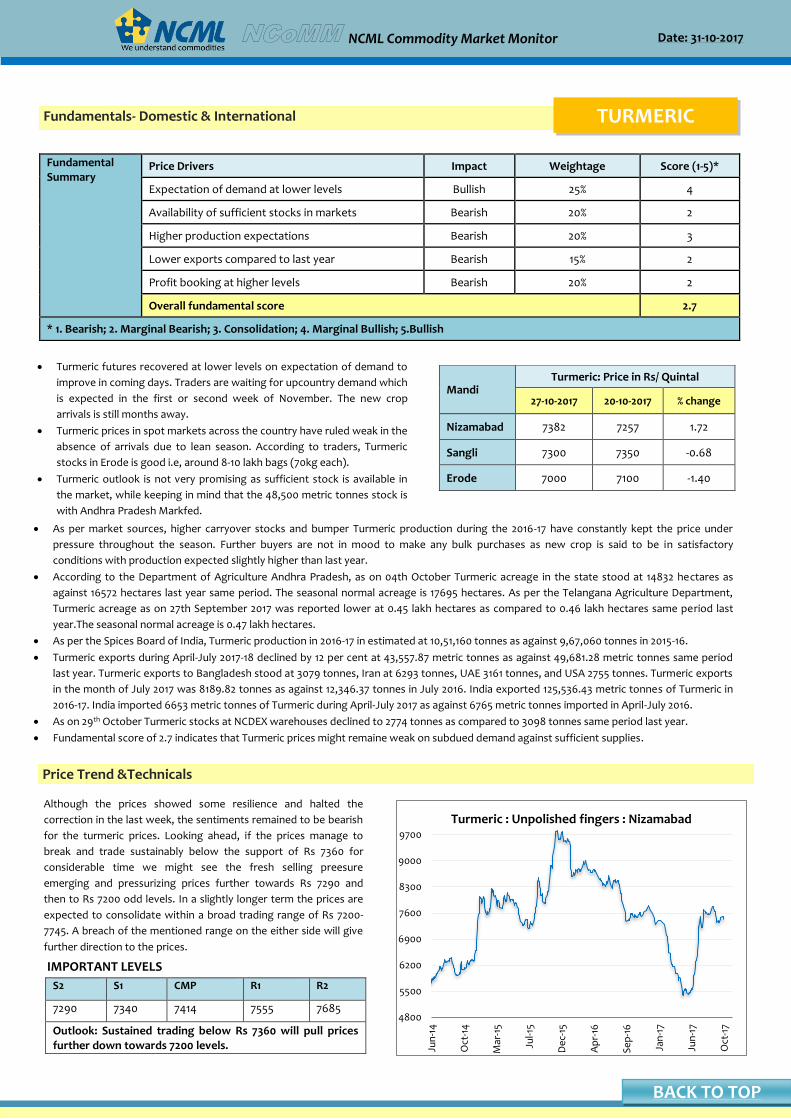
Turmeric : Unpolished fingers : NizamabadAlthough the prices showed some resilience and halted the
correction in the last week, the sentiments remained to be bearish
for the turmeric prices. Looking ahead, if the prices manage to
break and trade sustainably below the support of Rs 7360 for
considerable time we might see the fresh selling preesure
emerging and pressurizing prices further towards Rs 7290 and
then to Rs 7200 odd levels. In a slightly longer term the prices are
expected to consolidate within a broad trading range of Rs 7200-
7745. A breach of the mentioned range on the either side will give
further direction to the prices.
IMPORTANT LEVELS
S2 S1 CMP R1 R2
7290 7340 7414 7555 7685
Outlook: Sustained trading below Rs 7360 will pull prices further down towards 7200 levels.
Fundamentals- Domestic & International TURMERIC
• Turmeric futures recovered at lower levels on expectation of demand to
improve in coming days. Traders are waiting for upcountry demand which
is expected in the first or second week of November. The new crop
arrivals is still months away.
• Turmeric prices in spot markets across the country have ruled weak in the
absence of arrivals due to lean season. According to traders, Turmeric
stocks in Erode is good i.e, around 8-10 lakh bags (70kg each).
• Turmeric outlook is not very promising as sufficient stock is available in
the market, while keeping in mind that the 48,500 metric tonnes stock is
with Andhra Pradesh Markfed.
Mandi Turmeric: Price in Rs/ Quintal
27-10-2017 20-10-2017 % change
Nizamabad 7382 7257 1.72
Sangli 7300 7350 -0.68
Erode 7000 7100 -1.40
• As per market sources, higher carryover stocks and bumper Turmeric production during the 2016-17 have constantly kept the price under
pressure throughout the season. Further buyers are not in mood to make any bulk purchases as new crop is said to be in satisfactory
conditions with production expected slightly higher than last year.
• According to the Department of Agriculture Andhra Pradesh, as on 04th October Turmeric acreage in the state stood at 14832 hectares as
against 16572 hectares last year same period. The seasonal normal acreage is 17695 hectares. As per the Telangana Agriculture Department,
Turmeric acreage as on 27th September 2017 was reported lower at 0.45 lakh hectares as compared to 0.46 lakh hectares same period last
year.The seasonal normal acreage is 0.47 lakh hectares.
• As per the Spices Board of India, Turmeric production in 2016-17 in estimated at 10,51,160 tonnes as against 9,67,060 tonnes in 2015-16.
• Turmeric exports during April-July 2017-18 declined by 12 per cent at 43,557.87 metric tonnes as against 49,681.28 metric tonnes same period
last year. Turmeric exports to Bangladesh stood at 3079 tonnes, Iran at 6293 tonnes, UAE 3161 tonnes, and USA 2755 tonnes. Turmeric exports
in the month of July 2017 was 8189.82 tonnes as against 12,346.37 tonnes in July 2016. India exported 125,536.43 metric tonnes of Turmeric in
2016-17. India imported 6653 metric tonnes of Turmeric during April-July 2017 as against 6765 metric tonnes imported in April-July 2016.
• As on 29th October Turmeric stocks at NCDEX warehouses declined to 2774 tonnes as compared to 3098 tonnes same period last year.
• Fundamental score of 2.7 indicates that Turmeric prices might remaine weak on subdued demand against sufficient supplies.
Fundamental Summary
Price Drivers Impact Weightage Score (1-5)*
Expectation of demand at lower levels Bullish 25% 4
Availability of sufficient stocks in markets Bearish 20% 2
Higher production expectations Bearish 20% 3
Lower exports compared to last year Bearish 15% 2
Profit booking at higher levels Bearish 20% 2
Overall fundamental score 2.7
* 1. Bearish; 2. Marginal Bearish; 3. Consolidation; 4. Marginal Bullish; 5.Bullish
BACK TO TOP

Date: 31-10-2017
NCML Commodity Market Monitor
• Centre hikes MSP of wheat, pulses, mustard News Link
• Uttar Pradesh raises 2017/18 cane price by 3.3% News Link
• Extractors’ body seeks hike in import duty on edible oils News Link
• Millers double non basmati purchase in Punjab News Link
• ‘Glut, sluggish global demand will not affect sugar prices’ News Link
• With bumper crop and polls ahead, Gujarat begins groundnut procurement News Link
• India to be self-sufficient in pulses in 2 years: Radha Mohan Singh News Link
• To maintain price stability, cotton body seeks govt intervention News Link
• Higher prices may prompt more farmers to sow jeera News Link
• Will bumper crop derail India’s pulses deal with Canada? News Link
• Illegal pepper imports rob the flavour off India’s spices trade News Link
• CACP proposes Rs 20 per quintal hike in sugarcane FRP for next season News Link
• World cotton stocks to rise in 2017-18. But by how much? News Link
• US wheat area for 2018 to hit 'all-time low', says IGC News Link
• World corn stocks cut to four-year low, thanks to China ethanol drive News Link
-5.10.7
1.414.7
0.4
-3.9
-2.4
0.6
-1.2
-0.5
2.0
1.7
0.56
-9.0 -4.0 1.0 6.0 11.0 16.0
Chana
Tur
Wheat
Paddy
Maize
Guar
Soya
Mustard
Cotton
Sugar
Castor
Turmeric
Jeera
Maize
% age change since 17th october 2017
News corner
OFFICIAL PRODUCTION ESTIMATES
First advance estimates 2017-18 &
previous years’ estimates :
First Advance Estimates 2017-18
Link for commodity-wise and
market-wise prices and arrivals:
http://agmarknet.gov.in/PriceAndArrivals/
CommodityWiseDailyReport2.aspx
MSP in Rs /Qtl- Kharif 2017-18
Commodity 2016-17 2017-18
Paddy Common 1470 1550
paddy grade A 1510 1590
Jowar Hybrid 1625 1700
Jowar Maldandi 1650 1725
Bajra 1330 1425
Ragi 1725 1900
Maize 1365 1425
Tur 5050 5450*
Moong 5225 5575*
Urad 5000 5400*
Groundnut 4220 4450*
Sunflower seed 3950 4100 #
Soyabean black 2775 3050
Sesamum 5000 5300 #
Nigerseed 3825 4050 #
Cotton(Medium Staple) 3680 4020
Cotton(Long Staple) 4160 4320
MSP in Rs /Qtl- Rabi 2017-18
Commodity 2016-17 2017-18
Wheat 1625 1735
Barley 1325 1410
Gram 4000* 4400
Masur (Lentil) 3950* 4250
Rapeseed/Mustard 3700* 4000
Safflower 3700* 4100
Wheat 1625 1735
*includes bonus of Rs 200 per quintal
# includes bonus of Rs 100 per quintal
BACK TO TOP

Date: 31-10-2017
NCML Commodity Market Monitor
Sowing progress: Kharif 2017-18- LINK
BACK TO TOP

Date: 31-10-2017
NCML Commodity Market Monitor
Advisory Team
Basant Vaid Head: TCIG [email protected]
Sreedhar Nandam Vice President: SCM [email protected]
Research Team
Suresh Solanki Assistant Manager: TCIG [email protected]
Kamna Malhotra Economist: TCIG [email protected]
Akash Jaiswal Research Analyst: TCIG [email protected]
Ansh Aggarwal Senior Officer: Trade Support [email protected]
For any research queries, contact us at [email protected]
STOCK
Stock limits of States/UTs
Disclaimer:
This consultancy report has been prepared by National Collateral Management Services Limited (NCML) for the sole benefit of the addressee.
Neither the report nor any part of the report shall be provided to third parties without the written consent of NCML. Any third party in
possession of the report may not rely on its conclusions without the written consent of NCML. NCML has exercised reasonable care and skill in
preparation of this consultancy report but has not independently verified information provided by others. No other warranty, express or
implied, is made in relation to this report. Therefore, NCML assumes no liability for any loss resulting from errors, omissions or
misrepresentations made by others. Any recommendations, opinions and findings stated in this report are based on circumstances and facts as
they existed at the time of preparation of this report. Any change in circumstances and facts on which this report is based may adversely affect
any recommendations, opinions or findings contained in this report.
© National Collateral Management Services Limited (NCML) 2017