power of db2pd - dbisoftware · 0xa7806ee0 tp1 utilh 5 0 2120 20512768 2120 util_heap_sz 0xa7806d88...
TRANSCRIPT

MELANIE STOPFERWW Information Management Content DevelopmentIBM Software GroupLINKEDIN: Melanie StopferTWITTER: mstopfer1
Power of db2pd
Happy New Year – Best wishes for a super 2015 !!!

1
db2pd command
• Monitor and Troubleshoot DB2 command:
– Retrieves various statistics, internal metadata, and snapshot information from a running DB2 instance
– Similar to the "onstat" utility for Informix
– Run "db2pd -help" for options
• Completely non-intrusive, does not acquire latches:
– Very fast retrieval
– Does not impact the engine in any way (can be run even if system is hung)
– Data might not always be completely accurate
• Developer Works article:
– http://www-128.ibm.com/developerworks/db2/library/techarticle/dm-0504poon2

db2pd -db tp1 -mempools
Database Partition 0 -- Database TP1 -- Active -- Up 0 days 00:04:43
Memory Pools:Address MemSet PoolName Id Overhead LogSz LogU pBnd LogHWM CfgParm0xA7806EE0 TP1 utilh 5 0 2120 20512768 2120 UTIL_HEAP_SZ0xA7806D88 TP1 pckcacheh 7 113568 24311 3 Unlimited 243113 PCKCACHESZ0xA7806CDC TP1 xmlcacheh 93 50944 80008 20971520 80008 n/a 0xA7806C30 TP1 catcacheh 8 0 67536 Unlimited 67536 CATALOGCACHE_SZ0xA7806AD8 TP1 bph 16 32 16760384 Unlimited 16760384 n/a 0xA7806980 TP1 bph 16 64 42418432 Unlimited 42418432 n/a 0xA7806828 TP1 bph 16 32 782592 Unlimited 782592 n/a 0xA78066D0 TP1 bph 16 32 520448 Unlimited 520448 n/a 0xA7806578 TP1 bph 16 32 389376 Unlimited 389376 n/a 0xA7806420 TP1 bph 16 32 323840 Unlimited 323840 n/a 0xA7806374 TP1 shsorth 18 0 0 40960000 0 SHEAPTHRES_SHR0xA78062C8 TP1 lockh 4 32 328192 458752 328192 LOCKLIST 0xA780621C TP1 dbh 2 381824 12346744 24379392 12346768 DBHEAP 0xB2CD62C8 AppCtl apph 1 0 11104 1 048576 27862 APPLHEAPSZ0xB2CD6624 AppCtl apph 1 0 7303 1 048576 8411 APPLHEAPSZ0xB2CD6578 AppCtl apph 1 0 7347 1 048576 7347 APPLHEAPSZ0xB2CD64CC AppCtl apph 1 0 7347 1 048576 8759 APPLHEAPSZ0xB2CD6420 AppCtl apph 1 0 7367 1 048576 7503 APPLHEAPSZ0xB2CD621C AppCtl appshrh 20 2304 62980 20480000 62980 application shared
-applications -agents -transactions -bufferpools -logs -locks-tablespaces -dynamic -static -fcm -mempools -memsets-dbmcfg -dbcfg -catalogcache -sysplex -tcbstats -reorg-recovery -reopt -osinfo -hadr -utiltiies -workloads-workclasses -thresholds -serviceclasses -ha -statisticscache -wlocks
db2pd – Monitor and troubleshoot DB2

db2pd -db tp1 -mempools
Database Partition 0 -- Database TP1 -- Active -- Up 0 days 00:04:43
Memory Pools:Address MemSet PoolName Id Overhead Log Sz LogUpBnd LogHWM CfgParm 0xA7806EE0 TP1 utilh 5 0 212 0 20512768 2120 UTIL_HEAP_SZ0xA7806D88 TP1 pckcacheh 7 113568 243 113 Unlimited 243113 PCKCACHESZ0xA7806CDC TP1 xmlcacheh 93 50944 800 08 20971520 80008 n/a 0xA7806C30 TP1 catcacheh 8 0 675 36 Unlimited 67536 CATALOGCACHE_SZ0xA7806AD8 TP1 bph 16 32 167 60384 Unlimited 16760384 n/a 0xA7806980 TP1 bph 16 64 424 18432 Unlimited 42418432 n/a 0xA7806828 TP1 bph 16 32 782 592 Unlimited 782592 n/a 0xA78066D0 TP1 bph 16 32 520 448 Unlimited 520448 n/a 0xA7806578 TP1 bph 16 32 389 376 Unlimited 389376 n/a 0xA7806420 TP1 bph 16 32 323 840 Unlimited 323840 n/a 0xA7806374 TP1 shsorth 18 0 0 40960000 0 SHEAPTHRES_SHR0xA78062C8 TP1 lockh 4 32 328 192 458752 328192 LOCKLIST 0xA780621C TP1 dbh 2 381824 123 46744 24379392 12346768 DBHEAP 0xB2CD62C8 AppCtl apph 1 0 111 04 1048576 27862 APPLHEAPSZ0xB2CD6624 AppCtl apph 1 0 730 3 1048576 8411 APPLHEAPSZ0xB2CD6578 AppCtl apph 1 0 734 7 1048576 7347 APPLHEAPSZ0xB2CD64CC AppCtl apph 1 0 734 7 1048576 8759 APPLHEAPSZ0xB2CD6420 AppCtl apph 1 0 736 7 1048576 7503 APPLHEAPSZ0xB2CD621C AppCtl appshrh 20 2304 629 80 20480000 62980 application shared
-applications -agents -transactions -bufferpools -logs -locks-tablespaces -dynamic -static -fcm -mempools -memsets-dbmcfg -dbcfg -catalogcache -sysplex -tcbstats -reorg-recovery -reopt -osinfo -hadr -utiltiies -workloads-workclasses -thresholds -serviceclasses -ha -statisticscache -wlocks
db2pd – Monitor and troubleshoot DB2

4
db2pd command examples
Examples:
– List all applications for all databases under the current instance, repeating every 10 seconds:db2pd -alldbs –applications –repeat 10
– Shows table space information for database SAMPLE:db2pd -database sample –tablespaces

5
Using db2pd to monitor a partitioned database
• db2pd command options can be used to request a report for one or all database partitions:
– -dbpartitionnum num – Specifies that the command is to run on the specified database partition server.
db2pd –dbpartitionnum 2 –db dss -tablespaces
– -alldbpartitionnums – Specifies that this command is to run on all active database partition servers in the instance.
db2pd –alldbpartitionnums –db dss -logs
– db2pd will only report information from database partition servers on the same physical machine that db2pd is being run on.
•Can use db2_all without -alldbpartitionnums to route command to all database partitions in db2nodes.cfg.db2_all 'db2pd -db dss -logs'
•Can use rah with -alldbpartitionnums to route command to all partitions on all servers in db2nodes.cfg.rah 'db2pd -alldbpartitionnums -db dss -logs'

db2pd Authorization Level Changes
• One of the following authority levels is required for db2pd : – The SYSADM authority level. – The SYSCTRL authority level. – The SYSMAINT authority level. – The SYSMON authority level.
• If SYSMON authorization level grantedfollowing db2pd options not available: – dump – memblocks – Stack
• The db2pd change available with DB2 9.5 Fixpak 3– Prior authority on UNIX and LINUX was instance owner or Local
Administrator on Windows
Install SYSADM Chains Broken

7
Listing DB2 threads using db2pd -edus
List of all EDUs for database partition 0
db2sysc PID: 17783db2wdog PID: 17773db2acd PID: 17815
EDU ID TID Kernel TID EDU Name USR SYS =================================================== =====================================48 3066031008 23984 db2agent (idle ) 0 0.000000 0.04000047 3067079584 23983 db2agntdp (TP1 ) 0 0.790000 6.03000046 3068128160 23839 db2evmgi (DB2D ETAILDEADLOCK) 0 0.000000 0.01000045 3069176736 23834 db2wlmd (TP1) 0 0.000000 0.00000044 3070225312 23833 db2pfchr (TP1) 0 0.000000 0.10000043 3071273888 23831 db2pfchr (TP1) 0 0.000000 0.09000042 3072322464 23830 db2pfchr (TP1) 0 0.000000 0.12000041 3073371040 23828 db2pfchr (TP1) 0 0.000000 0.15000040 3074419616 23825 db2pclnr (TP1) 0 0.000000 0.03000039 3075468192 23824 db2dlock (TP1) 0 0.000000 0.00000038 3078613920 23823 db2lfr (TP1) 0 0.000000 0.00000037 3077565344 23822 db2loggw (TP1) 0 0.000000 0.00000036 3076516768 23821 db2loggr (TP1) 0 0.000000 0.01000035 3061836704 18879 db2taskd (TP1) 0 0.000000 0.02000034 3064982432 18238 db2stmm (TP1) 0 3.120000 1.11000017 3079662496 17908 db2agent (TP1) 0 1.410000 4.01000016 3080711072 17813 db2resync 0 0.000000 0.00000015 3081759648 17812 db2tcpcm 0 0.000000 0.00000014 3082808224 17811 db2ipccm 0 0.000000 0.02000013 3083856800 17810 db2licc 0 0.000000 0.00000012 3084905376 17809 db2thcln 0 0.000000 0.00000011 3085953952 17808 db2alarm 0 0.000000 0.0000001 3054496672 17807 db2sysc 0 0.070000 0.380000

Database configuration
db2 get db cfg for musicdb show detail
db2 update db cfg for musicdb using <parm> <value>

9
Check current configuration: db2pd -dbcfg
db2pd -db musicdb -dbcfg
Database Partition 0 -- Database MUSICDB -- Active -- Up 0 days 00:00:36
Database Configuration Settings:Description Memory Value Disk Value DB configuration release level 0xa00 0xa00Database release level 0xa00 0xa00Database territory US USDatabase code page 1252 1252 Database code set IBM-1252 IBM-1252Database country/region code 1 1 .......................................................LOCKLIST (4KB) 100 20 APPGROUP_MEM_SZ (4KB) 30000 30000 GROUPHEAP_RATIO 70 70 APP_CTL_HEAP_SZ (4KB) 128 128 SHEAPTHRES_SHR (4KB) 0 0 SORTHEAP (4KB) 256 256 STMTHEAP (4KB) 2048 2048 APPLHEAPSZ (4KB) 256 256 PCKCACHESZ (4KB) 320 320 STAT_HEAP_SZ (4KB) 4384 4384 DLCHKTIME 10000 10000 MAXLOCKS 10 10 LOCKTIMEOUT -1 -1
Deferred Change

10
DB2 10.5 Fixpack 4 (Cancun) db2pd options
db2pd -db sample -printdbcfg� Output includes update database
configuration commands
db2pd -db sample -createdb� Output includes create database
command with all explicit and implicit command options

Query storage groups with SQL using the table funct ion ADMIN_GET_STORAGE_PATHS
select varchar(storage_group_name,20) as storage_group, storage_group_id, varchar(db_storage_path,20) as storage_path,
db_storage_path_state, (fs_total_size / 1000000) as total_path_MB, (sto_path_free_size / 1000000) as path_free_MB
from table( admin_get_storage_paths ('',-1)) as T1
STORAGE_GROUP STORAGE_GROUP_ID STORAGE_PATH DB_STORAGE_PATH_STATE
-------------------- ---------------- -------------------- ---------------------
IBMSTOGROUP 0 /dbauto/path1 IN_USE
APP_DATA 1 /dbauto/path2 IN_USE
TOTAL_PATH_MB PATH_FREE_MB
-------------------- --------------------
20940 5649
20940 5649
2 record(s) selected.

Listing storage groups with the db2pd command• db2pd –db testdb –storagegroupsDatabase Member 0 -- Database MUSICDB -- Active -- Up 0 days 00:09:09 -- Date
03/23/2012 09:13:49
Storage Group Configuration:Address SGID Default DataTag Name0x8F241740 0 Yes 0 IBMSTOGROUP0x8F240490 1 No 0 SG_HIGH0x90C39640 2 No 0 SG_LOW
Storage Group Statistics:Address SGID State Numpaths NumDropPen0x8F241740 0 0x00000000 2 0 0x8F240490 1 0x00000000 2 0 0x90C39640 2 0x00000000 2 0
Storage Group Paths: Address SGID PathID PathState PathName0x8F241850 0 0 InUse /dbauto/path10x8F241BF0 0 1 InUse /dbauto/path20x94F6F210 1 1024 InUse /dbauto/path1/sg_high0x94F6F510 1 1025 InUse /dbauto/path2/sg_high0x90C39750 2 2048 InUse /dbauto/path1/sg_low0x90C39AF0 2 2049 InUse /dbauto/path2/sg_low

Using the SYSCAT.TABLESPACES view
SELECT substr(tbspace,1,18) as tbspace, substr(definer,1,1 0) as definer,tbspaceid, tbspacetype, datatype, sgname
from syscat.tablespaces
TBSPACE DEFINER TBSPACEID TBSPACETY PE DATATYPE SGNAME ------------------ ---------- ----------- ----------- - ------- ------------SYSCATSPACE SYSIBM 0 D A IBMSTOGROUP TSP06 INST28 9 D A IBMSTOGROUP SYSTOOLSPACE INST28 3 D L IBMSTOGROUP USERSPACE1 SYSIBM 2 D L IBMSTOGROUP TEMPSPACE1 SYSIBM 1 S T IBMSTOGROUP TSP04 INST28 7 D L APP_DATA TSP05 INST28 8 D L APP_DATA TSP01 INST28 4 D A -TSP02 INST28 5 D L -TSP03 INST28 6 D L -SMS01 INST28 10 S A -
11 record(s) selected.
14
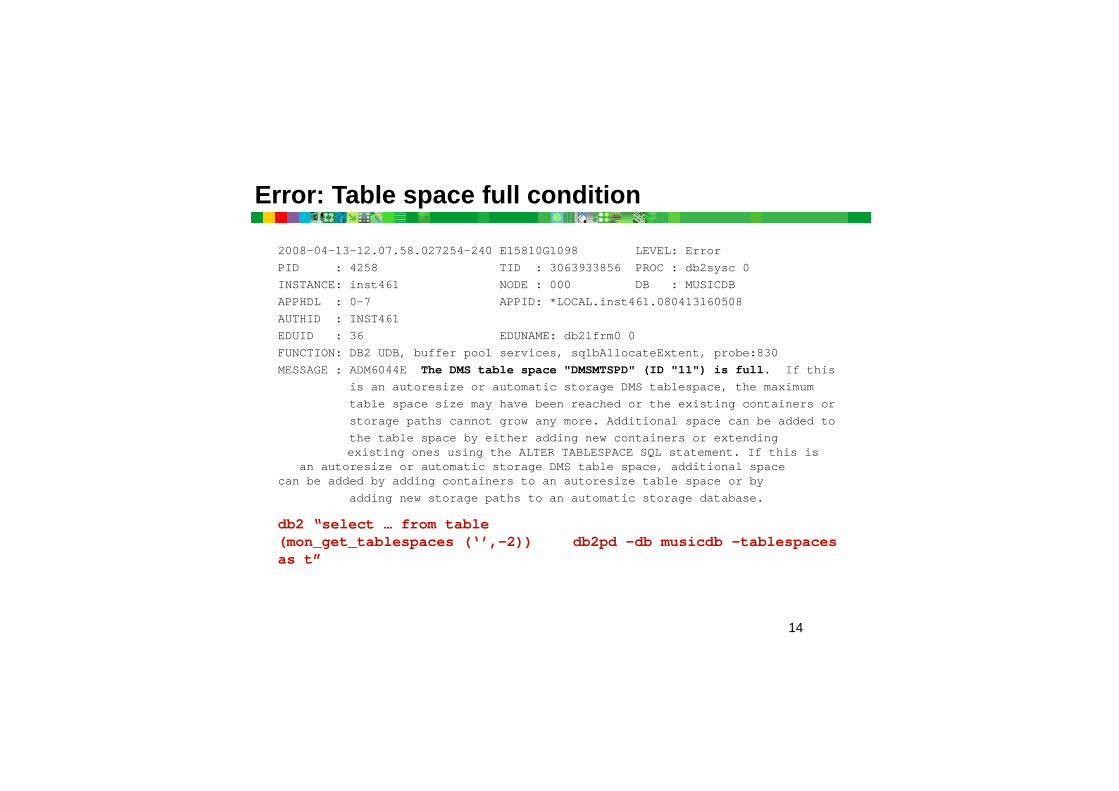
2008-04-13-12.07.58.027254-240 E15810G1098 LEVEL: Error
PID : 4258 TID : 3063933856 PROC : db2sysc 0
INSTANCE: inst461 NODE : 000 DB : MUSICDB
APPHDL : 0-7 APPID: *LOCAL.inst461.080413160508
AUTHID : INST461
EDUID : 36 EDUNAME: db2lfrm0 0
FUNCTION: DB2 UDB, buffer pool services, sqlbAllocateExtent, probe:830
MESSAGE : ADM6044E The DMS table space "DMSMTSPD" (ID "11") is full. If this
is an autoresize or automatic storage DMS tablespace, the maximum
table space size may have been reached or the existing containers or
storage paths cannot grow any more. Additional space can be added to
the table space by either adding new containers or extending existing ones using the ALTER TABLESPACE SQL statement. If this is
an autoresize or automatic storage DMS table space, additional space can be added by adding containers to an autoresize table space or by
adding new storage paths to an automatic storage database.
Error: Table space full condition
db2 “select … from table (mon_get_tablespaces (‘’,-2))as t”
db2pd -db musicdb -tablespaces

15
SELECT substr(tbsp_name,1,20) as tbsp_name ,
tbsp_total_size_kb as total_KB,
dec(((dec(tbsp_total_size_kb,10,0) * tbsp_utilization_percent) / 100),7,1) as used_KB,
tbsp_utilization_percent as percent_utilized
from SYSIBMADM.MON_TBSP_UTILIZATION
TBSP_NAME TOTAL_KB USED_KB PERCENT_UTILIZED
-------------------- -------------------- --------- -- --------------
SYSCATSPACE 98304 83332.3 84.77
TEMPSPACE1 4 4.0 100.00
USERSPACE1 32768 383.3 1.17
TP1DMS 145536 436.6 0.30
SYSTOOLSPACE 32768 734.0 2.24
TP1DMSH 40960 1794.0 4.38
TEMP16K 16 16.0 100.00
TP1DMSAD 160000 116384.0 72.74
TP1DMSAI 80000 17560.0 21.95
9 record(s) selected.
Monitor Table space utilization using the MON_TBSP_UTILIZATION view

16
Monitoring table space status with db2pd
db2pd -db musicdb -tablespaces
Tablespace Configuration:Address Id Type Content PageSz ExtentSz Auto Prefetch BufID ..Name0x138C8120 0 DMS Regular 4096 4 Yes 4 1 ..SYSCATSPACE0x138C8750 1 SMS SysTmp 4096 32 Yes 32 1 ..TEMPSPACE10x138CCF30 2 DMS Large 4096 32 Yes 32 1 ..USERSPACE10x138CD6D0 3 SMS Regular 4096 4 Yes 8 1 ..SMS01D0x14330060 4 DMS Regular 4096 4 Yes 4 1 ..DMS01D0x14330800 5 DMS Regular 4096 2 Yes 2 1 ..DMS01I0x14330FF0 6 DMS Large 4096 8 Yes 8 1 ..DMS01L0x143317E0 7 DMS Regular 4096 2 Yes 2 1 ..DMS02D0x14331FD0 8 DMS Regular 4096 2 Yes 2 1 ..DMS02I0x143327C0 9 DMS Regular 4096 4 Yes 4 1 ..DMS03D
Tablespace Statistics:Address Id TotalPgs UsablePgs UsedPgs P ndFreePgs FreePgs HWM 0x138C8120 0 8192 8188 8036 0 152 8036 0x138C8750 1 1 1 1 0 0 0 0x138CCF30 2 8192 8160 96 0 8064 96 0x138CD6D0 3 3 3 3 0 0 0 0x14330060 4 44 40 20 0 20 20 0x14330800 5 22 20 12 0 8 12 0x14330FF0 6 368 360 56 0 304 56 0x143317E0 7 22 20 16 0 4 16 0x14331FD0 8 16 14 12 0 2 12 0x143327C0 9 48 44 28 0 16 28

17
Using db2pd to list one table space
db2pd -db tp1 -dbpartitionnum 1 -tablespace id 6Database Partition 1 -- Database TP1 -- Active -- Up 0 days 00:30:16
Tablespace 6 Configuration:
Address Type Content PageSz ExtentSz Auto Prefetch BufID BufIDDisk FSC0x17CAEA20 DMS Regular 4096 8 No 8 1 1 On
NumCntrs MaxStripe LastConsecPg Name1 0 7 TP1ACCTI
Tablespace 6 Statistics:Address TotalPgs UsablePgs UsedPgs PndFreePgs FreePgs HWM0x17CAEA20 5120 5112 1856 0 3256 1856
State MinRecTime NQuiescers0x00000000 0 0
Tablespace 6 Autoresize Statistics:Address AS AR InitSize IncSize IIP MaxSize LastResize0x17CAEA20 Yes Yes 20971520 -1 No None None
LRFNo
Containers:Address ContainNum Type TotalPgs UseablePgs StripeSet0x17CAF0A0 0 File 5120 5112 0
Container/dbauto/path1/inst49e/NODE0001/TP1/T0000006/C0000000.USR

18
Temporary table compression
• Starting with DB2 9.7, if the Storage Optimization Feature is licensed, then temporary tables will be compressed by default:
– There is no additional action required by the user in order to use it
– DB2 will evaluate the query and apply compression where appropriate
– DB2 Optimizer will select compression for temporary tables used for sorts or joins based on expected result set
– Might be used to reduce size of temporary tables used for utilities like REORG and LOAD
• For example, when reorganizing a large table that uses data compression, the temporary space needed by REORG could be much larger than the table
– When the temp table reaches the size threshold, a dictionary is created and then used to compress the remaining rows
• Applicable to User temporary tables and System temps:– User temporary table can be either Declared or Created temporary table– Temporary tables will have a dictionary created automatically
• Compression of temporary tables aims to:– Reduce the amount of temporary disk space required– Small temporary tables will not be compressed to avoid a performance impact
• Use db2pd –temptable report to list usage and benefit gained

19
Using db2pd temporary table compression report
db2pd –db test –temptable
System Temp Table Stats:
Number of System Temp Tables : 21
Comp Eligible Sys Temps : 3
Compressed Sys Temps : 3
Total Sys Temp Bytes Stored : 71998659
Total Sys Temp Bytes Saved : 19270361
Total Sys Temp Compressed Rows : 462857
Total Sys Temp Table Rows: : 3002380
User Temp Table Stats:
Number of User Temp Tables : 3
Comp Eligible User Temps : 3
Compressed User Temps : 1
Total User Temp Bytes Stored : 6229645
Total User Temp Bytes Saved : 6080979
Total User Temp Compressed Rows : 158890
Total User Temp Table Rows: : 187622
Temporary table size > 100 MB
Temporary row size >= 20 bytes

20
Index metrics using MON_GET_INDEX
• The MON_GET_INDEX table function returns metrics for one or more indexes.
select substr(tabname,1,12) as table_name, IID as index_id, index_scans, index_only_scans, nleaf, nlevels
from table ( MON_GET_INDEX('INST481',NULL,-1) ) AS MONIX ORDER BY 1,2
TABLE_NAME INDEX_ID INDEX_SCANS INDEX_ONLY_SCANS NLEAF NLEVELS
------------ -------- -------------- ----------------- -------------- -------
ACCT 1 1 0 3611 3
HISTORY 1 5 5 84 2
HISTORY 2 3 3 84 2
TELLER 1 2 0 4 2
4 record(s) selected.

21
db2pd command: Index usage statistics
• db2pd –db tp1 –tcbstats index
db2pd report includes access for each index on a table
Database Partition 0 -- Database TP1 -- Active -- Up 0 days 00:07:32
Database Partition 0 -- Database TP1 -- Active -- Up 0 days 00:07:32
TCB Table Information:....................
TCB Index Information:Address InxTbspace ObjectID TbspaceID TableID Master Tbs MasterTab TableName SchemaNm IID 0x1ACCF624 6 4 6 4 6 4 HISTORY INST441 3 0x1ACCF624 6 4 6 4 6 4 HISTORY INST441 2 0x1ACCF624 6 4 6 4 6 4 HISTORY INST441 1 0x1ACCD1A4 5 4 4 4 4 4 ACCT INST49E 2 0x1ACCD1A4 5 4 4 4 4 4 ACCT INST49E 1 0x1AD9ACA4 11 4 11 4 11 4 HIST2 INST441 1
TCB Index Stats:Address TableName IID EmpPgDel RootSplits BndrySp lts PseuEmptPg Scans KeyUpdates0x1ACCF624 HISTORY 3 0 0 0 0 0 0 0x1ACCF624 HISTORY 2 0 0 0 0 1 0 0x1ACCF624 HISTORY 1 0 0 0 0 1 0 0x1ACCD1A4 ACCT 2 0 0 0 0 3 0 0x1ACCD1A4 ACCT 1 0 0 0 0 0 0 0x1AD9ACA4 HIST2 1 0 0 0 0 0 0

22
ADMIN_GET_MEM_USAGE table function Get total memory consumption for instance
MEMBER MAX_MEMBER_MEM CURRENT_MEMBER_MEM PEAK_MEMBER_MEM ------ -------------------- -------------------- ----- ---------------
0 7430103040 958169088 9583001603 7430103040 951615488 9516154881 7430103040 952664064 9526640642 7430103040 951615488 951615488
4 record(s) selected.
SELECT MEMBER, MAX_MEMBER_MEM, CURRENT_MEMBER_MEM, PEAK_MEMBER_MEM FROM TABLE(SYSPROC.ADMIN_GET_MEM_USAGE()) AS T
23
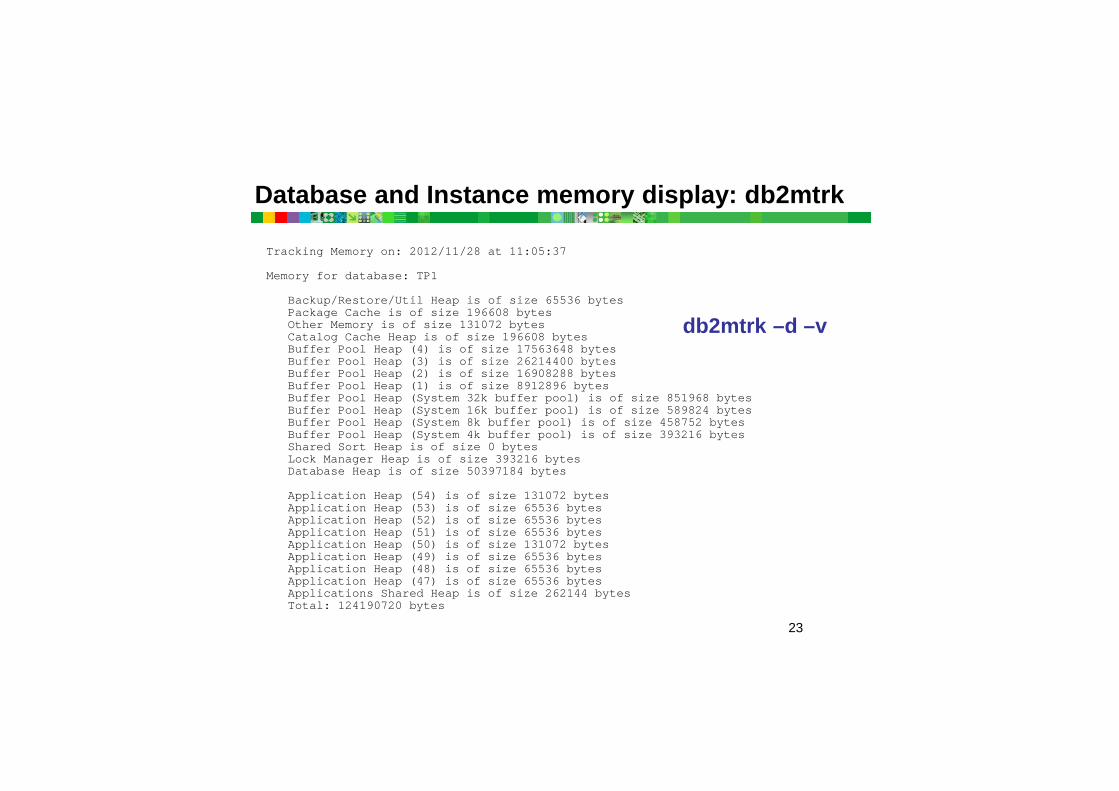
db2mtrk –d –v
Database and Instance memory display: db2mtrk
Tracking Memory on: 2012/11/28 at 11:05:37
Memory for database: TP1
Backup/Restore/Util Heap is of size 65536 bytesPackage Cache is of size 196608 bytesOther Memory is of size 131072 bytesCatalog Cache Heap is of size 196608 bytesBuffer Pool Heap (4) is of size 17563648 bytesBuffer Pool Heap (3) is of size 26214400 bytesBuffer Pool Heap (2) is of size 16908288 bytesBuffer Pool Heap (1) is of size 8912896 bytesBuffer Pool Heap (System 32k buffer pool) is of size 851968 bytesBuffer Pool Heap (System 16k buffer pool) is of size 589824 bytesBuffer Pool Heap (System 8k buffer pool) is of size 458752 bytesBuffer Pool Heap (System 4k buffer pool) is of size 393216 bytesShared Sort Heap is of size 0 bytesLock Manager Heap is of size 393216 bytesDatabase Heap is of size 50397184 bytes
Application Heap (54) is of size 131072 bytesApplication Heap (53) is of size 65536 bytesApplication Heap (52) is of size 65536 bytesApplication Heap (51) is of size 65536 bytesApplication Heap (50) is of size 131072 bytesApplication Heap (49) is of size 65536 bytesApplication Heap (48) is of size 65536 bytesApplication Heap (47) is of size 65536 bytesApplications Shared Heap is of size 262144 bytesTotal: 124190720 bytes

24
MEMORY_SET DATABASE MEMO RY_SET_USED MEMORY_SET_USED_HWM ------------------------- -------------------- ------ -------------- --------------------DBMS - 57920 58112FMP - 448 448PRIVATE - 8704 9472DATABASE TP1 134272 144704APPLICATION TP1 1216 1600
5 record(s) selected.
SELECT varchar(memory_set_type,25) as memory_set, varchar(db_name,20) as database, memory_set_used , memory_set_used_hwmFROM TABLE (MON_GET_MEMORY_SET(NULL,CURRENT_SERVER,-1)) as m1
Monitoring the overall memory usage using the MON_GET_MEMORY_SET table function
db2pd -memsets

Monitoring Database memory usage using the table function MON_GET_MEMORY_POOL
SELECT VARCHAR(MEMORY_POOL_TYPE,20) AS POOL_TYPE, MEMORY_POOL_USED, MEMORY_POOL_USED_HWM FROM TABLE (MON_GET_MEMORY_POOL ('DATABASE',NULL,NULL) ) AS TMEM
POOL_TYPE MEMORY_POOL_USED MEMORY_PO OL_USED_HWM-------------------- -------------------- ----------- ---------UTILITY 65536 65536PACKAGE_CACHE 524288 917504XMLCACHE 131072 131072CAT_CACHE 393216 393216BP 16908288 16908288BP 52166656 52166656BP 851968 851968BP 589824 589824BP 458752 458752BP 393216 393216SHARED_SORT 196608 262144LOCK_MGR 2228224 2228224DATABASE 60489728 60489728

26
db2pd -mempool report for one DB partition
Database Partition 1 -- Database TP1 -- Active -- Up 0 days 00:41:27
Memory Pools:Address MemSet PoolName Id Overhead LogSz LogU pBnd LogHWM CfgParm0xAC4E3EE0 TP1 utilh 5 0 2544 20512768 2968 UTIL_HEAP_SZ0xAC4E3D88 TP1 pckcacheh 7 113568 32918 4 Unlimited 330566 PCKCACHESZ0xAC4E3CDC TP1 xmlcacheh 93 50944 80008 20971520 80008 n/a 0xAC4E3C30 TP1 catcacheh 8 0 60552 Unlimited 60552
CATALOGCACHE_SZ0xAC4E3AD8 TP1 bph 16 32 8508384 Un limited 8508384 n/a 0xAC4E3980 TP1 bph 16 32 4472384 Un limited 4472384 n/a 0xAC4E3828 TP1 bph 16 32 782592 Un limited 782592 n/a 0xAC4E36D0 TP1 bph 16 32 520448 Un limited 520448 n/a 0xAC4E3578 TP1 bph 16 32 389376 Un limited 389376 n/a 0xAC4E3420 TP1 bph 16 32 323840 Un limited 323840 n/a 0xAC4E3374 TP1 shsorth 18 0 0 30736384 9457664 SHEAPTHRES_SHR0xAC4E32C8 TP1 lockh 4 32 590336 720896 590336 LOCKLIST 0xAC4E321C TP1 dbh 2 359088 11989184 18 677760 12878863 DBHEAP 0xB2BA36D0 AppCtl apph 1 0 5537 2621 44 8927 APPLHEAPSZ0xB2BA3624 AppCtl apph 1 0 5537 2621 44 15172 APPLHEAPSZ0xB2BA3578 AppCtl apph 1 0 6621 2621 44 12425 APPLHEAPSZ0xB2BA34CC AppCtl apph 1 0 4798 2621 44 4798 APPLHEAPSZ0xB2BA3420 AppCtl apph 1 0 8515 2621 44 9107 APPLHEAPSZ0xB2BA32C8 AppCtl apph 1 0 8324 2621 44 39940 APPLHEAPSZ0xB2BA321C AppCtl appshrh 20 1824 106551 2 0480000 110651 application
shared
db2pd -dbpartitionnum 1 -db tp1 -mempools

27
Using MON_BP_UTILIZATION to show buffer pool hit ratios and prefetch activity
select substr(bp_name,1,30) as bp_name ,
data_hit_ratio_percent,
index_hit_ratio_percent ,
prefetch_ratio_percent
from sysibmadm.mon_bp_utilization
where bp_name not like 'IBMSYSTEM%' ;
BP_NAME DATA_HIT_RATIO_PERCENT INDEX_HIT_RATIO_PERCENT PREFETCH_RATIO_PERCENT
-------------- ---------------------- ----------------------- ----------------------
IBMDEFAULTBP 99.44 56.71 6.69
CLPBUFFL 92.30 77.04 98.99
CLPBUFFS 27.04 44.68 56.29
Exclude the System 'Hidden' Buffer pools

28
POOL_DATA_WRITES DATA_SYNC_WRITES POOL_WRITE_TIME -------------------- -------------------- --------------------
5264 0 31444
POOL_LSN_GAP_CLNS POOL_DRTY_PG_STEAL_CLNS POOL_DRTY_PG_THRSH_CLNS-------------------- ----------------------- -----------------------
23 0 0
SELECT sum(pool_data_writes) as pool_data_writes,sum(pool_data_writes - pool_async_data_writes) as da ta_sync_writes,sum(pool_write_time) as pool_write_time, sum(pool_lsn_gap_clns) as pool_lsn_gap_clns,sum(pool_drty_pg_steal_clns) as pool_drty_pg_steal_ clns,sum(pool_drty_pg_thrsh_clns) as pool_drty_pg_thrsh_ clnsFROM TABLE(MON_GET_BUFFERPOOL(NULL,-1)) as bp1 where bp_name not like 'IBMSYSTEM%'
Using MON_GET_BUFFERPOOL table function view to query buffer pool write activity

29
db2pd -db tp1 -bufferpools
Database Member 0 -- Database TP1 -- Active -- Up 0 da ys 00:28:44 -- Date 02/06/2013 15:45:43
Bufferpools:First Active Pool ID 1Max Bufferpool ID 4Max Bufferpool ID on Disk 4Num Bufferpools 8
Address Id Name PageSz PA-Nu mPgs BA-NumPgs BlkSize NumTbsp … Automatic 0x909EC9D0 1 IBMDEFAULTBP 4096 2000 0 0 5 … False 0x909F4D40 2 TP1H16K 16384 1000 0 0 2 … False 0x909FD0B0 3 TP1ADATA 4096 7000 0 0 1 … False 0x90A05420 4 TP1AINDX 4096 6000 0 0 1 … False 0x909CBC10 4096 IBMSYSTEMBP4K 4096 16 0 0 0 … False 0x909D3F80 4097 IBMSYSTEMBP8K 8192 16 0 0 0 … False 0x909DC2F0 4098 IBMSYSTEMBP16K 16384 16 0 0 0 … False 0x909E4660 4099 IBMSYSTEMBP32K 32768 16 0 0 0 … False
db2pd: Buffer Pools report

30
select section_type, avg_stmt_exec_time, avg_cpu_ti me,
avg_lock_wait_time, prep_time
from SYSIBMADM.MON_PKG_CACHE_SUMMARY
order by section_type,avg_stmt_exec_time desc
SECTION_TYPE AVG_STMT_EXEC_TIME AVG_CPU_TIME AVG_LOCK_WAIT_TIME PREP_TIME ------------ -------------------- ------------------- - -------------------- ----------D - - - 1 D - - - 217 D 183 91 517 0 151 D 34 1 486 0 414 D 1 407 0 51 D 0 284 0 96 D 0 218 0 46 D 0 715 0 5 D 0 432 0 128 S 32 1 671 0 0 S 0 772 0 0 S 0 540 0 0 S 0 296 0 0 S 0 397 0 0 S 0 338 0 0
Using the MON_PKG_CACHE_SUMMARY view

31
Example report using MON_GET_PKG_CACHE_STMT (1 of 2)
PACKAGE SECTION NUM PREP_TIME TOTAL_ACT_TIME TOTAL_ACT POOL_READ_TIME LOCK_WAIT_TIME ROWS_READ
TYPE EXECUTIONS WAIT_TIME
---------- ------- ---------- ---------- -------------- ---------- -------------- -------------- -----------
SQLTP1DS S 54 0 24656 23802 23802 0 1840
SQLTP1ST S 61 0 4401 4186 4186 0 61
- D 59 498 4087 4074 4074 0 59
- D 1 1 2578 115 115 0 27987
- D 1 1 2404 240 240 0 110925
SQLTP1ST S 61 0 2363 1768 1768 0 0
- D 59 564 1777 1673 1673 0 0
- D 1 1 1054 25 25 0 1605
SQLTP1ST S 61 0 486 473 473 0 61
- D 59 143 478 474 474 0 59
- D 1 1 279 56 56 0 19
- D 2 60 229 1 0 0 0
- D 59 6 162 141 141 0 59
SQLTP1ST S 61 0 127 31 31 0 61
- D 59 33 81 76 7 68 59
SQLTP1ST S 61 0 56 26 17 9 61
- D 1 1 4 0 0 0 1605
SQLTP1ST S 61 0 2 0 0 0 61
select substr(package_name,1,10) as package, sectio n_type, num_executions, prep_time, total_act_time, total_ac t_wait_time, pool_read_time, lock_wait_time, rows_read, rows_mod ified, total_section_sort_time, substr (stmt_text,1,40) as sql_text from table(mon_get_pkg_cache_stmt(NULL,NULL,NULL,-1 ) ) as cache_stat where num_executions > 0 order by total_act_time d esc
Section type D – DynamicS - Static
total_act_wait_time - Total time spent waiting within the database server, while processing an activity

32
PACKAGE SECTION ROWS_MODIFIED TOTAL_SECTION_SORT_TIME SQL_TEXT
TYPE
---------- ------- -------------- ----------------------- ----------------------------------------
SQLTP1DS S 0 0 DECLARE C1 CURSOR FOR SELECT A.ACCT_G
SQLTP1ST S 0 0 DECLARE CURSOR1 CURSOR FOR SE
- D 0 0 SELECT BALANCE, ACCT_GRP FROM ACCT WHERE
- D 0 182 SELECT BRANCH_ID, TELLER_ID, ACCT_ID,
- D 0 525 SELECT BRANCH_ID, TELLER_ID, ACCT_ID,
SQLTP1ST S 61 0 INSERT INTO HISTORY(ACCT_ID, TEL
- D 59 0 INSERT INTO HIST
- D 0 9 SELECT BRANCH_ID, TELLER_ID, ACCT_ID,
SQLTP1ST S 0 0 DECLARE CURSOR2 CURSOR FOR SE
- D 59 0 UPDATE TELLER S
- D 0 0 SELECT * FROM HISTORY WHERE BRANCH_ID
- D 0 2 select package_name, section_type, num_e
- D 59 0 UPDATE ACCT SET
SQLTP1ST S 61 0 UPDATE ACCT SET BALANCE = BAL
- D 59 0 UPDATE BRANCH SET BALANCE = BALANCE + ?
SQLTP1ST S 61 0 UPDATE BRANCH SET BALANCE = B
- D 0 5 SELECT * FROM HISTORY WHERE BRANCH_ID
SQLTP1ST S 61 0 UPDATE TELLER SET BALANCE = B
Statement Text for Dynamic and Static statements
Example report using MON_GET_PKG_CACHE_STMT (2 of 2)

33
Check dynamic SQL cache stats with db2pd
Database Member 0 -- Database TP1 -- Active -- Up 0 da ys 00:10:09 -- Date 12/06/2012 08:13:52
Dynamic Cache:Current Memory Used 377694Total Heap Size 2582528Cache Overflow Flag 0Number of References 18270Number of Statement Inserts 14Number of Statement Deletes 2Number of Variation Inserts 6Number of Statements 12
Dynamic SQL Statements:Address AnchID StmtUID NumEnv NumVar NumRef NumExe Text 0xA0C2CC60 199 1 1 1 3045 3045 UPDATE BRANCH SET
BALANCE =BALANCE + ? WHERE BRANCH_I D = ?
0xA0D3B600 343 1 1 1 3045 3045 COMMIT0xA0D37130 429 1 1 1 3045 3045 INSERT
INTO HISTORY(ACCT_ID, TELLER_ID, BRANCH_ID, BALANCE , DELTA, PID, ACCTNAME, TEMP)
VALUES(?, ?, ?, ?, ?, ?, ?, ?)
db2pd -db tp1 -dynamic
34
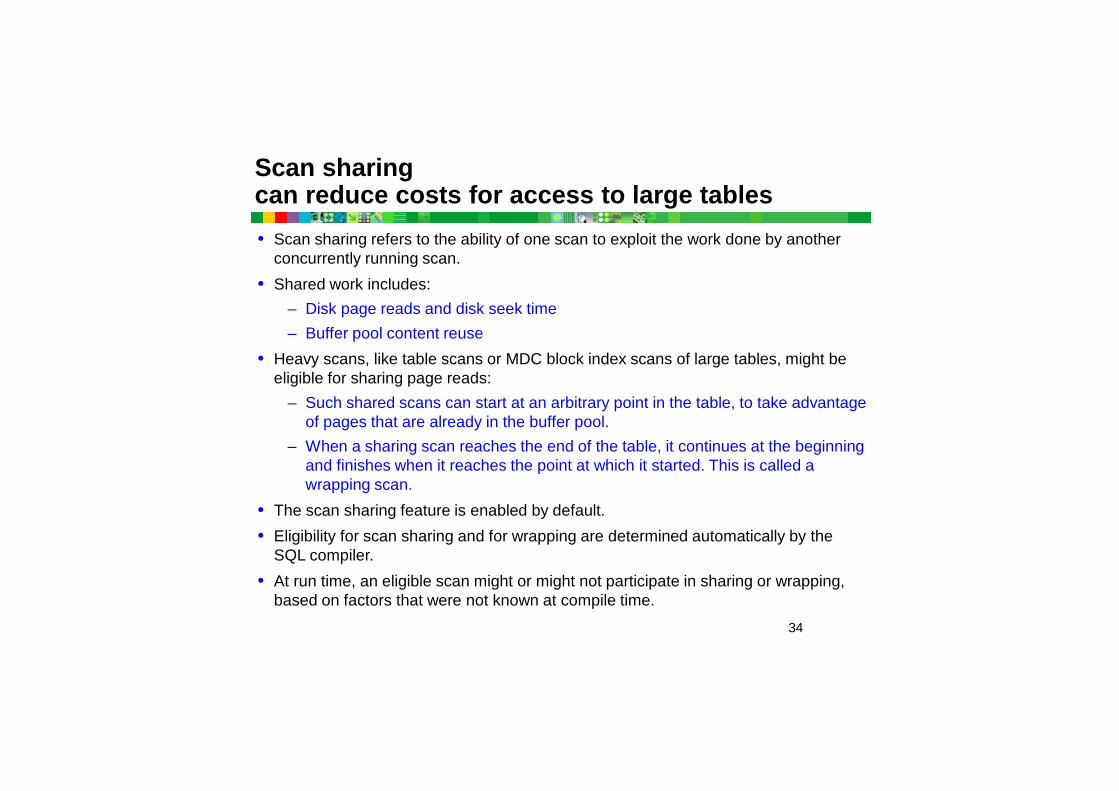
• Scan sharing refers to the ability of one scan to exploit the work done by another concurrently running scan.
• Shared work includes:
– Disk page reads and disk seek time
– Buffer pool content reuse
• Heavy scans, like table scans or MDC block index scans of large tables, might be eligible for sharing page reads:
– Such shared scans can start at an arbitrary point in the table, to take advantage of pages that are already in the buffer pool.
– When a sharing scan reaches the end of the table, it continues at the beginning and finishes when it reaches the point at which it started. This is called a wrapping scan.
• The scan sharing feature is enabled by default.
• Eligibility for scan sharing and for wrapping are determined automatically by the SQL compiler.
• At run time, an eligible scan might or might not participate in sharing or wrapping, based on factors that were not known at compile time.
Scan sharing can reduce costs for access to large tables

35
Scan sharing concepts: Wrapping table scan
Wrapping Table Scan• Shared scans can start at an arbitrary point
in the table, in order to take advantage of pagesalready in the buffer pool.
• When the scan reaches the end of the table,it continues at the beginning
• Scan finishes when it reaches the starting point.
Regular Table Scan• Begins on the first page of table• Ends with the last page in table

36
db2pd -scansharing report current shared scans
Database Partition 0 -- Database TPCD -- Active -- Up 0 days 00:00:45
Scan Sets:
TbspaceID TableID ScanObject NumGroups Footprint TableSize FastScanRate SlowScanRate
2 3 0 2 11520 22752 2486 1000
Group Information:
FootPrint NumScannersInGroup
8288 3
Scans In Group :
AgentID ApplID Mode Wrappable Fast/Slow Speed ThrottleTime Absolute Location Remaining Pages
9768 1173 0 0 1 2486 0 32 22751
11332 1165 0 0 1 2486 0 5056 17727
15466 1155 0 0 1 2486 0 8288 14495
Group Information:
FootPrint NumScannersInGroup
3232 2
Scans In Group :
AgentID ApplID Mode Wrappable Fast/Slow Speed ThrottleTime Absolute Location Remaining Pages
15209 1150 0 0 1 2486 0 14080 8703
12103 1148 0 0 1 2486 0 17280 5503
db2pd –db testdb -scansharing

37
2008-04-05-08.33.34.231230-240 E105434G580 LEVEL: WarningPID : 5145 TID : 3079662496 PROC : db2sysc 0INSTANCE: inst481 NODE : 000 DB : TP1APPHDL : 0-105 APPID: *LOCAL.inst481.080405123242AUTHID : INST481 EDUID : 63 EDUNAME: db2agent (TP1) 0FUNCTION: DB2 UDB, data management, sqldEscalateLocks, probe:2MESSAGE : ADM5500W DB2 is performing lock escalation. The total number of
locks currently held is "21131", and the target number of locks to hold is "10565".
2008-04-05-08.33.34.232335-240 E106015G521 LEVEL: WarningPID : 5145 TID : 3079662496 PROC : db2sysc 0INSTANCE: inst481 NODE : 000 DB : TP1APPHDL : 0-105 APPID: *LOCAL.inst481.080405123242AUTHID : INST481 EDUID : 63 EDUNAME: db2agent (TP1) 0FUNCTION: DB2 UDB, data management, sqldEscalateLocks, probe:3MESSAGE : ADM5502W The escalation of "21127" locks on table "INST481 .ACCT" to
lock intent "X" was successful.
db2pd -db musicdb -locks
Warning: Lock escalation

38
db2pd example of partitioned output for locking
Database Partition 0 -- Database TP1 -- Active -- Up 0 days 00:03:24
Locks:Address TranHdl Lockname Ty pe Mode Sts Owner 0x17532360 7 01000000010000000100980056 In ternal V ..S G 7 0x17530540 9 53514C5450314459C28B923441 In ternal P ..S G 9 0x17531E40 7 53514C5450314459C28B923441 In ternal P ..S G 7 0x175322D0 2 53514C5450314459C28B923441 In ternal P ..S G 2 0x175310C0 8 53514C5450314459C28B923441 In ternal P ..S G 8 0x17532750 7 01000000010000000100BE0056 In ternal V ..S G 7 0x17531F60 7 03000200210001000000000052 Ro w . .X G 7 0x17532FC0 9 01000000010000000100110056 In ternal V ..S G 9 0x17530810 2 01000000010000000100110056 In ternal V ..S G 2 0x17532720 7 01000000010000000100DD0056 In ternal V ..S G 7 0x17532390 8 01000000010000000100230056 In ternal V ..S G 8 0x17532810 7 010000000100000001002B0056 In ternal V ..S G 7 0x17530D20 7 030003000F0007000000000052 Ro w ..X G 7 0x17530E10 7 03000200000000000000000054 Ta ble .IX G 7 0x17530F90 7 03000300000000000000000054 Ta ble .IX G 7
Database Partition 1 -- Database TP1 -- Active -- Up 0 days 00:03:23
Locks:Address TranHdl Lockname Ty pe Mode Sts Owner 0x17530420 2 01000000010000000100980056 In ternal V ..S G 2 0x175319C0 2 53514C5450314459C28B923441 In ternal P ..S G 2 0x17531150 6 53514C5450314459C28B923441 In ternal P ..S G 6 0x17530D80 2 01000000010000000100110056 In ternal V ..S G 2 0x175323F0 6 01000000010000000100110056 In ternal V ..S G 6 0x17530570 2 04000400000000000000000054 Ta ble ..X G 2 0x17531C00 6 04000400000000000000000054 Ta ble .. X W 0
db2pd –alldbpartitionnums –db tp1 –locks
Lock WaitOn Part. 1

39
Monitoring Lock escalations, waits and deadlocks using SQL
SELECT deadlocks,
lock_escals, lock_wait_time, lock_waits,
lock_escals_maxlocks, lock_escals_locklist
FROM TABLE(MON_GET_WORKLOAD('SYSDEFAULTUSERWORKLOAD',-1))
as WKLOADS
;
DEADLOCKS LOCK_ESCALS LOCK_WAIT _TIME -------------------- -------------------- ----------- ---------
0 1 2773
LOCK_WAITS LOCK_ESCALS_MAXLOCKS LOCK_ESCA LS_LOCKLIST-------------------- -------------------- ----------- ---------
47 1 0

40
Using the MON_LOCKWAIT view to show active application lock waits
select substr(lw.hld_application_name,1,10) as "Hold App",
substr(lw.hld_userid,1,10) as "Holder",
substr(lw.req_application_name,1,10) as "Wait App",
substr(lw.req_userid,1,10) as "Waiter",
lw.lock_mode ,
lw.lock_object_type ,
substr(lw.tabname,1,10) as "TabName",
substr(lw.tabschema,1,10) as "Schema",
lw.lock_wait_elapsed_time
as "waiting (s)"
from
SYSIBMADM.MON_LOCKWAITS lw ;
Who is holding the lock?
Who is waiting on the lock?
How long is the wait?
Hold App Holder Wait App Waiter LOCK_MO DE LOCK_OBJECT_TYPE TabName Schema waiting (s)---------- ---------- ---------- ---------- --------- -- ---------------- -------- ------- -----------db2bp INST461 db2bp INST461 X TABLE HIST1 CLPM 61

41
Using db2pd commands to check for lock waits
db2pd –db tp1 -wlockLocks being waited on :AppHandl [nod-index] TranHdl Lockname Type Mode 95 [000-00095] 3 090004001B000100000 0000052 RowLock ..X 111 [000-00111] 11 090004001B000100000 0000052 RowLock .NS
Conv Sts CoorEDU AppName AuthID AppIDG 97 db2bp INST28 *LOCAL.inst28.1205 07120320W 186 db2bp USER28 *LOCAL.inst28.1205 07120949
Formatting the Lock Name
select name, value from table (mon_format_lock_name ( ' 090004001B0001000000000052 ')) as f
NAME VALUELOCK_OBJECT_TYPE TABLETBSP_NAME USERSPACE1TABSCHEMA DAVEKTABNAME SALES

42
Database Partition 0 -- Database MUSICDB -- Active -- Up 0 days 00:09:33
Locks:
Address TranHdl Lockname Ty pe Mode Sts Owner Dur HoldCount Att ReleaseF lg
0xADF64D80 7 0A000400000000000000000054 Ta ble .IX W 2 1 0 0x00 0x400000 00
0xADF61900 2 0A000400000000000000000054 Ta ble ..X G 2 1 0 0x02 0x400000 00
Database Partition 0 -- Database MUSICDB -- Active -- Up 0 days 00:09:20
Applications:Address AppHandl [nod-index] NumAgents CoorEDUI D Status ..Appid 0x10B02E00 13 [000-00013] 1 31 UOW-Waiting ..*LOCAL.inst481.08041212 55560x10B00060 12 [000-00012] 1 30 Lock-wait ..*LOCAL.inst481.08041212 54320x10A8B6A0 11 [000-00011] 1 29 ConnectCompleted ..*LOCAL.DB2.0804121254310x10A88900 10 [000-00010] 1 28 ConnectCompleted ..*LOCAL.DB2.0804121254300x10A85B60 9 [000-00009] 1 27 ConnectCompleted ..*LOCAL.DB2.0804121254290x1046B720 8 [000-00008] 1 26 ConnectCompleted ..*LOCAL.DB2.0804121254280x10467270 7 [000-00007] 1 17 UOW-Waiting ..*LOCAL.inst481.08041212 5426
db2pd -db musicdb –lock wait
db2pd -db musicdb -applications
Monitoring lock waits using db2pd: Step 1
TransactionID 2 owns
lock needed
ApplicationID 12 in
Lock Wait

43
db2pd -db musicdb -transactions
Database Partition 0 -- Database MUSICDB -- Active -- Up 0 days 00:09:50
Transactions:
Address AppHandl [nod-index] TranHdl Locks State .. LogSpace SpaceReserved
0xADEC2A80 7 [000-00007] 2 3 WRITE …. 4008850 7555082
0xADEC3780 8 [000-00008] 3 0 READ . 0 0
0xADEC4480 9 [000-00009] 4 0 READ 0 0
0xADEC5180 10 [000-00010] 5 0 READ 0 0
0xADEC5E80 11 [000-00011] 6 0 READ 0 0
0xADEC6B80 12 [000-00012] 7 3 READ 0 0
0xADEC7880 13 [000-00013] 8 1 READ 0 0
Monitoring lock waits using db2pd: Step 2
ApplicationID 7 is running
transaction ID 2
Large amount of logged change with small number of locks held Indicates possible lock escalation.

db2 load query table inst481.loadhist1
SQL3501W The table space(s) in which the table resides will not be placed in backup pending state since forward recovery is disabled for the database.SQL3109N The utility is beginning to load data from file "/home/inst481/datamove/savehist.del".SQL3500W The utility is beginning the "LOAD" phase at time "05/12/2012 02:44:13.967160".SQL3519W Begin Load Consistency Point. Input record count = "0".SQL3520W Load Consistency Point was successful.SQL3519W Begin Load Consistency Point. Input record count = "10248"....SQL3519W Begin Load Consistency Point. Input record count = "51450".SQL3520W Load Consistency Point was successful.SQL0289N Unable to allocate new pages in table space "LOADTSPD". SQLSTATE=57011SQL3532I The Load utility is currently in the "LOAD" phase.
Number of rows read = 51450Number of rows skipped = 0Number of rows loaded = 51450Number of rows rejected = 0Number of rows deleted = 0Number of rows committed = 51450Number of warnings = 0
Tablestate:Load Pending
Checking Load status: Load query

ID = 4Type = LOADDatabase Name = MUSICDBMember Number = 0Description = [LOADID: 18.2012 -05-12-02.48.55.850877.0 (11;4)] [*LOCAL.inst481.120512063958] ONLINE LOAD DEL AUTOM ATIC INDEXING INSERT NON-RECOVERABLE INST481 .LOADHIST1Start Time = 05/12/2012 02:48 :55.869016State = ExecutingInvocation Type = UserProgress Monitoring:
Phase Number = 1Description = SETUPTotal Work = 0 bytesCompleted Work = 0 bytesStart Time = 05/12/2012 02:48:55.86 9085
Phase Number = 2Description = LOADTotal Work = 10000 rowsCompleted Work = 10000 rowsStart Time = 05/12/2012 02:49:07.05 7958
Phase Number [Current] = 3Description = BUILDTotal Work = 2 indexesCompleted Work = 2 indexesStart Time = 05/12/2012 02:49:07.36 690
db2 LIST UTILITIES SHOW DETAIL
Load monitoring: LIST UTILITIES

46
Monitor column-organized table LOAD using db2pd command –utilities option Database Member 0 -- Active -- Up 0 days 00:25:21 -- D ate 2013-05-20-
08.40.33.104992
Utilities:
Address ID Type State Invoker Priority StartTime DBName NumPhases CurPhase Description
0x000000020557F540 3 LOAD 0 0 0 Mon May 20 08:40:20 TESTBLU 4 3 [LOADID: 50.2013-05-20-08.40.20.042757.0 (4;6)] [*LOCAL.inst20.130520122733] OFFLINE LOAD DEL AUTOM ATIC INDEXING REPLACE COPY NO INST20 .ACCT
Progress:
Address ID PhaseNum CompletedW ork TotalWork StartTime Description
0x000000020557F868 3 1 0 bytes 0 bytes Mon May 20 08:40:20 SETUPo
0x000000020557FA20 3 2 1000000 ro ws 1000000 rows Mon May 20 08:40:20 ANALYZEl
0x000000020557FBA8 3 3 831694 row s 1000000 rows Mon May 20 08:40:26 LOADm
0x000000020557FD30 3 4 0 indexes 2 indexes NotStarted BUILD
Analyze Phase shown for column-organized Table
47
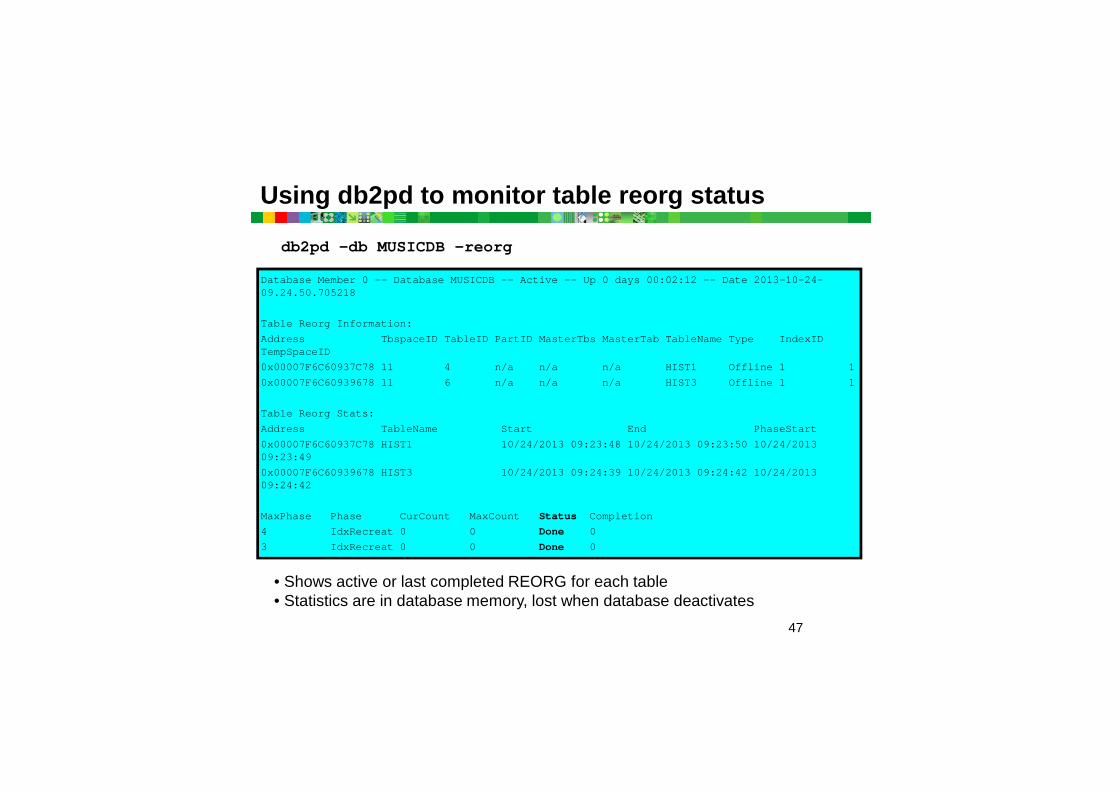
db2pd –db MUSICDB -reorg
Database Member 0 -- Database MUSICDB -- Active -- Up 0 days 00:02:12 -- Date 2013-10-24-09.24.50.705218
Table Reorg Information:
Address TbspaceID TableID PartID MasterTbs M asterTab TableName Type IndexIDTempSpaceID
0x00007F6C60937C78 11 4 n/a n/a n/a HIST1 Offline 1 1
0x00007F6C60939678 11 6 n/a n/a n/a HIST3 Offline 1 1
Table Reorg Stats:
Address TableName Start End PhaseStart
0x00007F6C60937C78 HIST1 10/24/2013 09 :23:48 10/24/2013 09:23:50 10/24/2013 09:23:49
0x00007F6C60939678 HIST3 10/24/2013 09 :24:39 10/24/2013 09:24:42 10/24/2013 09:24:42
MaxPhase Phase CurCount MaxCount Status Completion
4 IdxRecreat 0 0 Done 0
3 IdxRecreat 0 0 Done 0
Using db2pd to monitor table reorg status
• Shows active or last completed REORG for each table• Statistics are in database memory, lost when database deactivates

48
db2pd –db MUSICDB -reorg
Database Member 0 -- Database MUSICDB -- Active -- Up 0 days 00:00:46 -- Date 2013-10-24-09.23.24.781628
Table Reorg Information:
Address TbspaceID TableID PartID MasterTbs M asterTab TableName Type IndexIDTempSpaceID
0x00007F6C60937C78 11 4 n/a n/a n/a H IST1 Offline 1 11
Table Reorg Stats:
Address TableName Start End PhaseStart
0x00007F6C60937C78 HIST1 10/24/2013 09 :22:40 10/24/2013 09:22:42 10/24/2013 09:22:41
MaxPhase Phase CurCount MaxCount Status Completion
4 Build 1967 5426 Stopped
Using db2pd to check reorg statistics when reorg fails to complete
• Report shows REORG did not complete Build phase processing
49
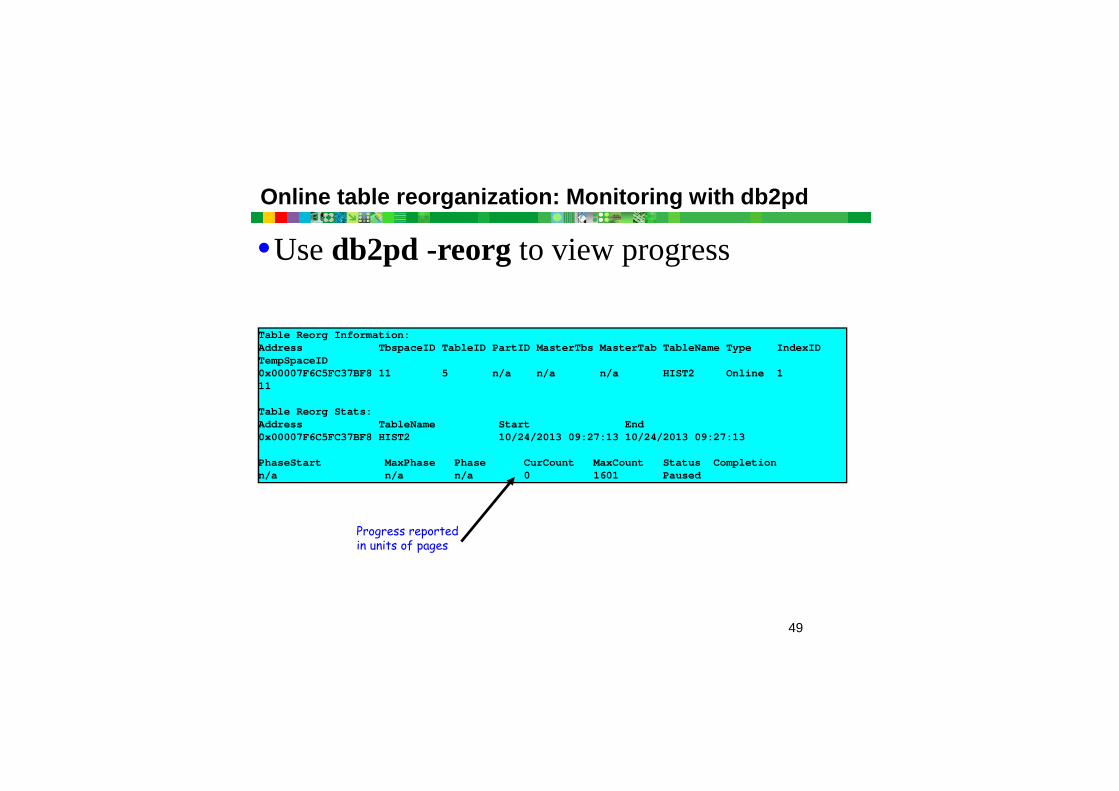
Table Reorg Information:Address TbspaceID TableID PartID MasterTbs M asterTab TableName Type IndexIDTempSpaceID0x00007F6C5FC37BF8 11 5 n/a n/a n/a H IST2 Online 1 11
Table Reorg Stats:Address TableName Start End 0x00007F6C5FC37BF8 HIST2 10/24/2013 09 :27:13 10/24/2013 09:27:13
PhaseStart MaxPhase Phase CurCount MaxCount Status Completionn/a n/a n/a 0 1601 Pau sed
Progress reportedin units of pages
Online table reorganization: Monitoring with db2pd
•Use db2pd -reorg to view progress

50
Monitoring online index REORG status with db2pd commands
Index Reorg Stats:Retrieval Time: 02/08/2010 23:04:21TbspaceID: -6 TableID: -32768Schema: TEST1 TableName: BIGRPTAccess: Allow noneStatus: CompletedStart Time: 02/08/2010 23:03:55 End Time: 02/08/2 010 23:04:04Total Duration: 00:00:08Prev Index Duration: -Cur Index Start: -Cur Index: 0 Max Index: 2 Ind ex ID: 0Cur Phase: 0 ( - ) Max Phase: 0Cur Count: 0 Max Count: 0Total Row Count: 750000
db2pd -reorgs index –db testdb

51
Monitoring table space rebalancer progress
db2pd -utilities
Database Partition 0 -- Active -- Up 0 days 00:08:44
Utilities:
Address ID Type State Invoker Priority
0x10A8F720 5 REBALANCE 0 0 0
StartTime DBName NumPhases CurPhase Description
Sun Apr 13 12:12:49 MUSICDB 1 1 Tablespace ID: 11
Progress:
Address ID PhaseNum CompletedWork TotalWork
0x10A8FA1C 5 1 145 extents 1054 extents
StartTime Description
Sun Apr 13 12:12:49 n/a

52
Database security for three-tier application system s
For many three-tiered application systems:
• Individual Users are authenticated by the application server
• A common user name and password is used to connect to the DB2 server which is unknown to the end user
• All database/SQL processing is performed using a single user name
• A set of database access privileges are granted to the common application logon name to allow all aspects of application processing to be performed
53
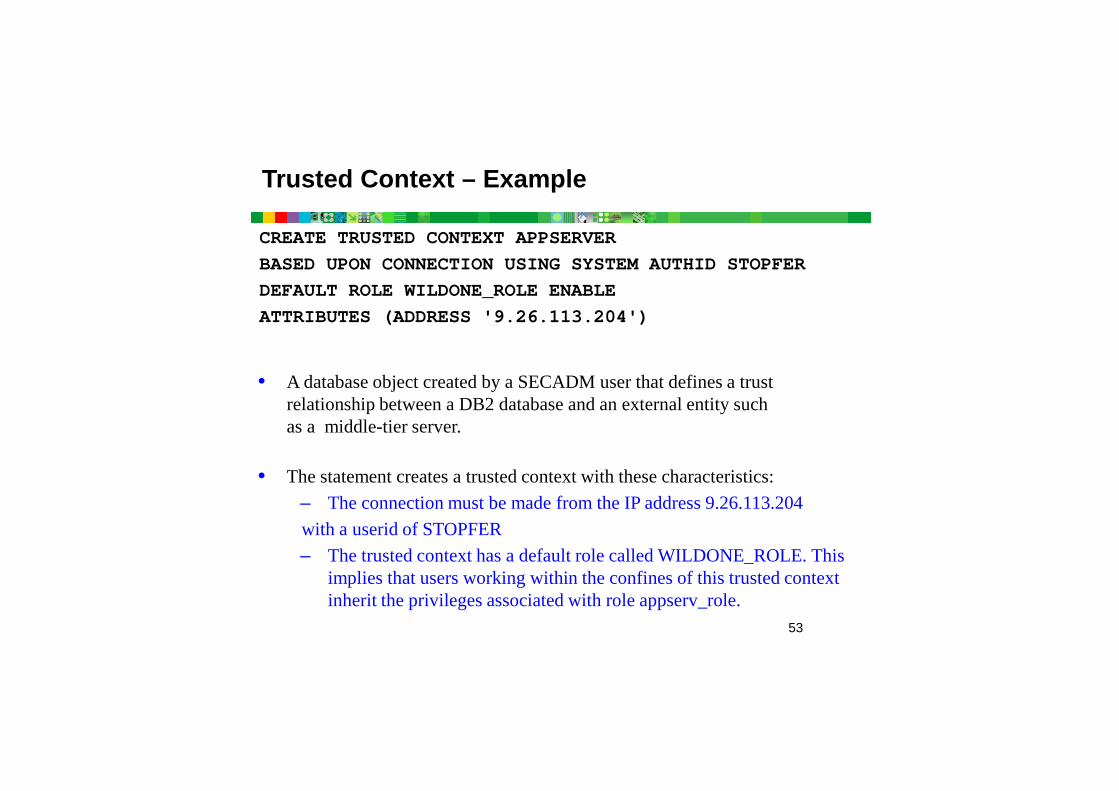
Trusted Context – Example
• A database object created by a SECADM user that defines a trust relationship between a DB2 database and an external entity such as a middle-tier server.
• The statement creates a trusted context with these characteristics:
– The connection must be made from the IP address 9.26.113.204
with a userid of STOPFER
– The trusted context has a default role called WILDONE_ROLE. This implies that users working within the confines of this trusted context inherit the privileges associated with role appserv_role.
CREATE TRUSTED CONTEXT APPSERVER
BASED UPON CONNECTION USING SYSTEM AUTHID STOPFER
DEFAULT ROLE WILDONE_ROLE ENABLE
ATTRIBUTES (ADDRESS '9.26.113.204')

54
Trusted context problem determination – db2pd
Database Partition 0 -- Database MUSICDB -- Active -- Up 0 days 00:13:29
Applications:Address AppHandl [nod-index] NumAgents CoorEDUID St atus ... Appid
WorkloadID WorkloadOccID0x10B02E00 13 [000-00013] 1 31 ConnectCompleted ... *LOCAL.inst461.080128041510
0 0 0x10B00060 12 [000-00012] 1 30 UOW- Waiting ... *LOCAL.inst461.080128041509
1 1 0x10B05BA0 51 [000-00051] 1 32 ConnectCompleted ... 192.168.111.131.1664.0710151940
0 0
External Connection AttributesAddress AppHandl [nod-index] ClientIPAddress Encry ptionLvl SystemAuthID0x10B02E00 13 [000- 00013] n/a Low DB2SEC 0x10B00060 12 [000- 00012] n/a Low DB2SEC 0x10B05BA0 51 [000- 00051] 192.168.1.104 Low DB2USER2
Trusted Connection AttributesAddress AppHandl [nod-index] TrustedContext ConnTr ustType RoleInherited0x10B02E00 13 [000- 00013] n/a non trusted n/a 0x10B00060 12 [000- 00012] n/a non trusted n/a 0x10B05BA0 51 [000-00051] DBCTX1 imp licit trusted connection ROLE2
db2pd –db salesdb –appl

55db2pd -db musicdb -logsdb2 “select … table (mon_get_transaction_log ….”
2008-04-12-05.47.23.550969-240 E647218G587 LEVEL: Error
PID : 9077 TID : 3068128160 PROC : db2sysc 0
INSTANCE: inst481 NODE : 000 DB : MUSICDB
APPHDL : 0-49 APPID: *LOCAL.inst481.080412094512
AUTHID : INST481
EDUID : 51 EDUNAME: db2agent (MUSICDB) 0
FUNCTION: DB2 UDB, data protection services, sqlpgResSpace, probe:2860
MESSAGE : ADM1823E The active log is full and is held by application handle
"49". Terminate this application by COMMIT, ROLLBACK or FORCE
APPLICATION.
2008-04-12-05.47.23.551851-240 I647806G552 LEVEL: Error
PID : 9077 TID : 3068128160 PROC : db2sysc 0
INSTANCE: inst481 NODE : 000 DB : MUSICDB
APPHDL : 0-49 APPID: *LOCAL.inst481.080412094512
AUTHID : INST481
EDUID : 51 EDUNAME: db2agent (MUSICDB) 0
FUNCTION: DB2 UDB, data protection services, sqlpWriteLR, probe:6680
MESSAGE : ZRC=0x85100009=-2062548983=SQLP_NOSPACE
"Log File has reached its saturation point"
DIA8309C Log file was full.
Error: Database log full condition

56
Amount of log used and free spacecurrently
High Water Marks
select
int(total_log_used/1024/1024) as "Log Used (Meg)",
int(total_log_available/1024/1024)
as "Log Space Free (Meg)",
int((float(total_log_used) /
float(total_log_used+total_log_available))*100)
as "Pct Used",
int(tot_log_used_top/1024/1024) as "Max Log Used (M eg)",
int(sec_log_used_top/1024/1024) as "Max Sec. Used ( Meg)",
int(sec_logs_allocated) as "Secondaries"
from table (MON_GET_TRANSACTION_LOG(-2)) as tlogs ;
Log Used (Meg) Log Space Free (Meg) Pct Used Max Lo g Used (Meg) Max Sec. Used (Meg) Secondaries
-------------- -------------------- -------- --------- --------- ------------------- -----------
12 3 76 12 10 14
Monitor Log space usage with the table function MON_GET_TRANSACTION_LOG

57
Using db2pd: Logs to display logging status
db2pd –db tp1 -logs –alldbpartDatabase Partition 0 -- Database TP1 -- Active -- Up 0 days 03:46:42Logs:Current Log Number 65 Pages Written 49 Method 1 Archive Status SuccessMethod 1 Next Log to Archive 65 Method 1 First Failure n/aMethod 2 Archive Status n/aMethod 2 Next Log to Archive n/aMethod 2 First Failure n/aAddress StartLSN State Size Pages Filename0x1774DE5C 0x00000B26B000 0x00000000 500 500 S0000065.LOG0x1774DEFC 0x00000B45F000 0x00000000 500 500 S0000066.LOG0x17AC824C 0x00000B653000 0x00000000 500 500 S0000067.LOG0x17AC82EC 0x00000B847000 0x00000000 500 500 S0000068.LOG0x17ABFE9C 0x00000BA3B000 0x00000000 500 500 S0000069.LOG0x17ABFF3C 0x00000BC2F000 0x00000000 500 500 S0000070.LOG
Database Partition 1 -- Database TP1 -- Active -- Up 0 days 03:46:39Logs:Current Log Number 160 Pages Written 81 Method 1 Archive Status SuccessMethod 1 Next Log to Archive 160 Method 1 First Failure n/aMethod 2 Archive Status n/aMethod 2 Next Log to Archive n/aMethod 2 First Failure n/aAddress StartLSN State Size Pages Filename0x17ABFF3C 0x000012E0D000 0x00000000 500 500 S0000160.LOG0x1774DE5C 0x000013001000 0x00000000 500 500 S0000161.LOG0x1774DEFC 0x0000131F5000 0x00000000 500 500 S0000162.LOG0x17AC824C 0x0000133E9000 0x00000000 500 500 S0000163.LOG0x17AC82EC 0x0000135DD000 0x00000000 500 500 S0000164.LOG0x17C6CFCC 0x0000137D1000 0x00000000 500 500 S0000165.LOG…………………………………………………

Buffer pools
200 old
200 new
300 old
300 new
100
100
101
101
200 new200 old
300 old
201 old
201 new
201 new301 new
301 new
301 old
Table space Containers
Active Log Files
Read Only
Committed
Update
Uncommitted
Update Page CleanersI/O Servers
Log ReaderLog Writer
Log Buffer
300 new
201 new
301 new
How Currently Committed works for CS Isolation
Application AUpdates several rows
New data in buffer pool
Application BReads Committed rows
using log data when needed
Archived logs will not be accessedto retrieve committed data row

59
Use db2pd to check logging activity associated with Currently Committed option for locking
Database Partition 0 -- Database TP1 -- Active -- Up 0 days 00:02:11
Logs:Current Log Number 228 Pages Written 33 Cur Commit Disk Log Reads 1811 Cur Commit Total Log Reads 51482Method 1 Archive Status SuccessMethod 1 Next Log to Archive 228 Method 1 First Failure n/aMethod 2 Archive Status n/aMethod 2 Next Log to Archive n/aMethod 2 First Failure n/aLog Chain ID 3 Current LSN 0x0000000024BD783E
Address StartLSN State Size Pages Filename0x92202448 00000000243E6010 0x00000000 250 2 50 S0000220.LOG0x92202C88 00000000244E0010 0x00000000 250 2 50 S0000221.LOG0x922034C8 00000000245DA010 0x00000000 250 2 50 S0000222.LOG
Disk Reads might be reduced with larger log buffer size

60
BLU Resource Usage and Concurrency
� BLU philosophy is to leverage full machine resources (memory, CPU parallelism, etc.) in order to achieve order of magnitude performance benefits
� A consequence of this is that running too many columnar queries at a time can lead to significant resource competition and degrade performance
� Too many queries executing at a time can also have the potential to overload system resources and cause failures
� Some form of query concurrency management is needed to ensure orderly and efficient execution of columnar queries

61
db2pd -workclasssets –alldbsDatabase Member 0 -- Database XDB -- Active -- Up 0 da ys 10:36:52
-- Date 2013-09-05-22.33.08.942063
(…)
Work Classes:Address = 0x00002AAC34C11840 ClassSetId = 2147483647 ClassId = 2147483647 ClassName = SYSMANAGEDQUERIESWork Class Attributes:
Work Type = 2 Timeron Cost:
From Value = 150000To Value = 0
(…)
Query cost level
Querying the Default WLM Settings

62
Querying the Default WLM Settings (cont.)
db2pd -thresholds -alldbs
(…)
Service Class Thresholds:
Threshold Name = SYSDEFAULTCONCURRENT
Threshold ID = 2147483647
Domain = 40
Domain ID = 4
Predicate ID = 90
Maximum Value = 12
Enforcement = D
Queueing = Y
Queue Size = -1
Collect Flags = N
Partition Flags = C
Execute Flags = S
Enabled = Y
Check Interval (seconds) = 0
Remap Target Serv. Subclass = 0
Log Violation Evmon Record = Y
(…)
Query concurrency limit
Threshold is enabled

63
Database Partition 0 -- Database TP1 -- Active -- Up 0 days 00:31:18
HADR Information:Role State SyncMode HeartBeatsMissed LogGapRunAvg (bytes)Primary Peer Nearsync 0 576827
ConnectStatus ConnectTime Timeout Connected Tue Jan 6 15:26:38 2009 (1231273598) 120
PeerWindowEnd PeerWindowTue Jan 6 15:47:02 2009 (1231274822) 60
LocalHost LocalService CL4100 6493
RemoteHost RemoteService RemoteInstance CL4100 6491 inst491
PrimaryFile PrimaryPg PrimaryLSN S0000157.LOG 255 0x000000001E707F79
StandByFile StandByPg StandByLSN S0000157.LOG 2 0x000000001E60A7A7
db2pd –db TP1 -hadr
Primary Database sees thatthe Standby hasreached a peer state
Monitoring HADR status

64
Database Partition 0 -- Database TP1 -- Active -- Up 0 days 00:02:18
HADR Information:Role State SyncMode HeartBeatsMissed LogGapRunAvg (bytes)Standby DisconnectedPeer Nearsync 0 255138
ConnectStatus ConnectTime Timeout Disconnected Tue Jan 6 16:04:27 2009 (1231275867) 120
PeerWindowEnd PeerWindowTue Jan 6 16:05:14 2009 (1231275914) 60
LocalHost LocalService CL4100 6493
RemoteHost RemoteService RemoteInstance CL4100 6491 inst491
PrimaryFile PrimaryPg PrimaryLSN S0000159.LOG 112 0x000000001EA60475
StandByFile StandByPg StandByLSN S0000159.LOG 112 0x000000001EA60475
db2pd –db TP1 -hadr
The Standby database has received a timestamp from the Primary indicating when the Peer Window will end
HADR status on Standby includes time for end of Peer Window

65
HADR tuning options: DB2_HADR_BUF_SIZE
Database Partition 0 -- Database TP1 -- Standby -- Up 0 days 00:32:44
HADR Information:Role State SyncMode HeartBeatsMissed LogGapRunAvg (bytes)Standby Peer Nearsync 0 1019811 ConnectStatus ConnectTime Timeout Connected Sun Oct 24 17:21:46 2010 (1287955306) 30
PeerWindowEnd PeerWindowSun Oct 24 17:38:56 2010 (1287956336) 60 LocalHost LocalService ibmclass 6493 RemoteHost RemoteService RemoteInstance ibmclass 6491 inst491
PrimaryFile PrimaryPg PrimaryLSN S0000323.LOG 499 0x00000000296F9378
StandByFile StandByPg StandByLSN StandByRcvBufUsedS0000323.LOG 128 0x00000000295875B3 76%
DB2_HADR_BUF_SIZE - HADR Standby log receive buffer size

66
• When the Standby database is replaying DDL log records or maintenance operations, the Standby enters the replay-only window.
• When the Standby is in the replay-only window, existing connections to the Standby are terminated and new connections to the Standby are blocked (SQL1776N Reason Code 4).
• New connections are allowed on the Standby after the replay of all active DDL or maintenance operations has completed.
select count(*) as count , dec(avg(balance),9,2) as avg_balance from inst491.history where branch_id between 10 and 20
SQL1224N The database manager is not able to accep t new requests, has terminated all requests in progress, or has terminated the specified request because of an erro r or a forced interrupt. SQLSTATE=55032
Replay-only window on the active Standby database

67
Monitoring the replay-only window using db2pd
db2pd -db hadrdb -hadrDatabase Partition 0 -- Database HADRDB -- Active -- Up 0 days 00:00:06
HADR Information:Role State SyncMode HeartBeatsMissed LogGapRunAvg (bytes)Standby Peer Nearsync 0 0
ConnectStatus ConnectTime Timeout Connected Sat Jun 15 03:09:35 2008 120
ReplayOnlyWindowStatus ReplayOnlyWindowStartTime MaintenanceTxCountActive Sun Jun 16 08:09:35 2008 5
LocalHost LocalServiceskua 52601
RemoteHost RemoteService RemoteInstancegull 52600 vinci
PrimaryFile PrimaryPg PrimaryLSNS0000000.LOG 1 0x000000000137126F
StandByFile StandByPg StandByLSNS0000000.LOG 0 0x000000000137092E

MELANIE STOPFERWW Information Management Content DevelopmentIBM Software GroupLINKEDIN: Melanie StopferTWITTER: mstopfer1
Power of db2pd
Happy New Year – Best wishes for a super 2015 !!!