the bi survey 16 - qlikgo.qlik.com/rs/497-bmk-910/images/qlik_in_the_bi_survey_16.pdf · the bi...
TRANSCRIPT

THE BI Survey 16The world´s largest survey of BI software users
This document is a specially produced summary by BARC of the headline results for
Qlik
2 ©2016 BARC - Business Application Research Center, a CXP Group CompanyQlik in
THE BI Survey 16 Qlik Sense highlights
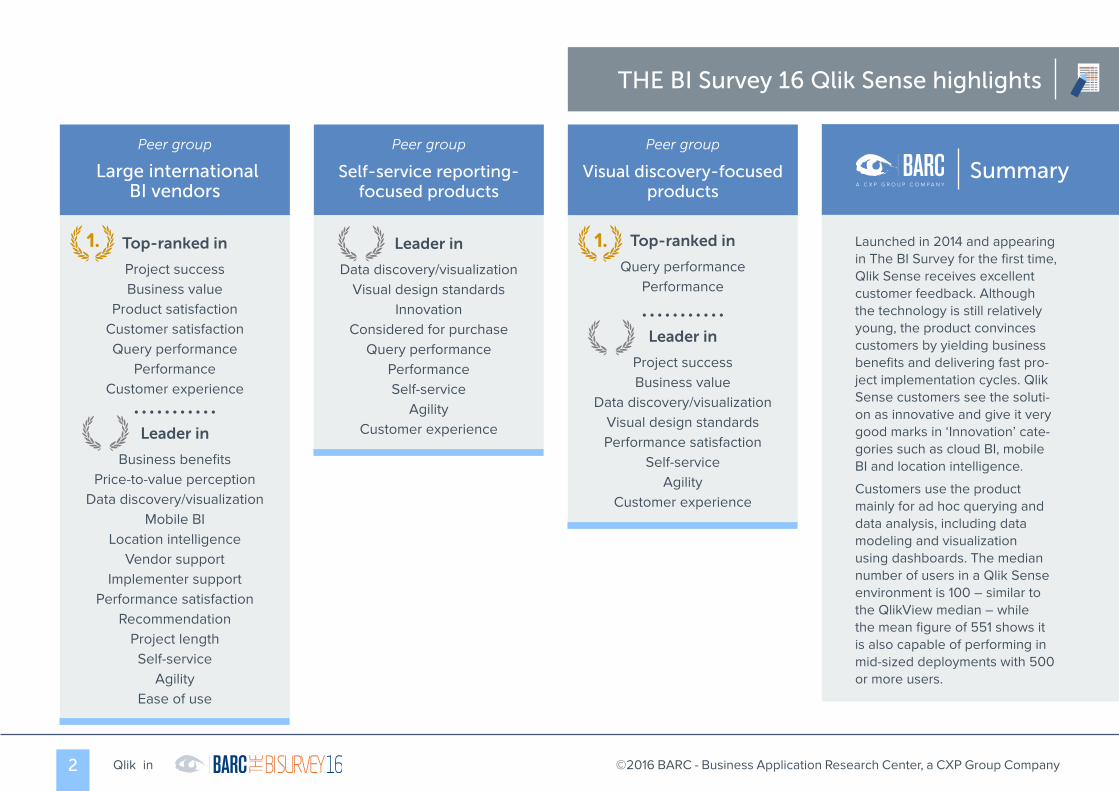
Launched in 2014 and appearing in The BI Survey for the first time, Qlik Sense receives excellent customer feedback. Although the technology is still relatively young, the product convinces customers by yielding business benefits and delivering fast pro-ject implementation cycles. Qlik Sense customers see the soluti-on as innovative and give it very good marks in ‘Innovation’ cate-gories such as cloud BI, mobile BI and location intelligence.
Customers use the product mainly for ad hoc querying and data analysis, including data modeling and visualization using dashboards. The median number of users in a Qlik Sense environment is 100 – similar to the QlikView median – while the mean figure of 551 shows it is also capable of performing in mid-sized deployments with 500 or more users.
Summary
Top-ranked in
Project successBusiness value
Product satisfactionCustomer satisfactionQuery performance
PerformanceCustomer experience
. . . . . . . . . . .Leader in
Business benefitsPrice-to-value perception
Data discovery/visualizationMobile BI
Location intelligenceVendor support
Implementer supportPerformance satisfaction
RecommendationProject lengthSelf-service
AgilityEase of use
1. Top-ranked in
Query performancePerformance
. . . . . . . . . . .Leader in
Project successBusiness value
Data discovery/visualizationVisual design standardsPerformance satisfaction
Self-serviceAgility
Customer experience
1.Leader in
Data discovery/visualizationVisual design standards
InnovationConsidered for purchase
Query performancePerformanceSelf-service
AgilityCustomer experience
Peer group
Large internationalBI vendors
Peer group
Self-service reporting-focused products
Peer group
Visual discovery-focused products

3 ©2016 BARC - Business Application Research Center, a CXP Group CompanyQlik in
THE BI Survey 16 Qlik Sense top ranks
Business valuePeer group
Large international BI vendors
Top rankedin
Project successPeer group
Large internationalBI vendors
Top rankedin
Customer experience
Top rankedin
Peer groupLarge international
BI vendors
Query performance
Top rankedin
Peer groupLarge international
BI vendors
Customer satisfaction
Top rankedin
Peer groupLarge international
BI vendors
PerformancePeer group
Visual discovery-focusedproducts
Top rankedin
PerformancePeer group
Large internationalBI vendors
Top rankedin
Query performance
Top rankedin
Peer groupVisual discovery-focused
products
Product satisfaction
Top rankedin
Peer groupLarge international
BI vendors

4 ©2016 BARC - Business Application Research Center, a CXP Group CompanyQlik in
THE BI Survey 16 QlikView highlights/top ranks
BI Survey feedback shows that Qlik has done a first-rate marke-ting job with its solution. Custo-mers see QlikView as one of the most competitive solutions on the market and the product recei-ves top ranks in all of its peer groups. Results for query and overall performance are especial-ly strong.
From its very beginnings Qlik-View has been equipped with in-tegrated in-memory data storage. Over the years Qlik has invested heavily in tuning the system, finally introducing the next gene-ration of its in-memory engine – the QIX engine – in 2015 with the launch of QlikView version 12. In this year’s BI Survey, 85 percent of QlikView customers say they are still using version 11 so any resulting change in performance will not show up in our results until next year.
Summary
Top-ranked in
Considered for purchase
. . . . . . . . . . .
Leader in
Business value
Operational BI
Product satisfaction
Vendor support
Query performance
Performance
Project length
Flexibility for users
Ease of use
1. Top-ranked in
Considered for purchase
. . . . . . . . . . .
Leader in
Data volume
Competitiveness
Query performance
Performance
1.Top-ranked in
Considered for purchase
. . . . . . . . . . .
Leader in
Competitiveness
Query performance
Performance
1.
Peer group
Large internationalBI vendors
Peer group
Dashboarding-focusedproducts
Peer group
Visual discovery-focused products
Considered for purchase
Top rankedin
Peer groupVisual discovery-focused
products
Considered for purchase
Top rankedin
Peer groupDashboarding-focused vendors
Considered for purchase
Top rankedin
Peer groupLarge international
BI vendors
Introduction
THE BI Survey 16 is based on findings from the world‘s largest and most comprehensive survey of business intelligence end users, conducted from February 2016 to May 2016. In total, 3,137 people responded to the sur-vey with 2,611 answering a series of detailed questions about their usage of a named pro-duct. Altogether, 37 products (or groups of products) are analyzed in detail.
THE BI Survey 16 examines BI product selec-tion and usage among users in categories (KPIs) including business benefits, project success, business value, recommendation, customer satisfaction, customer experience, innovation and agility. There are 32 KPIs in total.
This document contains just a selection of the headline findings for Qlik. It does not show all the KPI results and focuses mainly on the positive findings.
For more information on the survey visit our new BI Survey homepage.
Qlik overview
Qlik customer responses
5 ©2016 BARC - Business Application Research Center, a CXP Group CompanyQlik in
This year we had 239 responses from QlikView users. 85 percent of them use version 11 and the remaining 15 percent run version 12. We also received 43 responses from users of Qlik Sense, all of whom are on version 2.
Qlik Technology (Qlik) was originally founded in 1993 in Lund, Sweden, and moved its headquar-ters to the United States in 2005 after raising funds from several venture capital firms. In 2010 Qlik went public on NASDAQ.
Until the general availability of Qlik Sense in 2014, Qlik was a one-product company. Today, the vendor offers several components based on a common ‘associative’ engine. For instance, customers can choose between products such as Qlik Analytics Platform, Qlik Sense, Qlik Sen-se Cloud, Qlik DataMarket and QlikView as well as Qlik NPrinting. With the Qlik Analytics Plat-form, the vendor offers a development environ-ment for individual products, such as extensions to existing Qlik products or completely new UIs and functionality.
QlikView is a dashboard and set-based, ’asso-ciative’ analysis product based on in-memory technology, and was the first product in the “data discovery” product category. It is positioned as a solution for building guided analytic apps targe-ted at business users, enabling them to analyze data without going to an expert for a new report or dashboard.
Qlik Sense is positioned as Qlik’s next-generati-on visual analytics platform. It addresses a mix-ture of use cases from self-service data visua-lization to building guided apps to embedded analytics. It is supplied with enterprise features including a central library for common metadata, policy-based security, and open, modern APIs.

Report
Qlik Sense

User & use case demographics
7 ©2016 BARC - Business Application Research Center, a CXP Group CompanyQlik in
Current vs. planned usen=43
In use Planned
86%
72%
63%
58%
21%
21%
9
14%
21%
33%
35%
42%
44%
67%
Dashboards/Scorecards
Basic data analysis
Ad hoc query
Standard/Enterprisereporting
Budgeting/Planning
Financialconsolidation
Advanced analysis
5 products most often evaluated incompetition with Qlik Sensen=323
85%
58%
36%
26%
22%
QlikView
Tableau
Microsoft Power BI
Microsoft SSRS
IBM Cognos BI
Percentage of employees using Qlik Sensen=41
19%
17%
Qlik Sense
Average of allproducts
Number of users using Qlik Sensen=38
Median
Mean 551
100
1521
100
Qlik Sense Average of allproducts
Company size (employees)n=42
14%
48%
38%
Less than 100
100 - 2500
More than 2500
Licensing modelsn=42
71%19%
10%0%
License up-frontPart of a bundle
SubscriptionOpen source
Tasks carried out with Qlik Sense bybusiness usersn=39
Qlik SenseAverage of all products
97%81%
90%92%
87%84%
38%29%
Explore/Analyze
View
Navigate
Model/Enrich
Qlik Sense was introduced in 2014 and attrac-ted an impressive total of 43 responses in this year’s BI Survey. The product is mostly used for dashboard creation, basic data analysis and ad hoc query. 58 percent of users use Qlik Sense for standard/enterprise reporting. This may change with version 3, in which printing and layout capabilities have been extended with the NPrinting component, enabling users to create print-oriented reports.
Qlik Sense is used by a median of 100 users, the same as the combined average of all products in The BI Survey 16. A much higher mean figure shows that Qlik Sense is also used in larger mid-sized scenarios with over 500 users.
Comment

8 ©2016 BARC - Business Application Research Center, a CXP Group CompanyQlik in
Peer Groups & KPIs THE BI Survey 16 features a range of different types of BI tools so we use peer groups to help identify competing products. The groups are essential to al-low fair and useful comparisons of products that are likely to compete.
The peer groups have been defined by BARC ana-lysts using their experience and judgment, with segmentation based on two key factors:
1. Usage scenario - functional peer groups are mainly data-driven and ba-sed on how customers say they use the product.
2. Regional focus - is the vendor a large international vendor with a truly global presence or does it focus on a particu-lar region. We also take into account the location of BI Survey respondents.
Qlik Sense features in the following peer groups:
• Large international BI vendors
• Self-service reporting-focused products
• Visual discovery-focused products
Large enterprise BI platforms
Includes products equipped with functionality for enterprise deployments that focus on a broad range of BI use cases.
Dashboarding-focused products
Includes products that focus on creating advanced and highly sophisticated dashboards.
Self-service reporting-focused products
Includes products that focus on self-service reporting and ad hoc analysis.
OLAP analysis-focused products
Includes products that focus on analysis in dimensio-nal and hierarchical data models.
Visual data discovery-focused products
Includes products that focus on visual data discovery and advanced data visualization.
Integrated performance management products
Includes products that provide integrated functiona-lity for BI and performance management, especially planning and budgeting.
Large international BI vendors
Includes products from companies with annual re-venues of $200m+ and a truly international reach.
EMEA-focused vendors
Includes products from vendors that have a signifi-cant presence in - and focus on - the EMEA region.
Americas-focused vendors
Includes products from vendors that have a signifi-cant presence in - and focus on - the Americas region.
THE BI Survey 16 provides the reader with well-de-signed KPI dashboards packed with concise infor-mation, which can be absorbed at a glance. The KPIs all follow these simple rules:
• Only measures that have a clear good/bad trend are used as the basis for KPIs.
• KPIs may be based on one or more measures from THE BI Survey.
• Only products with samples of at least 20 - 30 (depending on the KPI) for each of the questions that feeds into the KPI are included.
• For quantitative data, KPIs are conver-ted to a scale of 1 to 10 (worst to best).
• A linear min-max transformation is ap-plied, which preserves the order of, and the relative distance between, pro-ducts‘ scores.
The terms ‘top-ranked’ and ‘leader’ are used in the following KPI chart titles. ‘Top-ranked’ indicates first position. ‘Leader’ usually denotes a position in the top 20-25% of products listed in the chart.
Peer Group Classification Peer Groups Overview
The KPIs
Report
The business benefits KPI is based on the achievement level of a variety of business benefits.
The price-to-value KPI is based on how users rate their BI tool in terms of price-to-value.
Business benefits &price-to-value perception

10 ©2016 BARC - Business Application Research Center, a CXP Group CompanyQlik in
Qlik Sense is the second highest rated product in the large international BI vendors peer group for price-to-value perception. In contrast to QlikView, Qlik Sense is offered to customers with a simplified so-called token-based license concept. This is a flexible option, which makes it possible to buy both named user licenses or to use one token for several users where licensing is restricted by sessions or time. The product is also available as a cloud version with subscription-based pricing. Customer feedback indi-cates that Qlik Sense buyers are satisfied with the price they pay and the value they receive.
Viewpoint
Qlik Sense is highly rated in terms of providing business benefits to custo-mers compared to other large international BI vendors. Through its inter-active drag-and-drop UI for content creation, Qlik Sense convinces casual business users they can use it for dashboard and analysis creation. For power users with some technical knowledge, the product offers a script-ing environment for performing “light” ETL tasks to integrate and transform data. User-friendly products and UIs are crucial for acceptance in business departments, helping business users to analyze and understand their data.
Viewpoint
Price-to-value perceptionBusiness benefits
Business benefits – Leader
Peer group: large international BI vendors
9.68.1
7.87.7
7.27.0
6.76.0
5.55.0
4.73.63.6
3.22.7
2.42.3
1.71.0
Information BuildersMS Power BI
IBM Cognos TM1Qlik Sense
QlikViewMicroStrategy
TibcoTableau
Oracle BIPeer Group Average
MS SSRSMS Excel
InforIBM Cognos BI
SAP BO Design St.SAP BO Analysis
SAP BExSAP BO WebI
SAS© BARC
THE BI Survey 16
Price-to-value perception – Leader
Peer group: large international BI vendors
10.08.8
8.47.8
7.57.47.47.37.2
6.36.0
5.75.4
5.04.5
3.53.4
2.21.0
Information Builders
MS Power BI
IBM Cognos TM1
Qlik Sense
QlikView
MicroStrategyTibco
Tableau
Oracle BI
Peer Group Average
MS SSRS
MS Excel
Infor
IBM Cognos BI
SAP BO Design St.
SAP BO Analysis
SAP BEx
SAP BO WebI
SAS
© BARCTHE BI Survey 16
Report
This KPI is based on the implementation satisfaction level and the frequency of projects completed on time and on budget.
Project success

12 ©2016 BARC - Business Application Research Center, a CXP Group CompanyQlik in
Qlik Sense is the top-ranked large international BI vendor and one of the leading visual disco-very-focused products for project success. In general the software is very ad hoc oriented and supports the creation of dashboards and visualizations via drag-and-drop. Existing Qlik-View customers in particular may well decide that Qlik Sense offers better potential for at-tracting new users from business departments, who are seeking a more ad hoc oriented so-lution.
Viewpoint
Project success – Leader1.
Peer group: visual discovery-focused products
Project success – Top-ranked
Peer group: large international BI vendors
Project success
8.68.1
7.97.1
6.96.86.8
5.45.35.24.94.84.8
4.53.1
2.62.22.1
1.0
Information Builders
MS Power BI
IBM Cognos TM1
Qlik Sense
QlikView
MicroStrategy
Tibco
Tableau
Oracle BI
Peer Group AverageMS SSRS
MS ExcelInfor
IBM Cognos BI
SAP BO Design St.
SAP BO Analysis
SAP BExSAP BO WebI
SAS© BARC
THE BI Survey 16
9.59.0
8.68.2
7.57.27.1
6.96.8
6.35.4
Sisense
MS Power BI
Phocas
Qlik Sense
QlikView
TargitPeer Group Average
Tibco
Tableau
Dundas
Logi Analytics

Report
This KPI combines the ‘Business benefits’, ‘Project success’, ‘Price-to-value perception’, ‘Project length’ and ‘Innovation‘ KPIs.
Business value

14
Viewpoint
©2016 BARC - Business Application Research Center, a CXP Group CompanyQlik in
Qlik Sense is top-ranked among large interna-tional BI vendors and one of the leading visual discovery-focused products in providing busi-ness value to its customers. Qlik is strongly fo-cused on offering intuitive solutions capable of supporting business users in gaining insights into data. Qlik Sense’s good ad hoc capabili-ties support the analysis and discovery pro-cess with an interactive user interface.
Overall, with good results in the ‘Business benefits’, ‘Project success’, ‘Price-to-value perception’, ‘Project length’ and ‘Innovation’ KPIs, it is not surprising to see Qlik Sense rated above average for ‘Business value’.
Business value
Business value – Leader1.
Peer group: visual discovery-focused products
Business value – Top-ranked
Peer group: large international BI vendors
8.88.3
8.07.8
7.37.3
6.96.8
6.46.3
Sisense
MS Power BI
PhocasQlik Sense
QlikViewTargit
Peer Group Average
Tibco
TableauLogi Analytics
6.3Dundas
8.07.87.8
6.96.96.8
6.35.45.35.25.15.1
4.44.03.8
2.92.5
1.9
Information BuildersMS Power BI
IBM Cognos TM1
Qlik Sense
QlikView
MicroStrategy
Tableau
Oracle BI
Peer Group Average
MS SSRSMS Excel
IBM Cognos BI
SAP BO Design St.SAP BO Analysis
SAP BEx
SAP BO WebISAS
© BARCTHE BI Survey 16
Tibco
1.8
Infor

Report
This KPI is based on how many sites currently use data discovery/visualization with their BI tool.
Data discovery/visualization

16
Viewpoint
©2016 BARC - Business Application Research Center, a CXP Group CompanyQlik in
Data discovery is Qlik’s flagship functionality. With all its products, Qlik has focused from the start on providing interactive and intuitive solutions for navigating and analyzing data targeted at business users. Its customers rate Qlik Sense as a leader in the self-service repor-ting, visual discovery and large international BI vendors peer groups. These results show that although the product is young, it is already well established as a data discovery solution to support users in visualizing and navigating data to find new insights.
Data discovery/visualizationData discovery/visualization – Leader
Peer group: large international BI vendors
Data discovery/visualization – Leader
Data discovery/visualization – Leader
Peer group: visual discovery-focused products
Peer group: self-service reporting-focused products
10.09.8
9.49.4
8.16.8
6.25.6
5.24.74.64.54.54.44.4
4.13.3
1.11.0
Information Builders
MS Power BI
IBM Cognos TM1
Qlik Sense
QlikViewMicroStrategy
Tibco
Tableau
Oracle BI
Peer Group Average
MS SSRS
MS Excel
Infor
IBM Cognos BI
SAP BO Design St.
SAP BO Analysis
SAP BEx
SAP BO WebI
SAS
© BARCTHE BI Survey 16
9.89.4
9.28.9
7.66.66.56.4
5.54.74.64.44.34.2
3.7
Dimensional Insight
Yellowfin
Bissantz
MS Power BI
Phocas
cubus
Qlik Sense
Targit
CybersciencePeer Group Average
Pyramid Analytics
CALUMO
Cubeware
Zoho ReportsSAP BO WebI
© BARCTHE BI Survey 16
10.09.8
9.49.4
9.18.4
8.18.1
7.66.6
Sisense
MS Power BI
Phocas
Qlik Sense
QlikView
Targit
Peer Group Average
Tibco
Tableau
Logi Analytics 6.2
Dundas
Report
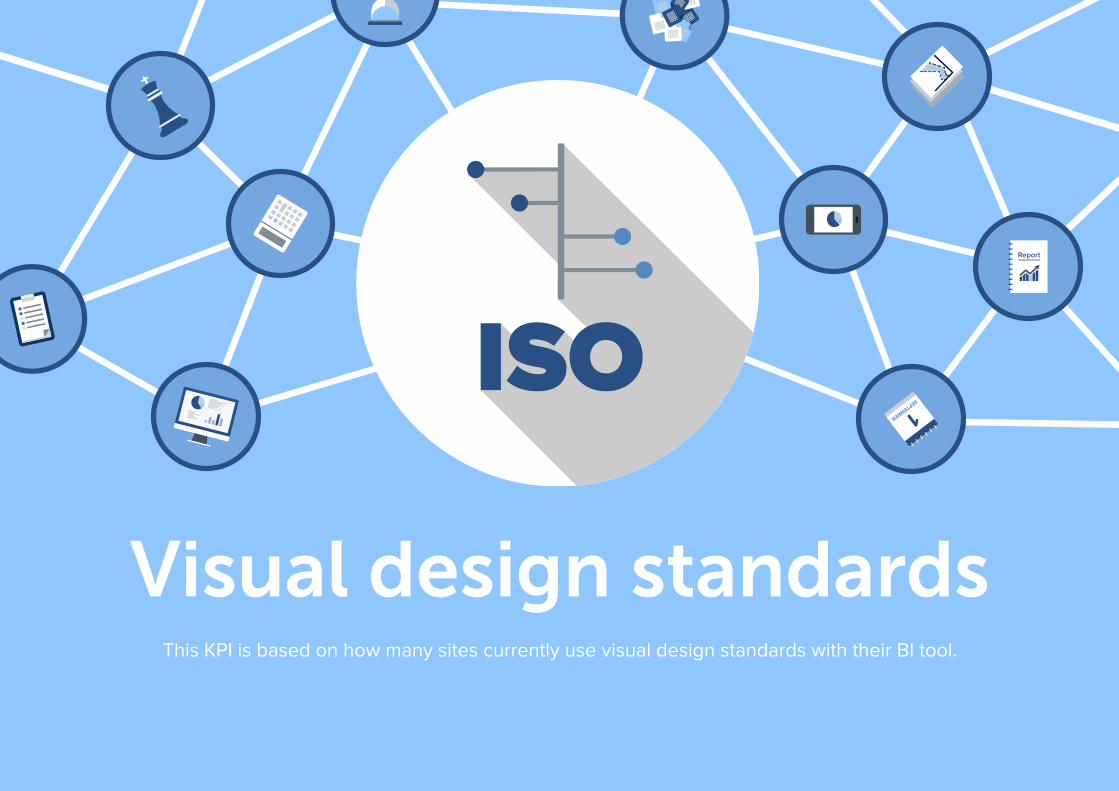
This KPI is based on how many sites currently use visual design standards with their BI tool.
Visual design standards

18
Viewpoint
©2016 BARC - Business Application Research Center, a CXP Group CompanyQlik in
Since its inception, Qlik has put a major empha-sis on visualizations and the visual appearance of Qlik Sense. Qlik Sense is rated as a leader in the visual design standards category among visual discovery and self-service reporting-fo-cused products. This shows that respondents seem to be satisfied with the solution’s visuali-zation capabilities and its features for reusing charts and visualizations in other applications to establish design standards.
Visual design standards
Visual design standards – Leader
Peer group: visual discovery-focused products
Visual design standards – Leader
Peer group: self-service reporting-focused products
7.46.5
5.14.74.74.54.4
3.93.6
2.4
SisenseMS Power BI
Phocas
Qlik SenseQlikView
Targit
Peer Group Average
TibcoTableau
Logi Analytics
© BARCTHE BI Survey 161.0
Dundas
10.07.1
5.14.6
4.33.83.63.4
2.82.82.7
2.41.61.4
1.0
Dimensional InsightYellowfin
Bissantz
MS Power BI
Phocas
cubusQlik Sense
TargitCyberscience
Peer Group Average
Pyramid Analytics
CALUMO
Cubeware
Zoho Reports
SAP BO WebI
© BARCTHE BI Survey 16
Report
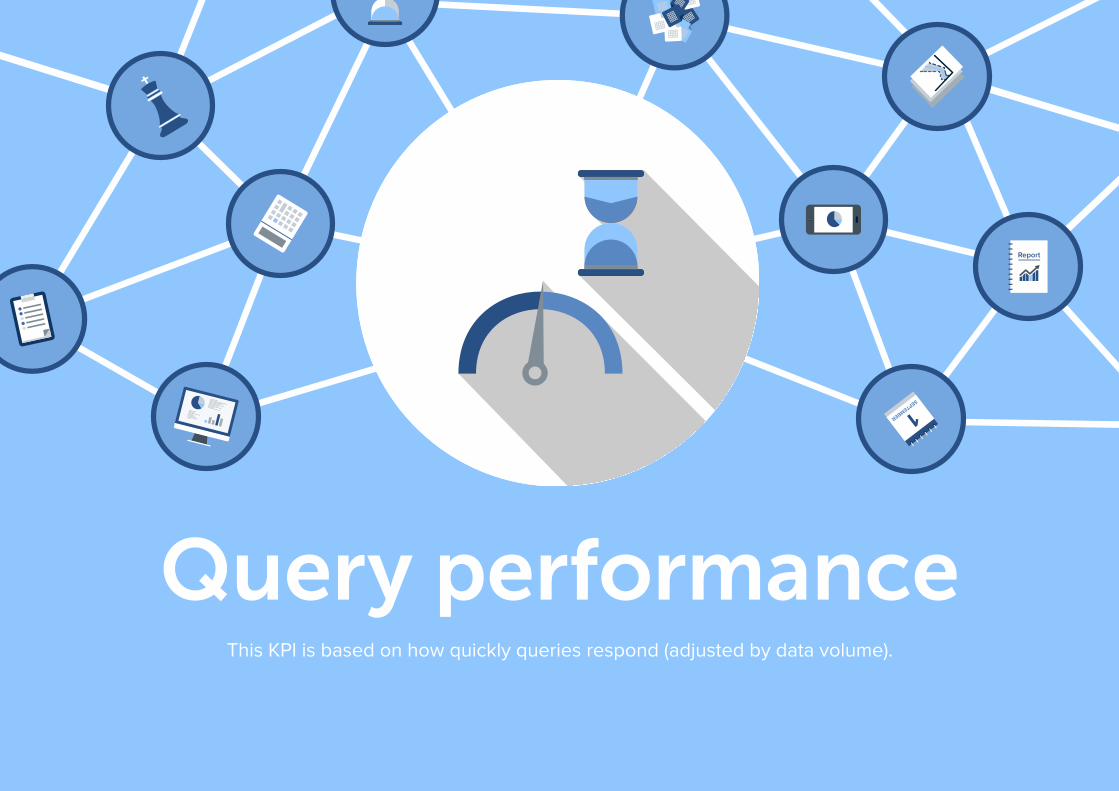
This KPI is based on how quickly queries respond (adjusted by data volume).
Query performance

20
Viewpoint
©2016 BARC - Business Application Research Center, a CXP Group CompanyQlik in
Qlik Sense is the top-ranked visual disco-very-focused product and international BI vendor in terms of query performance. These excellent results support Qlik’s positive messa-ging around the QIX engine. With Qlik Sense, the vendor redesigned its associative engine to deliver better performance than the old Qlik-View engine. Now the QIX engine serves as the underlying engine for all Qlik’s products – including QlikView. Respondents to this years’ Survey seem to be very satisfied with perfor-mance.
Query performanceQuery performance – Top-ranked
Peer group: large international BI vendors
Query performance – Top-ranked
Query performance – Leader
Peer group: visual discovery-focused products
Peer group: self-service reporting-focused products
1.1.
10.07.8
7.15.6
5.04.7
4.54.34.14.14.0
3.63.2
2.31.0
Dimensional Insight
Yellowfin
Bissantz
MS Power BIPhocas
cubus
Qlik Sense
Targit
Cyberscience
Peer Group Average
Pyramid Analytics
CALUMO
Cubeware
Zoho Reports
SAP BO WebI© BARC
THE BI Survey 16
7.87.0
6.24.8
4.54.34.24.14.0
3.3
SisenseMS Power BI
Phocas
Qlik Sense
QlikView
Targit
Peer Group Average
Tibco
TableauLogi Analytics
© BARCTHE BI Survey 162.5
Dundas
7.87.0
6.25.8
4.44.34.3
3.93.73.6
3.33.3
3.02.92.7
2.42.32.2
1.0
Information Builders
MS Power BIIBM Cognos TM1
Qlik Sense
QlikView
MicroStrategy
Tibco
Tableau
Oracle BIPeer Group Average
MS SSRSMS Excel
Infor
IBM Cognos BI
SAP BO Design St.
SAP BO Analysis
SAP BEx
SAP BO WebISAS © BARC
THE BI Survey 16

Report
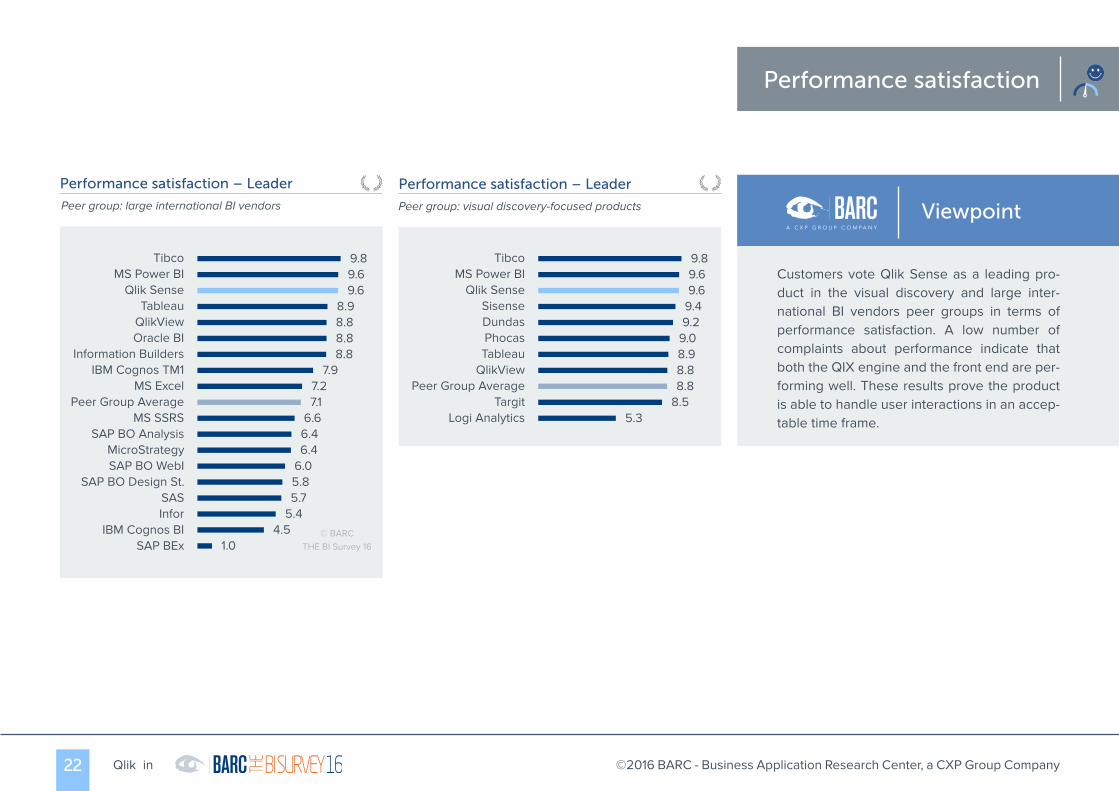
This KPI measures the frequency of complaints about the system’s performance.
Performance satisfaction
22
Viewpoint
©2016 BARC - Business Application Research Center, a CXP Group CompanyQlik in
Customers vote Qlik Sense as a leading pro-duct in the visual discovery and large inter-national BI vendors peer groups in terms of performance satisfaction. A low number of complaints about performance indicate that both the QIX engine and the front end are per-forming well. These results prove the product is able to handle user interactions in an accep-table time frame.
Performance satisfaction
Performance satisfaction – Leader
Peer group: visual discovery-focused products
Performance satisfaction – Leader
Peer group: large international BI vendors
9.89.69.6
8.98.88.88.8
7.97.27.1
6.66.46.4
6.05.85.7
5.44.5
1.0
Information Builders
MS Power BI
IBM Cognos TM1
Qlik Sense
QlikView
MicroStrategy
Tibco
Tableau
Oracle BI
Peer Group AverageMS SSRS
MS Excel
InforIBM Cognos BI
SAP BO Design St.
SAP BO Analysis
SAP BEx
SAP BO WebI
SAS
© BARCTHE BI Survey 16
9.89.69.6
9.49.2
9.08.98.88.8
8.5
Sisense
MS Power BI
Phocas
Qlik Sense
QlikView
TargitPeer Group Average
Tibco
Tableau
Logi Analytics 5.3
Dundas

Report
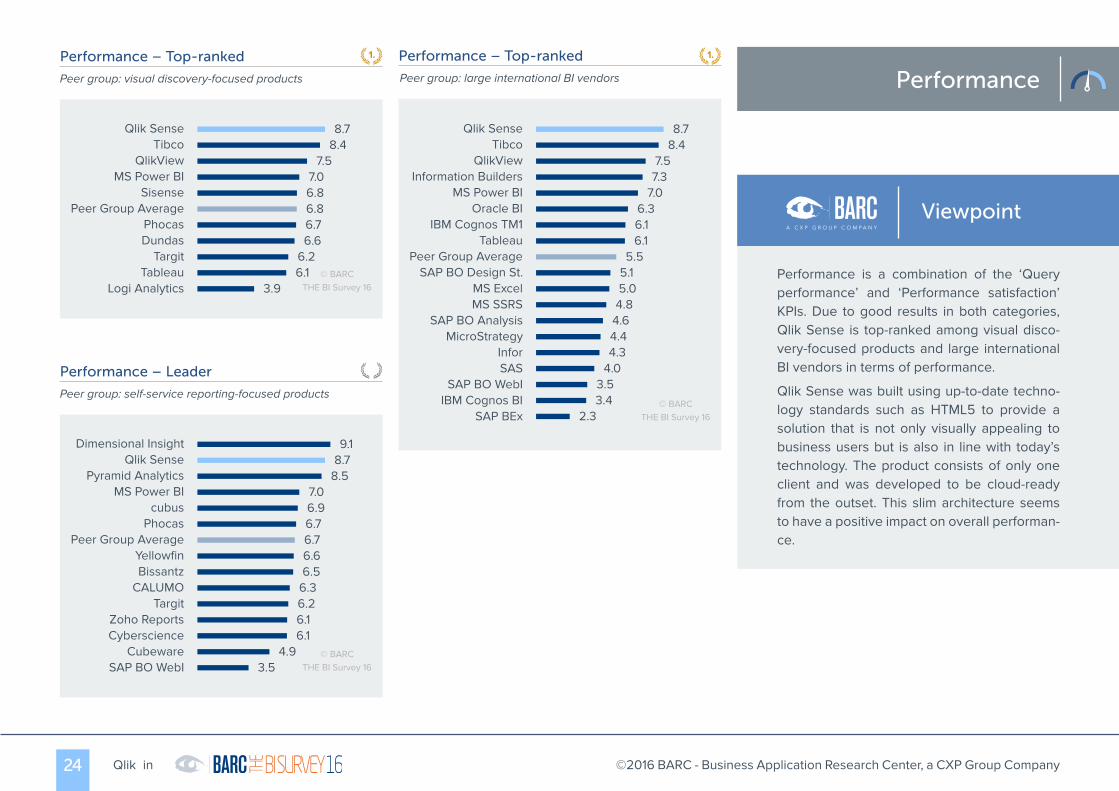
This KPI is a combination of the ‘Query performance’ and ‘Performance satisfaction’ KPIs.
Performance
24
Viewpoint
©2016 BARC - Business Application Research Center, a CXP Group CompanyQlik in
Performance is a combination of the ‘Query performance’ and ‘Performance satisfaction’ KPIs. Due to good results in both categories, Qlik Sense is top-ranked among visual disco-very-focused products and large international BI vendors in terms of performance.
Qlik Sense was built using up-to-date techno-logy standards such as HTML5 to provide a solution that is not only visually appealing to business users but is also in line with today’s technology. The product consists of only one client and was developed to be cloud-ready from the outset. This slim architecture seems to have a positive impact on overall performan-ce.
PerformancePerformance – Top-ranked
Peer group: large international BI vendors
Performance – Top-ranked
Performance – Leader
Peer group: visual discovery-focused products
Peer group: self-service reporting-focused products
1.1.
8.78.4
7.57.06.86.86.76.6
6.26.1
SisenseMS Power BI
Phocas
Qlik Sense
QlikView
Targit
Peer Group Average
Tibco
TableauLogi Analytics
© BARCTHE BI Survey 163.9
Dundas
8.78.4
7.57.3
7.06.36.16.1
5.55.15.04.8
4.64.44.3
4.03.53.4
2.3
Information BuildersMS Power BI
IBM Cognos TM1
Qlik Sense
QlikView
MicroStrategy
Tibco
Tableau
Oracle BI
Peer Group Average
MS SSRSMS Excel
Infor
IBM Cognos BI
SAP BO Design St.
SAP BO Analysis
SAP BEx
SAP BO WebISAS
© BARCTHE BI Survey 16
9.18.7
8.57.06.96.76.76.66.5
6.36.26.16.1
4.93.5
Dimensional Insight
YellowfinBissantz
MS Power BI
Phocascubus
Qlik Sense
Targit
Cyberscience
Peer Group Average
Pyramid Analytics
CALUMO
Cubeware
Zoho Reports
SAP BO WebI© BARC
THE BI Survey 16

Report
This KPI is based on how many sites currently use self-service features with their BI tool.
Self-service

26
Viewpoint
©2016 BARC - Business Application Research Center, a CXP Group CompanyQlik in
Qlik Sense ranks as one of the leaders in pro-viding self-service to users across all its peer groups. The product was developed with a strong emphasis on self-service ad hoc visuali-zation and ad hoc analysis. The vendor’s flags-hip QlikView product already delivered a good set of self-service features to customers but it wasn’t as ad hoc-oriented nor as visual in terms of data integration as Qlik Sense. This above average feedback from Qlik Sense customers confirms the solution has the intuitive and in-teractive UIs and ad hoc capabilities to provide business users with the flexibility and level of self-service they need.
Self-serviceSelf-service – Leader
Peer group: large international BI vendors
Self-service – Leader
Self-service – Leader
Peer group: visual discovery-focused products
Peer group: self-service reporting-focused products
9.88.1
7.87.57.47.2
6.86.8
6.46.26.05.8
5.44.3
1.0
Dimensional InsightYellowfin
Bissantz
MS Power BI
Phocas
cubusQlik Sense
Targit
Cyberscience
Peer Group Average
Pyramid Analytics
CALUMO
Cubeware
Zoho Reports
SAP BO WebI
© BARCTHE BI Survey 16
10.09.3
8.28.1
7.97.6
6.86.8
6.46.46.3
5.65.55.35.35.1
3.53.2
Information Builders
MS Power BI
IBM Cognos TM1
Qlik Sense
QlikView
MicroStrategy
Tableau
Oracle BI
Peer Group Average
MS SSRS
MS Excel
IBM Cognos BI
SAP BO Design St.
SAP BO Analysis
SAP BEx
SAP BO WebI
SAS
© BARCTHE BI Survey 16
Tibco
2.7
Infor
10.08.1
6.86.46.26.16.0
5.15.1
3.9Sisense
MS Power BI
Phocas
Qlik Sense
QlikViewTargit
Peer Group Average
Tibco
Tableau
Logi Analytics© BARC
THE BI Survey 163.7Dundas

Report
This KPI combines the ‘Project length’, ‘Self-service’ and ‘Flexibility for users‘ KPIs.
Agility

28
Viewpoint
©2016 BARC - Business Application Research Center, a CXP Group CompanyQlik in
Qlik Sense is rated as a leader in the ‘Agility’ KPI across all its peer groups. This measure combines the ‘Project length’, ‘Self-service’ and ‘Flexibility for users‘ KPIs. Success in this category means customers rate the product as flexible, strong on self-service capabilities and capable of being implemented within an ac-ceptable timeframe. Thanks to Qlik Sense’s ad hoc orientation, the product is typically used in short projects by business users who want to quickly find and visualize new insights in their data.
AgilityAgility – Leader
Peer group: large international BI vendors
Agility – Leader
Agility – Leader
Peer group: visual discovery-focused products
Peer group: self-service reporting-focused products
8.07.2
6.76.4
6.26.16.0
5.85.6
5.2
SisenseMS Power BI
PhocasQlik Sense
QlikView
Targit
Peer Group Average
Tibco
Tableau
Logi Analytics© BARC
THE BI Survey 164.9Dundas
7.57.4
7.26.76.66.4
6.06.05.85.65.6
5.24.94.7
3.6
Dimensional Insight
Yellowfin
Bissantz
MS Power BI
Phocas
cubus
Qlik Sense
Targit
CybersciencePeer Group Average
Pyramid Analytics
CALUMO
CubewareZoho Reports
SAP BO WebI© BARC
THE BI Survey 16
8.07.2
6.96.46.4
6.16.0
5.65.15.04.9
4.53.63.53.5
3.22.82.7
Information Builders
MS Power BI
IBM Cognos TM1
Qlik Sense
QlikView
MicroStrategy
Tableau
Oracle BI
Peer Group Average
MS SSRS
MS Excel
IBM Cognos BI
SAP BO Design St.
SAP BO Analysis
SAP BEx
SAP BO WebI
SAS
© BARCTHE BI Survey 16
Tibco
2.2
Infor
Report
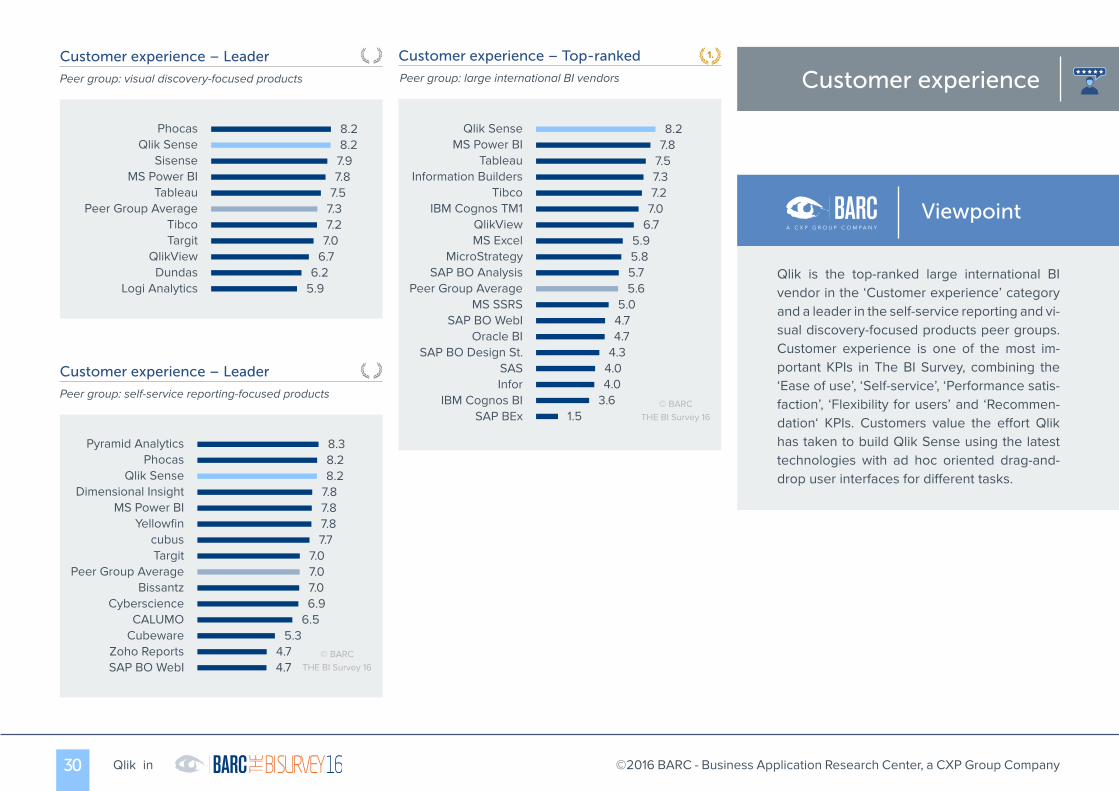
This KPI combines the ‘Ease of use’, ‘Self-service’, ‘Performance satisfaction’, ‘Flexibility for the user’ and ‘Recommendation‘ KPIs.
Customer experience
30
Viewpoint
©2016 BARC - Business Application Research Center, a CXP Group CompanyQlik in
Qlik is the top-ranked large international BI vendor in the ‘Customer experience’ category and a leader in the self-service reporting and vi-sual discovery-focused products peer groups. Customer experience is one of the most im-portant KPIs in The BI Survey, combining the ‘Ease of use’, ‘Self-service’, ‘Performance satis-faction’, ‘Flexibility for users’ and ‘Recommen-dation‘ KPIs. Customers value the effort Qlik has taken to build Qlik Sense using the latest technologies with ad hoc oriented drag-and-drop user interfaces for different tasks.
Customer experienceCustomer experience – Top-ranked
Peer group: large international BI vendors
Customer experience – Leader
Customer experience – Leader
Peer group: visual discovery-focused products
Peer group: self-service reporting-focused products
1.
8.27.8
7.57.37.2
7.06.7
5.95.85.75.6
5.04.74.7
4.34.04.0
3.6
Information Builders
MS Power BI
IBM Cognos TM1
Qlik Sense
QlikView
MicroStrategy
Tableau
Oracle BI
Peer Group AverageMS SSRS
MS Excel
IBM Cognos BI
SAP BO Design St.
SAP BO Analysis
SAP BEx
SAP BO WebI
SAS
© BARCTHE BI Survey 16
Tibco
1.5
Infor
8.38.28.2
7.87.87.87.7
7.07.07.06.9
6.55.3
4.74.7
Dimensional Insight
Yellowfin
Bissantz
MS Power BI
Phocas
cubus
Qlik Sense
Targit
Cyberscience
Peer Group Average
Pyramid Analytics
CALUMOCubeware
Zoho ReportsSAP BO WebI
© BARCTHE BI Survey 16
8.28.2
7.97.8
7.57.37.2
7.06.7
6.2
SisenseMS Power BI
PhocasQlik Sense
QlikViewTargit
Peer Group AverageTibco
Tableau
Logi Analytics 5.9Dundas

Report
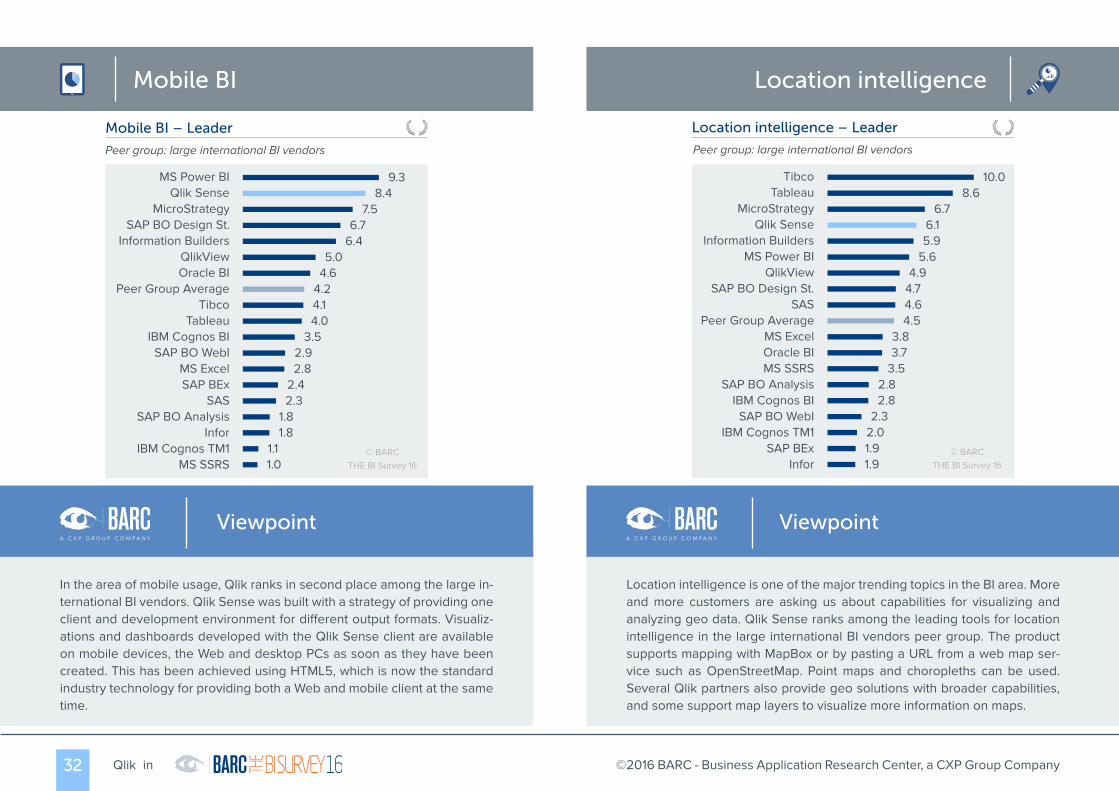
The mobile BI KPI is based on how many sites currently use mobile BI with their BI tool.
The location intelligence KPI is based on how many sites currently use spatial/location analysis with their BI tool.
Mobile BI & location intelligence
32 ©2016 BARC - Business Application Research Center, a CXP Group CompanyQlik in
Location intelligenceMobile BI
Location intelligence is one of the major trending topics in the BI area. More and more customers are asking us about capabilities for visualizing and analyzing geo data. Qlik Sense ranks among the leading tools for location intelligence in the large international BI vendors peer group. The product supports mapping with MapBox or by pasting a URL from a web map ser-vice such as OpenStreetMap. Point maps and choropleths can be used. Several Qlik partners also provide geo solutions with broader capabilities, and some support map layers to visualize more information on maps.
Viewpoint
In the area of mobile usage, Qlik ranks in second place among the large in-ternational BI vendors. Qlik Sense was built with a strategy of providing one client and development environment for different output formats. Visualiz-ations and dashboards developed with the Qlik Sense client are available on mobile devices, the Web and desktop PCs as soon as they have been created. This has been achieved using HTML5, which is now the standard industry technology for providing both a Web and mobile client at the same time.
Viewpoint
Mobile BI – Leader
Peer group: large international BI vendors
9.38.4
7.56.7
6.45.0
4.64.24.14.0
3.52.92.8
2.42.3
1.81.8
1.11.0
Information Builders
MS Power BI
IBM Cognos TM1
Qlik Sense
QlikView
MicroStrategy
TibcoTableau
Oracle BIPeer Group Average
MS SSRS
MS Excel
Infor
IBM Cognos BI
SAP BO Design St.
SAP BO Analysis
SAP BEx
SAP BO WebI
SAS
© BARCTHE BI Survey 16
Location intelligence – Leader
Peer group: large international BI vendors
10.08.6
6.76.15.9
5.64.9
4.74.64.5
3.83.7
3.52.82.8
2.32.01.91.9
Information BuildersMS Power BI
IBM Cognos TM1
Qlik Sense
QlikView
MicroStrategy
TibcoTableau
Oracle BI
Peer Group Average
MS SSRS
MS Excel
Infor
IBM Cognos BI
SAP BO Design St.
SAP BO Analysis
SAP BEx
SAP BO WebI
SAS
© BARCTHE BI Survey 16

Report
The innovation KPI combines the ‘Big Data Analytics‘, ‘Cloud BI’, ‘Collaboration’, ‘Data discovery/visualization‘, ‘Mobile BI’, ‘Operational BI‘, ‘Location intelligence‘ and ‘Visual design standards’ KPIs to measure the product’s level of innovation.
The considered for purchase KPI is based on whether respondents considered purchasing the pro-duct.
Innovation & considered for purchase

34 ©2016 BARC - Business Application Research Center, a CXP Group CompanyQlik in
Qlik Sense is considered for purchase more than most other self-service re-porting-focused products. Existing Qlik customers - as well as other companies searching for a self-service data discovery and visualization solution - tend to evaluate Qlik Sense. This high ranking is very impressive considering the pro-duct is still so young. Qlik Sense’s features and appearance seem to convince users to take a closer look. Data from The BI Survey 16 shows that - in most cases - the product competes well with its older sibling QlikView.
Viewpoint
Qlik Sense ranks as one of the leading innovative products in the self-service reporting-focused products peer group. It was built using up-to-date technolo-gy and created as a cloud-ready solution to be used on various devices with a focus on providing an intuitive UI so users would require a minimum of training. Qlik also opened its APIs, which can be used by partners and other developers, so the solution can be extended with additional features or modules, or used in modern BI usage scenarios such as embedded BI. Customers see these in-vestments in a positive light and consider Qlik Sense as an innovative solution.
Viewpoint
Considered for purchaseInnovation
Innovation – Leader
Peer group: self-service reporting-focused products
7.06.8
5.54.84.84.64.64.44.44.34.24.1
3.33.13.0
Dimensional Insight
Yellowfin
Bissantz
MS Power BI
Phocas
cubus
Qlik Sense
Targit
Cyberscience
Peer Group AveragePyramid Analytics
CALUMO
Cubeware
Zoho Reports
SAP BO WebI© BARC
THE BI Survey 16
Considered for purchase – Leader
Peer group: self-service reporting-focused products
5.14.4
3.82.52.32.2
1.81.61.51.41.41.21.21.11.1
Dimensional Insight
Yellowfin
Bissantz
MS Power BI
Phocas
cubus
Qlik Sense
Targit
Cyberscience
Peer Group Average
Pyramid Analytics
CALUMO
Cubeware
Zoho Reports
SAP BO WebI
© BARCTHE BI Survey 16

Report
The vendor support KPI measures user satisfaction with the level of vendor support provided for the product.
The product satisfaction KPI is based on the frequency of problems encountered with the product.
Vendor support & product satisfaction

36 ©2016 BARC - Business Application Research Center, a CXP Group CompanyQlik in
Product satisfactionVendor support
Qlik Sense is top-ranked for ‘Product satisfaction’ in the large interna-tional BI vendors peer group, despite the fact that the solution is still young and features are still being added release by release. However, customers seem to be very satisfied with the software and report less problems than users of rival solutions. Qlik Sense may not be the most feature-rich product, but it seems to be well-conceived and less buggy than competing products from other large BI vendors.
Viewpoint
Qlik has always been one of the leading vendors in providing good support. The company has grown from a small Swedish one-product company into a large international enterprise with a range of different products based on one central engine. However, according to customer feedback, Qlik has not lost its closeness to customers and remains able to provide a good level of support for its two major products: QlikView and Qlik Sense.
Viewpoint
Vendor support – Leader
Peer group: large international BI vendors
8.27.1
6.96.3
5.85.7
5.45.45.3
5.15.05.04.8
4.03.8
3.53.13.0
1.0
Information Builders
MS Power BI
IBM Cognos TM1
Qlik SenseQlikView
MicroStrategy
Tibco
Tableau
Oracle BI
Peer Group Average
MS SSRSMS Excel
Infor
IBM Cognos BI
SAP BO Design St.
SAP BO AnalysisSAP BEx
SAP BO WebI
SAS
© BARCTHE BI Survey 16
Product satisfaction – Top-ranked
Peer group: large international BI vendors
6.36.2
5.45.0
4.74.7
3.33.2
3.03.02.8
2.32.22.02.0
1.61.61.3
1.0
Information Builders
MS Power BIIBM Cognos TM1
Qlik Sense
QlikView
MicroStrategy
TibcoTableau
Oracle BI
Peer Group AverageMS SSRS
MS ExcelInfor
IBM Cognos BISAP BO Design St.
SAP BO Analysis
SAP BEx
SAP BO WebI
SAS
© BARCTHE BI Survey 16
1.

Report
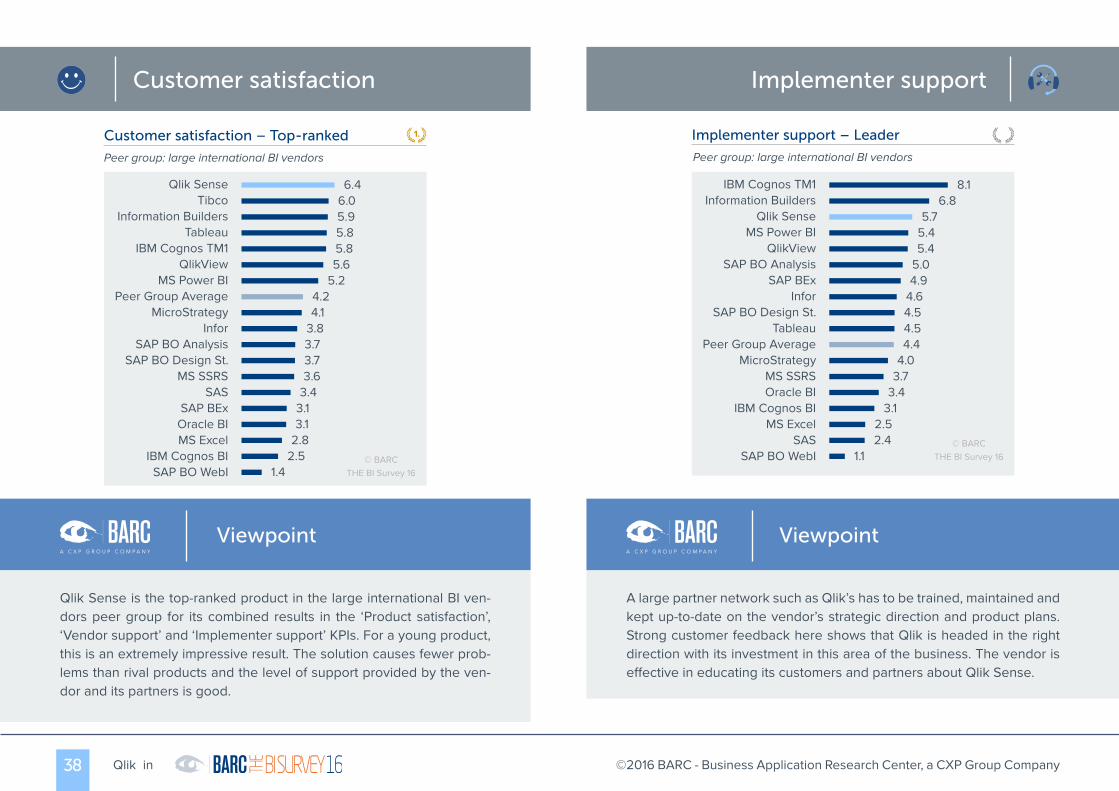
The customer satisfaction KPI combines the ‘Product satisfaction’, ‘Vendor support’ and ‘Implemen-ter support’ KPIs.
The implementer support KPI measures user satisfaction with the level of vendor support provided for the product.
Customer satisfaction & implementer support
38 ©2016 BARC - Business Application Research Center, a CXP Group CompanyQlik in
Implementer support
A large partner network such as Qlik’s has to be trained, maintained and kept up-to-date on the vendor’s strategic direction and product plans. Strong customer feedback here shows that Qlik is headed in the right direction with its investment in this area of the business. The vendor is effective in educating its customers and partners about Qlik Sense.
Viewpoint
Qlik Sense is the top-ranked product in the large international BI ven-dors peer group for its combined results in the ‘Product satisfaction’, ‘Vendor support’ and ‘Implementer support’ KPIs. For a young product, this is an extremely impressive result. The solution causes fewer prob-lems than rival products and the level of support provided by the ven-dor and its partners is good.
Viewpoint
Customer satisfaction
Customer satisfaction – Top-ranked
Peer group: large international BI vendors
1.
6.46.05.95.85.85.6
5.24.24.1
3.83.73.73.6
3.43.13.1
2.82.5
Information Builders
MS Power BI
IBM Cognos TM1
Qlik Sense
QlikView
MicroStrategy
Tableau
Oracle BI
Peer Group Average
MS SSRS
MS Excel
Infor
IBM Cognos BI
SAP BO Design St.SAP BO Analysis
SAP BEx
SAP BO WebI
SAS
© BARCTHE BI Survey 161.4
Tibco
Implementer support – Leader
Peer group: large international BI vendors
8.16.8
5.75.45.4
5.04.9
4.64.54.54.4
4.03.7
3.43.1
2.52.4
1.1
Information Builders
MS Power BI
IBM Cognos TM1
Qlik Sense
QlikView
MicroStrategy
Tableau
Oracle BI
Peer Group Average
MS SSRS
MS Excel
Infor
IBM Cognos BI
SAP BO Design St.
SAP BO AnalysisSAP BEx
SAP BO WebISAS © BARC
THE BI Survey 16

Report
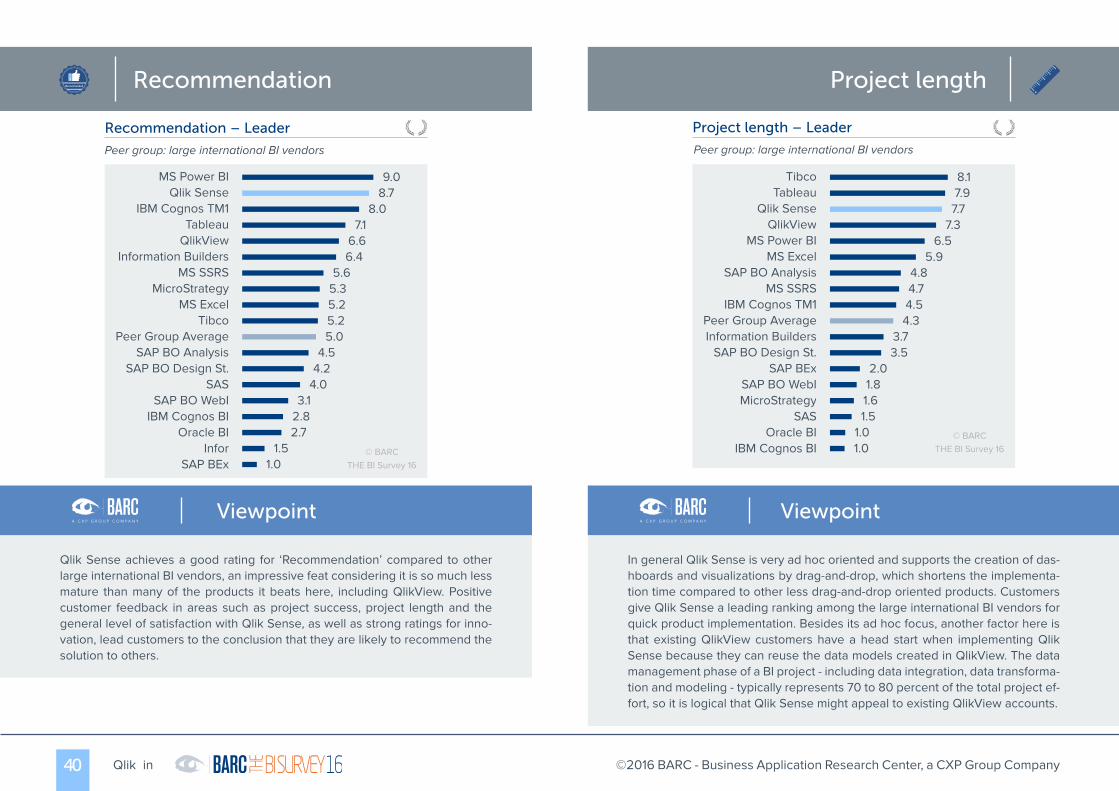
The recommendation KPI is based on how many users would recommend the product to others.
The project length KPI is based on how quickly the product is implemented.
Recommendation& project length
Recommended
40 ©2016 BARC - Business Application Research Center, a CXP Group CompanyQlik in
Project lengthRecommendationRecommended
In general Qlik Sense is very ad hoc oriented and supports the creation of das-hboards and visualizations by drag-and-drop, which shortens the implementa-tion time compared to other less drag-and-drop oriented products. Customers give Qlik Sense a leading ranking among the large international BI vendors for quick product implementation. Besides its ad hoc focus, another factor here is that existing QlikView customers have a head start when implementing Qlik Sense because they can reuse the data models created in QlikView. The data management phase of a BI project - including data integration, data transforma-tion and modeling - typically represents 70 to 80 percent of the total project ef-fort, so it is logical that Qlik Sense might appeal to existing QlikView accounts.
Viewpoint
Qlik Sense achieves a good rating for ‘Recommendation’ compared to other large international BI vendors, an impressive feat considering it is so much less mature than many of the products it beats here, including QlikView. Positive customer feedback in areas such as project success, project length and the general level of satisfaction with Qlik Sense, as well as strong ratings for inno-vation, lead customers to the conclusion that they are likely to recommend the solution to others.
Viewpoint
Recommendation – Leader
Peer group: large international BI vendors
9.08.7
8.07.1
6.66.4
5.65.35.25.25.0
4.54.2
4.03.1
2.82.7
1.51.0
Information Builders
MS Power BI
IBM Cognos TM1Qlik Sense
QlikView
MicroStrategy
Tibco
Tableau
Oracle BI
Peer Group Average
MS SSRS
MS Excel
Infor
IBM Cognos BI
SAP BO Design St.SAP BO Analysis
SAP BEx
SAP BO WebISAS
© BARCTHE BI Survey 16
Project length – Leader
Peer group: large international BI vendors
8.17.97.7
7.36.5
5.94.84.74.54.3
3.73.5
2.01.81.61.5
1.01.0
Information Builders
MS Power BI
IBM Cognos TM1
Qlik SenseQlikView
MicroStrategy
Tableau
Oracle BI
Peer Group Average
MS SSRS
MS Excel
IBM Cognos BI
SAP BO Design St.
SAP BO Analysis
SAP BExSAP BO WebI
SAS© BARC
THE BI Survey 16
Tibco

Report
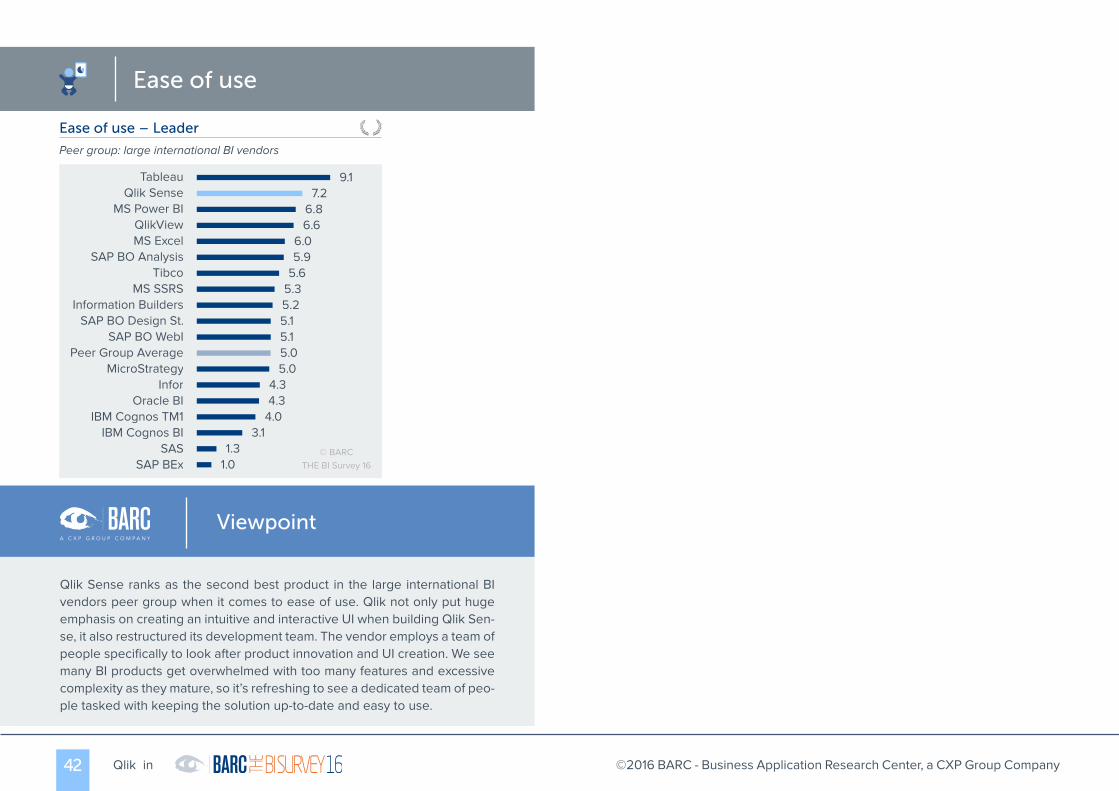
This KPI is based on how often the product was chosen for its ease of use, and on the level of com-plaints about ease of use post-implementation.
Ease of use
42 ©2016 BARC - Business Application Research Center, a CXP Group CompanyQlik in
Ease of use
Qlik Sense ranks as the second best product in the large international BI vendors peer group when it comes to ease of use. Qlik not only put huge emphasis on creating an intuitive and interactive UI when building Qlik Sen-se, it also restructured its development team. The vendor employs a team of people specifically to look after product innovation and UI creation. We see many BI products get overwhelmed with too many features and excessive complexity as they mature, so it’s refreshing to see a dedicated team of peo-ple tasked with keeping the solution up-to-date and easy to use.
Viewpoint
Ease of use – Leader
Peer group: large international BI vendors
9.17.2
6.86.6
6.05.9
5.65.35.25.15.15.05.0
4.34.3
4.03.1
1.3
Information Builders
MS Power BI
IBM Cognos TM1
Qlik Sense
QlikView
MicroStrategy
Tableau
Oracle BI
Peer Group Average
MS SSRS
MS Excel
IBM Cognos BI
SAP BO Design St.
SAP BO Analysis
SAP BEx
SAP BO WebI
SAS © BARCTHE BI Survey 16
Tibco
1.0
Infor
Report
QlikView
User & use case demographics
44 ©2016 BARC - Business Application Research Center, a CXP Group CompanyQlik in
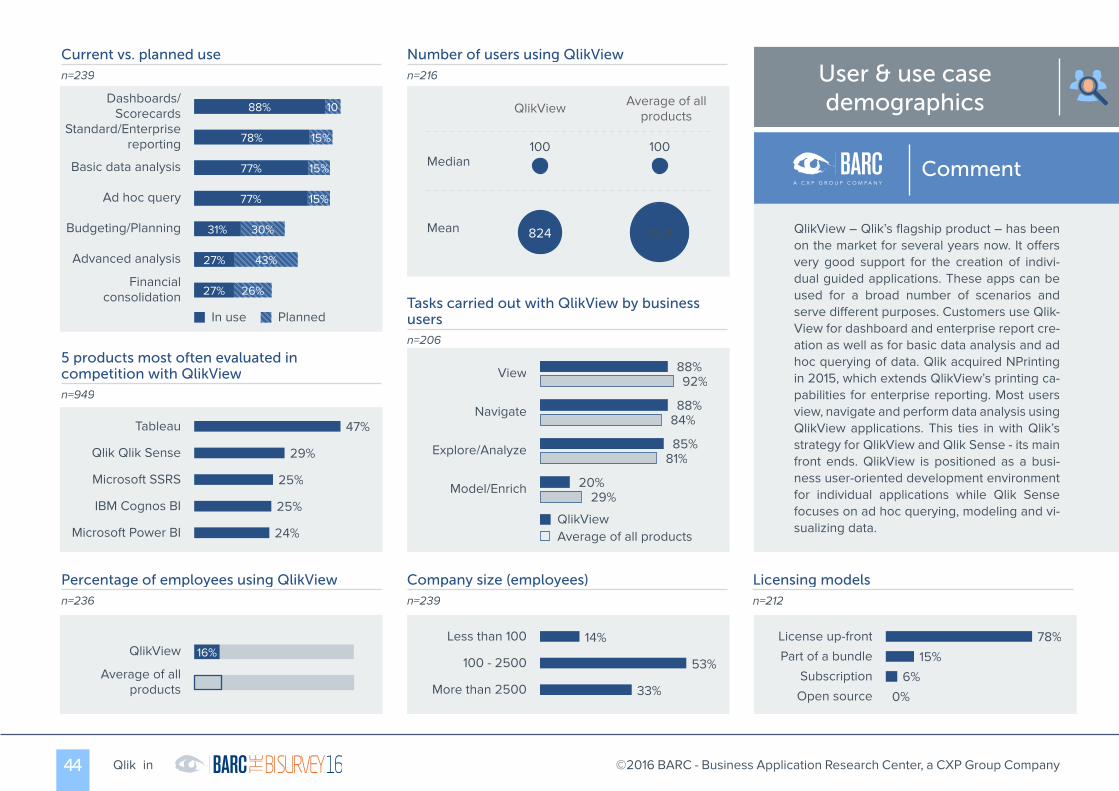
Current vs. planned usen=239
In use Planned
88%
78%
77%
77%
31%
27%
27%
10
15%
15%
15%
30%
43%
26%
Dashboards/Scorecards
Standard/Enterprisereporting
Basic data analysis
Ad hoc query
Budgeting/Planning
Advanced analysis
Financialconsolidation
5 products most often evaluated incompetition with QlikViewn=949
47%
29%
25%
25%
24%
Tableau
Qlik Qlik Sense
Microsoft SSRS
IBM Cognos BI
Microsoft Power BI
Percentage of employees using QlikViewn=236
16%
17%
QlikView
Average of allproducts
Number of users using QlikViewn=216
Median
Mean 824
100
1521
100
QlikView Average of allproducts
Company size (employees)n=239
14%
53%
33%
Less than 100
100 - 2500
More than 2500
Licensing modelsn=212
78%15%
6%0%
License up-frontPart of a bundle
SubscriptionOpen source
Tasks carried out with QlikView by businessusersn=206
QlikViewAverage of all products
88%92%
88%84%
85%81%
20%29%
View
Navigate
Explore/Analyze
Model/Enrich
QlikView – Qlik’s flagship product – has been on the market for several years now. It offers very good support for the creation of indivi-dual guided applications. These apps can be used for a broad number of scenarios and serve different purposes. Customers use Qlik-View for dashboard and enterprise report cre-ation as well as for basic data analysis and ad hoc querying of data. Qlik acquired NPrinting in 2015, which extends QlikView’s printing ca-pabilities for enterprise reporting. Most users view, navigate and perform data analysis using QlikView applications. This ties in with Qlik’s strategy for QlikView and Qlik Sense - its main front ends. QlikView is positioned as a busi-ness user-oriented development environment for individual applications while Qlik Sense focuses on ad hoc querying, modeling and vi-sualizing data.
Comment
Peer Groups & KPIs Large enterprise BI platforms
Includes products equipped with functionality for enterprise deployments that focus on a broad range of BI use cases.
Dashboarding-focused products
Includes products that focus on creating advanced and highly sophisticated dashboards.
Self-service reporting-focused products
Includes products that focus on self-service reporting and ad hoc analysis.
OLAP analysis-focused products
Includes products that focus on analysis in dimensio-nal and hierarchical data models.
Visual data discovery-focused products
Includes products that focus on visual data discovery and advanced data visualization.
Integrated performance management products
Includes products that provide integrated functiona-lity for BI and performance management, especially planning and budgeting.
Large international BI vendors
Includes products from companies with annual re-venues of $200m+ and a truly international reach.
EMEA-focused vendors
Includes products from vendors that have a signifi-cant presence in - and focus on - the EMEA region.
Americas-focused vendors
Includes products from vendors that have a signifi-cant presence in - and focus on - the Americas region.
Peer Group Classification Peer Groups Overview
The KPIs
45 ©2016 BARC - Business Application Research Center, a CXP Group CompanyQlik in
THE BI Survey 16 features a range of different types of BI tools so we use peer groups to help identify competing products. The groups are essential to al-low fair and useful comparisons of products that are likely to compete.
The peer groups have been defined by BARC ana-lysts using their experience and judgment, with segmentation based on two key factors:
1. Usage scenario - functional peer groups are mainly data-driven and ba-sed on how customers say they use the product.
2. Regional focus - is the vendor a large international vendor with a truly global presence or does it focus on a particu-lar region. We also take into account the location of BI Survey respondents.
QlikView features in the following peer groups:
• Large international BI vendors
• Dashboarding-focused products
• Visual discovery-focused products
THE BI Survey 16 provides the reader with well-de-signed KPI dashboards packed with concise infor-mation, which can be absorbed at a glance. The KPIs all follow these simple rules:
• Only measures that have a clear good/bad trend are used as the basis for KPIs.
• KPIs may be based on one or more measures from THE BI Survey.
• Only products with samples of at least 20 - 30 (depending on the KPI) for each of the questions that feeds into the KPI are included.
• For quantitative data, KPIs are conver-ted to a scale of 1 to 10 (worst to best).
• A linear min-max transformation is ap-plied, which preserves the order of, and the relative distance between, pro-ducts‘ scores.
The terms ‘top-ranked’ and ‘leader’ are used in the following KPI chart titles. ‘Top-ranked’ indicates first position. ‘Leader’ usually denotes a position in the top 20-25% of products listed in the chart.

Report
This KPI is based on the median volume of data in databases used with the BI tool.
Data volume
TBTBTB

47 ©2016 BARC - Business Application Research Center, a CXP Group CompanyQlik in
Customers claim to process high data volumes compared to other visual discovery-focused products, rating QlikView in second place in this peer group. QlikView’s ranking has impro-ved in this KPI over recent years. The product has always used a proprietary associative en-gine, which processes data in-memory. With its redesigned in-memory engine - now known as QIX – Qlik’s capacity for handling large data volumes could improve further in the coming years. Since QlikView 12, both Qlik Sense and QlikView have used the QIX engine. As only 15 percent of respondents to this survey have upgraded to version 12 so far, its impact on QlikView’s results in The BI Survey 16 is mini-mal.
Viewpoint
Improved in data volume
Peer group: visual discovery-focused products
Data volume – Leader
Peer group: visual discovery-focused products
Data volumeTBTBTB
10.03.7
3.23.13.03.0
2.41.61.61.41.3
Sisense
MS Power BIPhocas
Qlik Sense
QlikView
Targit
Peer Group Average
Tibco
Tableau
Dundas
Logi Analytics© BARC
THE BI Survey 16
2011 2012 2013 2014 2015 2016
4.
8.
9.
10.
7.
2.
6.
3.
5.
1.
Sisense
Tableau
Targit
Tibco
Dundas
Logi Analytics
MS Power BI
Phocas
Qlik Sense
QlikView

Report
This KPI is based on how many sites currently use real-time data from transactional systems with their BI tool.
Operational BI

49
Viewpoint
©2016 BARC - Business Application Research Center, a CXP Group CompanyQlik in
Demographic data from The BI Survey 16 shows that QlikView’s applications service dif-ferent BI usage scenarios. The vendor is one of the leading large international BI vendors for operational BI, confirming the solution’s fo-cus on building individual applications. In most cases in this area, data comes directly out of production systems. Many enterprises are loo-king for ways to blend archived analytical data within operational data to be able to gain si-tuational awareness of opportunities or issues impacting their businesses. QlikView supports these usage scenarios by providing script-ori-ented and flexible capabilities to integrate and mash up data as well as visualize it for busi-ness users using dashboard applications.
Improved in operational BI
Peer group: large international BI vendors
Operational BI – Leader
Peer group: large international BI vendors
Operational BI
10.06.5
5.35.2
5.04.9
4.44.24.24.24.04.0
3.43.4
3.13.1
2.71.4
1.0
Information Builders
MS Power BI
IBM Cognos TM1
Qlik Sense
QlikViewMicroStrategy
Tibco
Tableau
Oracle BI
Peer Group Average
MS SSRS
MS Excel
Infor
IBM Cognos BI
SAP BO Design St.
SAP BO Analysis
SAP BEx
SAP BO WebI
SAS© BARC
THE BI Survey 16
2014 2015 2016
12.
15.
17.
1.
14.
7.
5.4.
6.
13.
3.
16.
10.
8.
11.
18.
9.
2.
SAP Bex
SAP BO Analysis
SAP BO Design St.
SAP BO WebI
SAS
Tableau
Tibco
IBM Cognos BI
IBM Cognos TM1
Infor
Information Builders
MicroStrategy
MS Excel
MS Power BI
MS SSRSOracle BI
Qlik Sense
QlikView

Report
This KPI is based on whether respondents considered purchasing the product.
Considered for purchase

51
Viewpoint
©2016 BARC - Business Application Research Center, a CXP Group CompanyQlik in
QlikView is the top-ranked product in all of its peer groups in this KPI, showing that organiz-ations often consider purchasing the solution. The company pursues a non-technical marke-ting and sales strategy that has worked very well and made the vendor popular across the global BI market. Customers acknowledge Qlik’s investment in marketing and regularly consider the solution in their BI evaluations. Qlik has maintained this top ranking for the last four years.
Considered for purchase – Top-ranked 1.1.
1.
Peer group: large international BI vendors
Considered for purchase – Top-ranked
Peer group: dashboarding-focused products
Considered for purchase – Top-ranked
Peer group: visual discovery-focused products
Considered for purchase
10.08.07.9
6.15.25.1
4.44.4
4.14.03.8
3.53.33.13.0
2.22.12.1
1.6Information Builders
MS Power BI
IBM Cognos TM1
Qlik Sense
QlikView
MicroStrategy
Tibco
Tableau
Oracle BI
Peer Group Average
MS SSRSMS Excel
Infor
IBM Cognos BI
SAP BO Design St.
SAP BO Analysis
SAP BEx
SAP BO WebI
SAS© BARC
THE BI Survey 16
10.08.0
5.13.8
3.62.1
1.51.41.41.41.2
Sisense
MS Power BI
Phocas
Qlik Sense
QlikView
Targit
Peer Group AverageTibco
Tableau
Dundas
Logi Analytics
© BARCTHE BI Survey 16
10.08.0
5.13.5
2.82.4
2.11.81.61.51.51.41.41.41.21.1Dimensional Insight
SisenseYellowfin
MS Power BI
arcplan (Longview)
QlikView
Cyberscience
Tibco
Pyramid Analytics
Peer Group Average
Tableau
BOARD
DundasLogi Analytics
Zoho Reports
SAP BO Design St.
© BARCTHE BI Survey 161.0CXO-Cockpit

52 ©2016 BARC - Business Application Research Center, a CXP Group CompanyQlik in
Consistently top-ranked in considered for purchase
Consistently top-ranked in considered for purchase
Consistently top-ranked in considered for purchase
Peer group: visual discovery-focused productsPeer group: dashboarding-focused productsPeer group: large international BI vendors
Considered for purchase
2013 2014 2015 2016
7.
5.
16.
8.
15.
13.12.
3.
11.
1.
4.
9.
2.
6.
10.
14.
SAP BO Design St.
Sisense
Tableau
Tibco
Yellowfin
Zoho Reports
arcplan (Longview)
BOARD
CXO-Cockpit
Cyberscience
Dimensional Insight
DundasLogi Analytics
MS Power BI
Pyramid Analytics
QlikView
2013 2014 2015 2016
5.
12.
15.
18.
3.
6.
4.
9.
13.
10.
1.
14.
8.
11.
7.
16.
2.
17.
SAP Bex
SAP BO Analysis
SAP BO Design St.
SAP BO WebI
SAS
Tableau
Tibco
IBM Cognos BI
IBM Cognos TM1
Infor
Information Builders
MicroStrategy
MS Excel
MS Power BI
MS SSRS
Oracle BI
Qlik Sense
QlikView
2013 2014 2015 2016
8.
7.
3.
10.
4.
1.
6.
2.
8.
5.
Sisense
Tableau
Targit
Tibco
Dundas
Logi Analytics
MS Power BI
Phocas
Qlik Sense
QlikView

Report
This KPI combines the ‘Considered for purchase’, ‘Competitive win rate’ and ‘Chosen as standard’ KPIs.
Competitiveness

54
Viewpoint
©2016 BARC - Business Application Research Center, a CXP Group CompanyQlik in
QlikView is a leader in ‘Competitiveness’ in the large international BI vendors and visual dis-covery-focused products peer groups. Custo-mers see Qlik as one of the most competitive vendors in the BI space, and give it good ratings in the ‘Considered for purchase’, ‘Competitive win rate’ and ‘Chosen as standard’ KPIs. Qlik’s competitiveness is rooted in its business-orien-ted software and agility in sales situations. The sales process is targeted towards a short proof of concept and can produce rapid benefits for customers. Qlik also uses a large partner net-work efficiently, which is an excellent asset for the vendor.
CompetitivenessCompetitiveness – Leader
Peer group: large international BI vendors
Competitiveness – Leader
Consistently high ratings in competitiveness
Peer group: visual discovery-focused products
Peer group: visual discovery-focused products
6.55.7
4.74.6
4.04.0
3.53.43.3
2.62.1
Sisense
MS Power BI
Phocas
Qlik Sense
QlikView
Targit
Peer Group Average
Tibco
Tableau
DundasLogi Analytics
© BARCTHE BI Survey 16
6.56.16.0
5.74.74.6
4.34.24.24.03.7
3.43.3
2.92.62.6
Dimensional Insight
Sisense
Yellowfin
MS Power BI
arcplan (Longview)
QlikView
Cyberscience
Tibco
Pyramid Analytics
Peer Group Average
Tableau
BOARDDundas
Logi Analytics
Zoho Reports
SAP BO Design St.
© BARCTHE BI Survey 162.1
CXO-Cockpit
2011 2012 2013 2014 2015 2016
9.
8.
4.
1.
6.
2.
5.
3.
7.
10.
Sisense
Tableau
Targit
Tibco
Dundas
Logi Analytics
MS Power BI
Phocas
Qlik Sense
QlikView

Report
This KPI is based on the frequency of problems encountered with the product.
Product satisfaction

56 ©2016 BARC - Business Application Research Center, a CXP Group CompanyQlik in
Product satisfaction is an important KPI, as it relates to the number of problems typically encountered in the use of the product. Custo-mers report relatively few issues with QlikView, rating it above average in the large internatio-nal BI vendors peer group. QlikView is a ma-ture product that has excelled in this category in each of the last five years.
Viewpoint
Product satisfaction
Two top placings in product satisfaction in the last five years
Peer group: large international BI vendors
Product satisfaction – Leader
Peer group: large international BI vendors
6.36.2
5.45.0
4.74.7
3.33.2
3.03.02.8
2.32.22.02.0
1.61.61.3
1.0
Information Builders
MS Power BIIBM Cognos TM1
Qlik Sense
QlikView
MicroStrategy
TibcoTableau
Oracle BI
Peer Group AverageMS SSRS
MS ExcelInfor
IBM Cognos BISAP BO Design St.
SAP BO Analysis
SAP BEx
SAP BO WebI
SAS
© BARCTHE BI Survey 16
2012 2013 2014 2015 2016
16.
5.
13.
8.
12.
6.7.
9.10.
1.
4.
18.
15.
17.
14.
11.
3.2.
SAP Bex
SAP BO Analysis
SAP BO Design St.
SAP BO WebI
SAS
TableauTibco
IBM Cognos BI
IBM Cognos TM1
Infor
Information BuildersMicroStrategy
MS Excel
MS Power BIMS SSRS
Oracle BI
Qlik Sense
QlikView

Report
This KPI measures user satisfaction with the level of vendor support provided for the product.
Vendor support

58
Viewpoint
©2016 BARC - Business Application Research Center, a CXP Group CompanyQlik in
QlikView receives above average feedback for vendor support compared to other large inter-national BI vendors. The vendor has been able to maintain its leading position in this KPI while undergoing rapid growth and changes to its product strategy in recent years. This user fee-dback shows that Qlik has been able to grow as a vendor while keeping a close eye on its customers’ needs.
Vendor support
Consistently outstanding in vendor support
Peer group: large international BI vendors
Vendor support – Leader
Peer group: large international BI vendors
8.27.1
6.96.3
5.85.7
5.45.45.3
5.15.05.04.8
4.03.8
3.53.13.0
1.0
Information Builders
MS Power BI
IBM Cognos TM1
Qlik SenseQlikView
MicroStrategy
Tibco
Tableau
Oracle BI
Peer Group Average
MS SSRSMS Excel
Infor
IBM Cognos BI
SAP BO Design St.
SAP BO AnalysisSAP BEx
SAP BO WebI
SAS
© BARCTHE BI Survey 16
2012 2013 2014 2015 2016
17.
9.10.
1.
15.
6.
14.
8.
16.
3.4.
13.12.
7.
18.
11.
2.
5.
SAP BexSAP BO Analysis
SAP BO Design St.
SAP BO WebI
SAS
Tableau
Tibco
IBM Cognos BI
IBM Cognos TM1Infor
Information Builders
MicroStrategy
MS Excel
MS Power BI
MS SSRS
Oracle BI
Qlik SenseQlikView

Report
This KPI is based on how quickly queries respond (adjusted by data volume).
Query performance

60
Viewpoint
©2016 BARC - Business Application Research Center, a CXP Group CompanyQlik in
QlikView receives good customer feedback across all peer groups for its ability to process queries. The solution typically loads data into its in-memory database, which supports asso-ciative query/analysis logic particularly well. With regularly outstanding results for query performance in the last four years, customers underline QlikView’s ability to query data quickly compared to rival products from other large international BI vendors.
Query performanceConsistently outstanding in query performance
Peer group: large international BI vendors
Query performance – Leader
Query performance – Leader
Query performance – Leader
Peer group: large international BI vendors
Peer group: dashboarding-focused products
Peer group: visual discovery-focused products
7.87.0
6.25.8
4.44.34.3
3.93.73.6
3.33.3
3.02.92.7
2.42.32.2
1.0
Information Builders
MS Power BIIBM Cognos TM1
Qlik Sense
QlikView
MicroStrategy
Tibco
Tableau
Oracle BIPeer Group Average
MS SSRSMS Excel
Infor
IBM Cognos BI
SAP BO Design St.
SAP BO Analysis
SAP BEx
SAP BO WebISAS © BARC
THE BI Survey 16
2013 2014 2015 2016
16.
6.
10.
4.
13.
7.
12.
15.
8.
1.
3.
9.
14.
5.
18.17.
11.
2.
SAP Bex
SAP BO Analysis
SAP BO Design St.
SAP BO WebISAS
Tableau
Tibco
IBM Cognos BI
IBM Cognos TM1
Infor
Information Builders
MicroStrategy
MS Excel
MS Power BI
MS SSRS
Oracle BI
Qlik Sense
QlikView
10.07.17.0
6.24.84.7
4.44.44.34.24.14.1
3.83.33.2
2.5
Dimensional Insight
SisenseYellowfin
MS Power BI
arcplan (Longview)
QlikView
Cyberscience
TibcoPyramid Analytics
Peer Group Average
TableauBOARDDundas
Logi AnalyticsZoho Reports
SAP BO Design St.
© BARCTHE BI Survey 162.3
CXO-Cockpit
7.87.0
6.24.8
4.54.34.24.14.0
3.3
SisenseMS Power BI
Phocas
Qlik Sense
QlikView
Targit
Peer Group Average
Tibco
TableauLogi Analytics
© BARCTHE BI Survey 162.5
Dundas

Report
This KPI is a combination of the ‘Query performance’ and ‘Performance satisfaction’ KPIs.
Performance

62
Viewpoint
©2016 BARC - Business Application Research Center, a CXP Group CompanyQlik in
QlikView ranks highly in all of its peer groups in the combined ‘Performance’ KPI, following up on consistently good rankings over the last four years. Performance is crucial to the ac-ceptance of a solution, especially for business users. Qlik’s in-memory engine is clearly ca-pable of providing a good level of performance to users.
PerformancePerformance – Leader
Peer group: large international BI vendors
Performance – Leader
Peer group: dashboarding-focused products
Performance – Leader
Peer group: visual discovery-focused products
8.78.4
7.57.06.86.86.76.6
6.26.1
SisenseMS Power BI
Phocas
Qlik Sense
QlikView
Targit
Peer Group Average
Tibco
TableauLogi Analytics
© BARCTHE BI Survey 163.9
Dundas
8.78.4
7.57.3
7.06.36.16.1
5.55.15.04.8
4.64.44.3
4.03.53.4
2.3
Information BuildersMS Power BI
IBM Cognos TM1
Qlik Sense
QlikView
MicroStrategy
Tibco
Tableau
Oracle BI
Peer Group Average
MS SSRSMS Excel
Infor
IBM Cognos BI
SAP BO Design St.
SAP BO Analysis
SAP BEx
SAP BO WebISAS
© BARCTHE BI Survey 16
9.18.58.4
7.57.06.86.76.66.66.6
6.16.16.16.05.8
5.1
Dimensional Insight
Sisense
Yellowfin
MS Power BI
arcplan (Longview)
QlikView
Cyberscience
TibcoPyramid Analytics
Peer Group Average
TableauBOARD
Dundas
Logi Analytics
Zoho Reports
SAP BO Design St. © BARCTHE BI Survey 163.9
CXO-Cockpit

63 ©2016 BARC - Business Application Research Center, a CXP Group CompanyQlik in
Performance
Consistently outstanding in performanceConsistently outstanding in performance
Peer group: dashboarding-focused productsPeer group: large international BI vendors
2013 2014 2015 2016
14.13.
7.
11.
1.
8.
16.
5.
2.
4.
15.
6.
12.
3.
9.10.
Logi Analytics
MS Power BI
Pyramid Analytics
Tableau
Tibco
YellowfinZoho Reports
arcplan (Longview)BOARD
CXO-Cockpit
Cyberscience
Dimensional Insight
Dundas
Sisense
SAP BO Design St.
QlikView
2013 2014 2015 2016
17.
7.
14.
4.
10.
5.
11.
13.
6.
1.
3.
18.
12.
9.
16.15.
8.
2.
SAP Bex
SAP BO Analysis
SAP BO Design St.
SAP BO WebISAS
Tableau
Tibco
IBM Cognos BI
IBM Cognos TM1
Infor
Information Builders
MicroStrategy
MS Excel
MS Power BI
MS SSRS
Oracle BI
Qlik Sense
QlikView

Report
This KPI is based on how quickly the product is implemented.
Project length

65
Viewpoint
©2016 BARC - Business Application Research Center, a CXP Group CompanyQlik in
QlikView ranks as one of the leading large in-ternational BI vendors for fast project imple-mentation. The software was built to equip business users with flexible and business user-oriented functionality to fulfill their ana-lysis and visualization needs. To that end, the product provides a flexible script-oriented en-vironment to integrate and model data as well as interactive visualizations to present data to end users. Despite QlikView’s flexibility, the so-lution tends to be used to develop individual applications. Therefore it is quite surprising to see customers claiming to complete their pro-jects faster than customers of other large inter-national BI vendors. These results may indicate that QlikView’s orientation towards business users means that developing applications ta-kes less time than it would with products from other large international BI vendors.
Project length
Improved in project length
Peer group: large international BI vendors
Project length – Leader
Peer group: large international BI vendors
8.17.97.7
7.36.5
5.94.84.74.54.3
3.73.5
2.01.81.61.5
1.01.0
Information Builders
MS Power BI
IBM Cognos TM1
Qlik SenseQlikView
MicroStrategy
Tableau
Oracle BI
Peer Group Average
MS SSRS
MS Excel
IBM Cognos BI
SAP BO Design St.
SAP BO Analysis
SAP BExSAP BO WebI
SAS© BARC
THE BI Survey 16
Tibco
2012 2013 2014 2015 2016
17.
9.
10.
6.
5.
8.
14.
16.
3.
4.
12.
7.
11.
13.
15.
2.
1.
Information Builders
MS Excel
MS Power BI
MS SSRS
MicroStrategy
Oracle BI
Qlik Sense
SAP Bex
SAP BO Analysis
SAP BO Design St.
SAP BO WebI
SAS
IBM Cognos BI
IBM Cognos TM1
Tibco
Tableau
QlikView

Report
This KPI is based on how often the product was chosen for its ease of use, and on the level of com-plaints about ease of use post-implementation.
Ease of use

67
Viewpoint
©2016 BARC - Business Application Research Center, a CXP Group CompanyQlik in
QlikView remains one of the leading providers of easy-to-use solutions compared to other lar-ge international BI vendors, holding on to the leading position it has occupied in this peer group for the last three years. QlikView pro-duces appealing charts and visualizations to navigate through data in an interactive way. Non-technical users can navigate between dashboards by selecting a tab, and explore the data freely using search and selecting valu-es in the display objects. QlikView also has a strong fuzzy search feature. The product has always worked with a “green/white/gray” the-me. Selections are highlighted in green, asso-ciated data is represented in white, and exclu-ded (unassociated) data appears in gray.
Ease of use
Consistently outstanding in ease of use
Peer group: large international BI vendors
Ease of use – Leader
Peer group: large international BI vendors
9.17.2
6.86.6
6.05.9
5.65.35.25.15.15.05.0
4.34.3
4.03.1
1.3
Information Builders
MS Power BI
IBM Cognos TM1
Qlik Sense
QlikView
MicroStrategy
Tableau
Oracle BI
Peer Group Average
MS SSRS
MS Excel
IBM Cognos BI
SAP BO Design St.
SAP BO Analysis
SAP BEx
SAP BO WebI
SAS © BARCTHE BI Survey 16
Tibco
1.0
Infor
2014 2015 2016
16.15.
13.
9.
5.
3.
8.
12.
14.
2.
4.
18.
6.
10.11.
17.
1.
7.
SAP Bex
SAP BO Analysis
SAP BO Design St.SAP BO WebI
SAS
Tableau
Tibco
IBM Cognos BIIBM Cognos TM1
Infor
Information Builders
MicroStrategy
MS Excel
MS Power BI
MS SSRS
Oracle BI
Qlik Sense
QlikView

Report
The business value KPI combines the ‘Business benefits’, ‘Project success’, ‘Price-to-value percepti-on’, ‘Project length’ and ‘Innovation‘ KPIs.
The flexibility for users KPI is based on how often the product was chosen for its flexibility, and on the frequency of complaints about user flexibility post-implementation.
Business value & flexibility for users

69 ©2016 BARC - Business Application Research Center, a CXP Group CompanyQlik in
QlikView receives positive user feedback for its flexibility. In fact, flexibility is the cornerstone of the whole solution. Firstly the product’s data integrati-on, transformation and modeling is done via SQL-oriented scripting langu-age, so business users familiar with SQL have the flexibility to model their own data. In terms of visualization, QlikView provides extensive options for creating and customizing charts. Finally the product has a wide range of functions for creating guided navigation paths within a dashboard or appli-cation. Tabs, buttons, actions and other features can be used to provide end users with the data they need and guide them through their dashboards.
Viewpoint
Qlik is rated as one of the leading large international BI vendors in provi-ding high business value to its customers. This KPI combines user feedback on ‘Business benefits’, ‘Project success’, ‘Price-to-value perception’, ‘Project length’ and ‘Innovation‘. Qlik supports decision-makers across customer or-ganizations with its easy-to-use, flexible solution. It can be used to create individual applications as well as to visualize data and find insights in it.
Viewpoint
Flexibility for usersBusiness value
Business value – Leader
Peer group: large international BI vendors
8.07.87.8
6.96.96.8
6.35.45.35.25.15.1
4.44.03.8
2.92.5
1.9
Information BuildersMS Power BI
IBM Cognos TM1
Qlik Sense
QlikView
MicroStrategy
Tableau
Oracle BI
Peer Group Average
MS SSRSMS Excel
IBM Cognos BI
SAP BO Design St.SAP BO Analysis
SAP BEx
SAP BO WebISAS
© BARCTHE BI Survey 16
Tibco
1.8
Infor
Flexibility for users – Leader
Peer group: large international BI vendors
7.77.0
6.05.85.8
5.04.8
4.64.5
4.13.93.7
3.52.6
2.12.01.81.6
Information Builders
MS Power BI
IBM Cognos TM1
Qlik SenseQlikView
MicroStrategy
Tableau
Oracle BI
Peer Group Average
MS SSRS
MS Excel
IBM Cognos BI
SAP BO Design St.
SAP BO Analysis
SAP BEx
SAP BO WebI
SAS
© BARCTHE BI Survey 16
Tibco
1.0
Infor

70
BARC is a leading enterprise software industry analyst and consulting firm delivering informa-tion to more than 1,000 customers each year. Major companies, government agencies and fi-nancial institutions rely on BARC’s expertise in software selection, consulting and IT strategy projects.
For over twenty years, BARC has specialized in core research areas including Data Manage-ment (DM), Business Intelligence (BI), Customer Relationship Management (CRM) and Enterprise Content Management (ECM).
BARC’s expertise is underpinned by a conti-nuous program of market research, analysis and a series of product comparison studies to main-tain a detailed and up-to-date understanding of the most important software vendors and pro-ducts, as well as the latest market trends and developments.
BARC research focuses on helping companies find the right software solutions to align with their business goals. It includes evaluations of the leading vendors and products using metho-dologies that enable our clients to easily draw comparisons and reach a software selection decision with confidence. BARC also publishes insights into market trends and developments, and dispenses proven best practice advice.
BARC consulting can help you find the most re-liable and cost effective products to meet your specific requirements, guaranteeing a fast return on your investment. Neutrality and competency are the two cornerstones of BARC’s approach to consulting. BARC also offers technical archi-tecture reviews and coaching and advice on developing a software strategy for your organi-zation, as well as helping software vendors with their product and market strategy.
BARC organizes regular conferences and semi-nars on Business Intelligence, Enterprise Con-tent Management and Customer Relationship Management software. Vendors and IT decisi-on-makers meet to discuss the latest product updates and market trends, and take advantage of valuable networking opportunities.
Along with CXP and Pierre Audoin Consultants (PAC), BARC forms part of the CXP Group – the leading European IT research and consulting firm with 140 staff in eight countries including the UK, France, Germany, Austria and Switzerland. CXP and PAC complement BARC’s expertise in software markets with their extensive knowled-ge of technology for IT Service Management, HR and ERP.
BARC — Business Application Research Center A CXP Group Company
BARC research reports bring transparency to the market
Other Surveys
The Planning Survey 16 is the world’s largest survey of planning software users. Based on a sample of over 1,200 responses, it offers an unsurpassed level of user feedback on 13 leading planning products.
The BARC Big Data Use Cases Survey explores the usage of big data in companies worldwide. 559 business and IT decision-makers completed the survey in the first quarter of 2015.
ISO
LOG
TBTB
TB
LOG
BARC Research Study
BI Trend Monitor 2016The world‘s largest survey on BI trends
©2016 BARC - Business Application Research Center, a CXP Group CompanyQlik in
The BI Trend Monitor 2016 from BARC reflects on the trends cur-rently driving the BI and data ma-nagement market from a users’ per-spective. We asked close to 2,800 users, consultants and vendors for their views on the most important BI trends.

Business Application Research Center – BARC GmbH
GermanyBARC GmbH
Berliner Platz 7D-97080 Würzburg
+49 (0) 931 880651-0www.barc.de
AustriaBARC GmbH
Goldschlagstraße 172 / Stiege 4 / 2.OGA-1140 Wien
+43 (1) 8901203-451www.barc.de
SwitzerlandBARC Schweiz GmbHBuchhaldenstraße 7CH-5442 Fislisbach+41 (0) 763403516
www.barc.de
Rest of the World +44 1536 772 451
www.barc-research.com