travelport investment overview february...
TRANSCRIPT

Travelport Investment OverviewFebruary 2012
This presentation, furnished on a confidential basis to the recipient, does not constitute an offer of any securities or investment advisoryservices. It is intended exclusively for the use of the person to whom it has been delivered by Wolf Capital Management LLC, and it is notto be reproduced or redistributed to any other person without the prior consent of Wolf Capital Management LLC.

Company Overview
2Confidential
Joshua Nahas 2009-2016 - for Personal Use Only, Not for Duplication

History As part of Cendant’s starburst transaction in 2006, Travelport was taken private by Blackstone
and Technology Crossover Ventures in June 2006. In December of 2006, Travelport announced its acquisition of a competitor GDS, Worldspan, which it completed in August of 2007. The acquisition was financed by $1,040mm of new debt and $250mm of PIK loans previously made by Travelport to Worldspan in December.
In March of 2007, Travelport announced the spin-off of 52% of Orbitz, its captive online travel agency (OTA), which it completed in July of 2007. Also in March of 2007, Travelport completed a $1.1bn dividend recapitalization with a HoldCo PIK loan. Pro forma for all three transactions, Travelport guided the market to believe that its leverage would be ~5.0x, assuming LTM adjusted EBITDA of $1,036mm.
In January of 2010, Travelport announced a cash tender offer for its notes with the intention of going public but withdrew the IPO the following month. In March of 2011, Travelport sold its GTA business for $720mm, using the proceeds to pay down bank debt.
3Confidential
Joshua Nahas 2009-2016 - for Personal Use Only, Not for Duplication

History
4Confidential
Joshua Nahas 2009-2016 - for Personal Use Only, Not for Duplication

Industry Overview
5
Travelers book 1/3 of tickets directly with the carrier. The remaining 2/3 is booked via a third party – offline or online travel agencies
Global Distribution Systems (GDS) as well as travel agencies charge distribution fees to the carrier, which on a combined basis are typically $10-$15 per round trip
Airline Tariff Publishing Company (ATPCO) provides air data to GDSs from carriers representing 97% of air traffic
Global Distribution Systems (GDS) are intermediaries acting as a single point of contact for schedule and fare data to offline agencies and OTAs to search and process transactions
Offline Agencies and Online Travel Agencies (OTAs) are booking portals for travelers, often times combining air travel with hotel, car rental, cruise, and other products

Industry Overview – Competitive Landscape The four largest global GDS providers are Galileo, Worldspan, Amadeus, and Sabre. Both Galileo
and Worldspan are part of Travelport, comprising 28% of the global air segment market share, down from 33% in 2007.
This shrinking footprint was mainly driven by Expedia ending its business with Worldspan in 2007 and the Company’s decision to trade reduced market share for increased margins in the Middle East and Africa.
Geographically, the Company’s share of the GDS-processed air segment business was 46%, 25%, 11% and 18% in the Americas, Europe, MEA and Asia Pacific, respectively, for 2010. In contrast to Travelport’s more diversified market shares, its major competitors are more concentrated in the markets of their respective founder airlines.
In 2010, Amadeus’s GDS-processed air segment business accounted for approximately 80% share in European nations, including Germany, France Spain, Denmark, Norway and Sweden. In the same period, Sabre accounted for roughly 60% of the share in the U.S. The Asian GDS market is more fragmented and is mainly captured by regional players. Abacus, the largest GDS in the Asian region, is primarily owned by a group of ten Asian airlines.
6Confidential
Joshua Nahas 2009-2016 - for Personal Use Only, Not for Duplication

Industry Overview – Competitive Landscape In addition to direct competition from other GDS providers, airlines are starting their own direct
connect systems to take control over pricing, customer value and marketing efforts on an individual transaction basis.
American Airline provides a good example of the practice when it tried to disrupt the money flow that has existed for years in the GDS industry by offering services directly to travel agents. American sued Travelport and Sabre for monopolizing the distribution of airfare and related flight information to travel agencies.
The court dismissed American Airline’s primary claims, including the claim where the airline said that Sabre “unreasonably” restrained competition. American also alleged that Travelport “effectively controls the distribution of airline tickets to a large portion of business travelers” while Orbitz benefits from it.
Moreover, American did the unthinkable by completely pulling its fares from Orbitz in December 2010. The action was later reversed by an Illinois Court. The carrier represented approximately 5% of Orbitz’s revenue.
7Confidential
Joshua Nahas 2009-2016 - for Personal Use Only, Not for Duplication

Industry Overview – Top Airlines by # of Passengers
8Confidential
Source: Barclays Capital
Joshua Nahas 2009-2016 - for Personal Use Only, Not for Duplication

Business Overview The Company’s Apollo, Worldspan, and Galileo brands made up approximately 28% of the global
GDS air segment market in 2010. Of the $1.8bn in transaction-processing revenue (excluding Airline IT
Solutions revenue) generated from GDSs in 2010, approximately $1.5bn (83%) was from airlines, $108mm (6%) from hotels, $74mm (4%) from car rentals, and the remaining from rail, cruise and other travel related services.
From the fee that Travelport receives from travel suppliers for each segment booked, cancelled or changed, the Company pays commissions or other financial incentives to travel agencies to encourage greater use of its GDS. The travel agencies then distribute the travel inventory to end customers.
The Company’s top 15 travel suppliers (all airlines) represented approximately 42% of 2010’s transaction-processing revenue. American Airlines and US Airways, the top two suppliers, represented about 8% of Travelport’s transaction-processing revenue in 2010.
Approximately 77% of Travelport’s air segment revenue was derived from full-content agreement contracts where airlines allow full access to their public content and parity in functionality, including the ability to book the last available seat.
These agreements typically range from three to seven years. The Company is in these full-content agreements with 95 airlines worldwide, including all major US airlines, as well as leading global airlines such as British Airways, Air France, KLM, Iberia, Lufthansa Swiss Air, Alitalia, Qantas and Singapore Airlines.
The Company also has 50 low cost carriers (LCCs) participating in its GDSs, with the top 10 carriers accounting for 4% of its air segment transaction processing revenue. The segment volume growth from LCCs was 20% in 2010 versus only 2% for traditional carriers
9Confidential
Joshua Nahas 2009-2016 - for Personal Use Only, Not for Duplication

Business Overview – Customer Breakout
10Confidential
Source: Barclays Capital
Joshua Nahas 2009-2016 - for Personal Use Only, Not for Duplication

Business Overview – Revenue Trends
11Confidential
Source: Barclays Capital
Joshua Nahas 2009-2016 - for Personal Use Only, Not for Duplication

2011 Credit Agreement Amendment The company received 99.3% consent from term loan lenders to amend its credit agreement.
Lenders received a 4pt amendment fee in connection with the amendment. The company obtained additional covenant headroom under its total leverage covenant, and a
new first-lien gross leverage maintenance covenant and $75mn minimum liquidity covenant (defined largely as unrestricted cash) was added.
The company is also required to repurchase $20mn of 2014 or 2016 maturity senior notes over each 12-month period (first 12-month period ending September 30, 2012, and the second 12-month period ending September 30, 2013) from persons other than 5% shareholders, provided the company does not breach the minimum liquidity covenant.
The $270mn revolver commitment was reduced by 33% (to $181mn), with $118mn extended to August 2013 at L+450, with a 300bp commitment fee, and the $63mn unextended revolver (L+275) maturing August 2012
As part of the amendment, LTM covenant EBITDA is adjusted for the loss of the UAL contract (currently expected to roll off at the end of 1Q12) as follows: $60mn deduction for each fiscal quarter ending on or prior to March 31, 2012 $45mn deduction for the June 30, 2012, quarter $30mn deduction for the September 30, 2012, quarter $15mn deduction for the December 31, 2012, quarter and $0mn for subsequent quarters
12Confidential
Joshua Nahas 2009-2016 - for Personal Use Only, Not for Duplication

2011 Restructuring Transaction In September of 2011, Travelport announced the restructuring of $715mm of HoldCo PIK term
loans. The holders of the loans were offered: a) $89.5mm in cash (via a restricted payment); b) a par exchange of $207.5mm of OpCo second lien term loans due December 2016 (via a restricted payment); c) an extension of remaining PIK loans in two tranches: $287.5mm extended to December 2016 and $135mm extended to September 2012; and d) 40% equity in HoldCo.
Furthermore, if HoldCo is unable to repay the $135mm term loan due September 2012, the HoldCo term loans will be replaced by a second lien OpCo term loan of $135mm. Notably, in the event the HoldCo loan is converted into an OpCo loan, the HoldCo loan will become Tranche A term loan, while the $207.5mm term loan created by the prior exchange will become a tranche B term loan
13Confidential
Joshua Nahas 2009-2016 - for Personal Use Only, Not for Duplication

1st Lien Term Loan Trading History (Since Refinanced)
14Confidential
Joshua Nahas 2009-2016 - for Personal Use Only, Not for Duplication

Benchmark 9.875% Sr Unsecured Note Trading History
15ConfidentialSource: Barclays
Joshua Nahas 2009-2016 - for Personal Use Only, Not for Duplication

Capital Structure
16Confidential
Amount Yield Option Leverage Leverage Capital Structure as of Sept 30, 2012 Maturity Rate Outstanding Price To Worst Adjusted Spread Face Market
RC 35.0Capital lease 56.0Extended TL USD (No flr) Aug 2015 L+450 1,064.0 93.3 6.65% 705.00 3.6x 3.2xExtended TL EUR (No flr) Aug 2015 E+450 277.0 92.0 6.65% 755.00 3.6x 3.2xTranche S (No flr) Aug 2015 L+450 137.0 NA 3.6x 3.2x1.5 Lien Term Loan (1.5% flr) Nov 2015 L+950 170.0 101.5 10.44% 999.00 4.0x 4.0x2nd Lien PIK Toggle (No flr) (1) Dec 2016 L+600 221.0 75.0 13.51% 4.5x 4.3x
Total secured debt 1,960.0US$ FRN Sep 2014 L+462.5 122.0 74.0 19.37% 2,277.00 6.7x 6.2xEuro FRN Sep 2014 E+462.5 196.0 74.0 20.44% 2,432.00 6.7x 6.2x9.875% Senior Notes Sep 2014 429.0 80.0 23.23% 2,280.00 6.7x 6.2x9% Senior Notes Mar 2016 250.0 70.0 20.56% 2,005.00 6.7x 6.2x
Total senior unsecured debt (2) 997.011.875% US$ Sr Subordinated Notes Sep-16 247.0 38.5 47.79% 4,722.00 7.7x 7.1x10.875% Euro Sr Subordinated Notes Sep-16 180.0 34.5 50.54% 4,993.00 7.7x 7.1x
Total senior subordinated notes 427.0Total OpCo debt outstanding 3,384.0
Cash held as collateral 137.0Cash on BS 125.0
Net OpCo debt 3,122.0LTM Adj EBITDA $480.0LTM Covenant EBITDA $440.0
Note:(1) Additional $135mm From HoldCo conversion if Unsecureds are unsucessful in litigation attempting to block issuance.(2) As per 2011 Restructuring agreement, must repurchase $20mm of unsecured debt per year.
Joshua Nahas 2009-2016 - for Personal Use Only, Not for Duplication

Issuer and Guarantor Entities
17Confidential
Joshua Nahas 2009-2016 - for Personal Use Only, Not for Duplication

Debt Maturity Profile
18Confidential

Situation Overview GDS’s are facing secular pressure from reduced travel as the result of higher fuel prices as well as
increasing competition and disintermediation from other platforms. Airline consolidation has decreased number of customers, thereby decreasing available segments
and shifting leverage in pricing discussions toward the airlines Intense pressure from US airlines to decrease GDS booking fee Lack of differentiation in the core GDS business has caused incentive fees to increase year
after year Competitor Amadeus has outperformed Travelport in the high-value international
geographies, and based on differences in capital expenditures, Travelport is not likely to take share from Amadeus in the next few years
Significant operating leverage caused by slight changes in booking fees magnifies the downside risk presented by the trends above
Blackstone recouped its equity investment through a dividend recapitalization and now likely views the company as an option to upside Blackstone has demonstrated this option viewpoint by under-spending on capital
expenditures Blackstone will attempt to remove as much capital as possible from the company before it
files
19Confidential
Joshua Nahas 2009-2016 - for Personal Use Only, Not for Duplication

Restructuring Scenarios Historic public comparables have traded in a range of 5.0x – 9.0x FV / NTM EBITDA with an
average of ~7.0x Floor valuation of 6.0x FV / NTM EBITDA with projected valuation in bankruptcy ranging from
5.5x – 6.5x FV / NTM EBITDA Three likely catalysts between now and 2015:
Maturity of non-extended term loan in August of 2013 Springing Maturity of Extended TL May 2014 Maturity of senior subordinated notes in August of 2014 Maturity of extended term loan in August of 2015
Travelport strategy will likely be to launch a distressed exchange for the 2014 notes in January of 2014. The goal would be to discharge principal as well as push out maturities Significant holdouts likely make difficult to complete. If they see themselves as fulcrum may
push for equitization Company could pay another extension fee to TL and push maturity out to August buying
option value and time to negotiate a pre-arranged bankruptcy or out-of-court restructuring
20Confidential
Joshua Nahas 2009-2016 - for Personal Use Only, Not for Duplication

Investment Opportunity The first lien TL due 2013 and the extended TL due 2015 trade at an 11% YTW and a 14% YT
Springing Maturity and are priced at 86/85 respectively with L+250/450 coupons. Leverage is 3x at market and 3.4x face
At 3x leverage there is significant Enterprise Value cushion beneath the 1st lien debt with comps trade in the 7-8x range implying $1.5bn of cushion. Given the overcollateralization and over $1bn dollars of junior debt that would likely push to cram up the 1st liens, they represent an attractive opportunity at current levels Potential to receive bump in coupon, consent, amendment fees if there is a covenant trip
The Second Lien TL at L+600 due 2016 and trading at 73 appears to offer attractive an opportunity as a secured piece of paper that makes a good case to be the fulcrum security. However, given the small size of the issue ($200mm) and lack of liquidity hard to be fulcrum from that position. Also, risk of cramdown since it is a small issue would need to come up with large investment relative to position size to delver the firsts (150% of face) Moreover, an additional $135mm of 2nd lien capacity remains and expect it to be issued in
September of 2012 if the HoldCo Tranche B TL is not repaid. This represents dilution of 65% to the existing 2nd liens. However much of that is priced in with seconds in the 70s, 100% covered in all my restructuring scenarios.
The 2nd liens represent an opportunity if one is looking to create equity value, but is willing to be crammed up
There are ≈ $1bn in senior unsecured bonds coming due in September 2014. If they are not refinanced prior to the springing maturity, which seems unlikely. Travelport will need to file for Ch 11. While they have a good case for the fulcrum security, they will likely need to inject additional cash through a rights offering into the structure
21Confidential
Joshua Nahas 2009-2016 - for Personal Use Only, Not for Duplication

Potential Return Scenarios on 1st Lien Extended TL
22Confidential
Joshua Nahas 2009-2016 - for Personal Use Only, Not for Duplication

Secured Credit Facility - Summary of Amended Terms
23Confidential
Permitted the issuance of the second lien term loans. Added a minimum $70mm liquidity covenant Increased the restricted payment baskets Limits the general basket for investments to $20mm Required TPORT to purchase $20mm of its senior notes under certain conditions for each of the next
two years, Amended TPORT’s total leverage ratio to initially set at 8.0x until June 13, 2013, and Added a 1st Lien (Senior Secured) leverage test to initially set at 4.0x until June 13, 2013.
Joshua Nahas 2009-2016 - for Personal Use Only, Not for Duplication

Revolving Credit Agreement Description
24Confidential
As of September 30, 2011 the Company had a $270mm revolving credit facility without borrowings and letters of credit drawn against. On October 6, 2011 the Company reduced the facility size to $181mm and amended certain terms of the agreement, including i) extending of the maturity on $118mm of the commitment to August 23, 2013; ii) raising the interest rate on the extended loan from LIBOR plus 2.75% to LIBOR plus 4.5%; and iii) increasing the commitment fee on the extended portion from 50bps to 300bps.
The Company has a separate $133mm letter of credit facility collateralized by the $137mm restricted cash mentioned above and a $13mm synthetic letter of credit facility of which $75mm is related to Orbitz Worldwide. As of September 30, 2011 Travelport had approximately $99mm and $10mm outstanding under the respective letters of credit facility
Joshua Nahas 2009-2016 - for Personal Use Only, Not for Duplication

Secured Credit Facility
25Confidential
The Company has a total of five term loan facilities denominated in dollars and euros with maturities in August 2013 and 2015. In October 2010, Travelport entered into the Fourth Amended and Restated Credit Agreement which impacted 90% of its outstanding term loans.
The amendment i) extended the maturity on $1.523bn of dollar denominated term loans, $427mm of euro denominated term loans and $137mm of the synthetic letters of credit by two years to August 2015; ii) established a new $137mm dollar denominated “Tranche S” term loan funded through a restricted deposit account to provide cash collateral for existing and future letters of credit; iii) created an option to extend the maturity on the revolving credit facility at a later date; and iv) provided the ability to incur additional junior refinancing debt.
The amendment increased the interest margin on the extended dollar and euro denominated term loans from 2.5% to 4.5%. The interest on the non-extended dollar and euro term loans remained at 2.5%.
On September 30, 2011 the Company further amended its credit agreement to i) allow the issuance of new second lien term loans; ii) amend the total leverage ratio to 8.0x through June 30, 2013, then 7.75x through December 31, 2013, then 7.50x through December 31, 2014 and 7.25x through maturity of the extended term loans; iii) add a first lien leverage ratio covenant test of 4.0x through June 30, 2013, then 3.85x through December 31, 2013, then 3.7x through December 31, 2014 and 3.5x through the maturity of the extended term loans; iv) add a covenant requiring minimum unrestricted cash of $75mm to be effective under certain conditions at the end of each fiscal quarter; v) increase the restricted payment capacity to $297mm; vi) limit the general basket for investments to $20mm; vii) require the repurchase of $20mm of its senior notes for each of the next two years; and viii) amend the total leverage ratio to 8.0x until June 30, 2013 and add a first lien leverage ratio test of 4.0x until June 30, 2013
Joshua Nahas 2009-2016 - for Personal Use Only, Not for Duplication
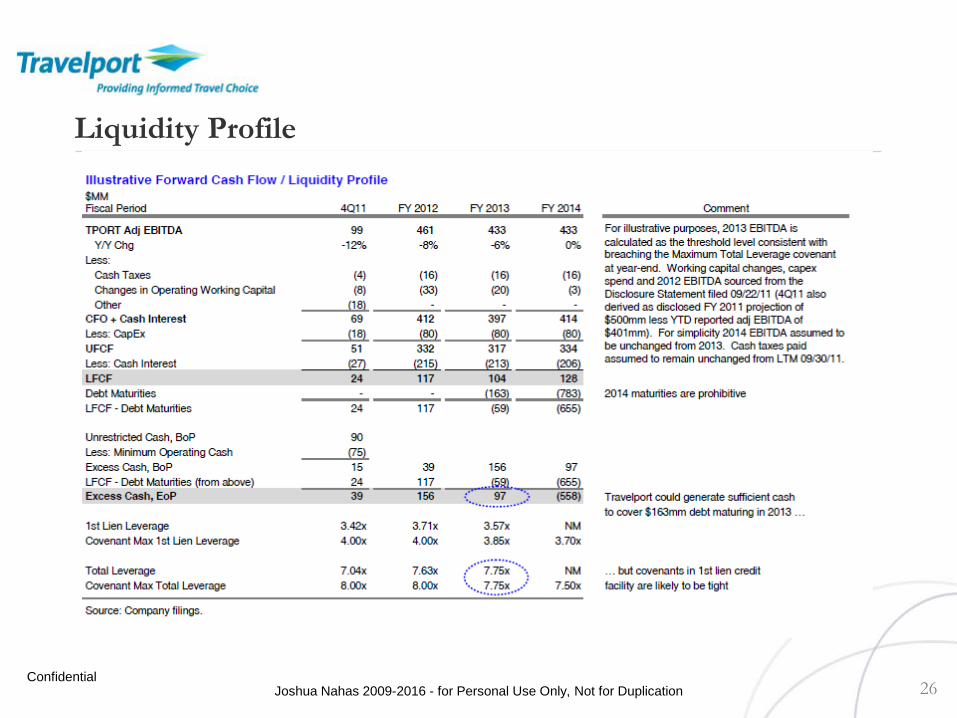
Liquidity Profile
26Confidential
Joshua Nahas 2009-2016 - for Personal Use Only, Not for Duplication

Recovery
27Confidential
Assumptions based on the mid-point of assumed BK valuation
In the event of a restructuring significant equity value could be unlocked by equitizing the 2nd lien TL which in the high case would be >2x return
Risks in a restructuring are a economic downturn that values EV at trough EBITDA and trough multiple. This would then require a substantial equity commitment to prevent a cramdown for the Seniors
The Subnotes will likely have no recovery in the event of a restructuring as they will not be able to reinstate both securd debt and refinance the seniors note snd should be valued based on how many coupons one expects to receive plus option value
2014 Midpoint Estimate2014E
Revenue 2,109.5COGS (1,250.6)SG&A (409.3)EBITDA 449.7
Margin % 21.3%
RecoveryEBITDA 449.7 449.7 449.7 449.7 449.7
Multiple 6.0x 6.5x 7.0x 7.5x 8.0xEV 2,697.9 2,922.8 3,147.6 3,372.4 3,597.3DIP 100.0 100.0 100.0 100.0 100.0Estate Fees 100.0 100.0 100.0 100.0 100.0+Cash Build 200.0 200.0 200.0 200.0 200.0Distributable Value 2,697.9 2,922.8 3,147.6 3,372.4 3,597.31st Lien Debt 1,611.9 1,611.9 1,611.9 1,611.9 1,611.9
Recovery 100.0% 100.0% 100.0% 100.0% 100.0%Distributable Value 1,086.0 1,310.8 1,535.7 1,760.5 1,985.32nd Lien Debt 342.0 342.0 342.0 342.0 342.0
Recovery 100.0% 100.0% 100.0% 100.0% 100.0%Distributable Value 744.0 968.8 1,193.7 1,418.5 1,643.3Senior Notes 997.0 997.0 997.0 997.0 997.0
Recovery 74.6% 97.2% 100.0% 100.0% 100.0%Distributable Value (253.0) (28.2) 196.7 421.5 646.3Sub Notes 434.0 434.0 434.0 434.0 434.0
Recovery 0.0% 0.0% 45.3% 97.1% 148.9%HoldCo PIK TLB 288.0 288.0 288.0 288.0 288.0
Recovery 0.0% 0.0% 0.0% 0.0% 0.0%
Joshua Nahas 2009-2016 - for Personal Use Only, Not for Duplication

Recovery Sensitivity – First Liens
28Confidential
Joshua Nahas 2009-2016 - for Personal Use Only, Not for Duplication

Valuation
29Confidential
Company Disclosed Liquidation Analysis September 2011
Joshua Nahas 2009-2016 - for Personal Use Only, Not for Duplication

Restructuring Scenario - Senior Notes Fulcrum
30Confidential
Post-Reorg Assumptions Plan EBITDA 425.0
Multiple 6.5xPlan Strike $2,762.5Max 1st Lien Levarge 3.5xMax Total Leverage 4.5xMin Interest Coverage 2.0xSenior Notes Rights Offering 250.0Senior Note Plan Recovery Incl Cost of Rights 68.2%Post-Reorg Capital StrucutreNew First Lien TL L+550 1.5% Floor 1,487.5New 9.5% HY Bond 425.0Implied Equity Value 850.0
Sources and UsesSoruces:New TL 1,487.5New HY Bond 425.0Cash Build in BK 133.2Rights Offering 250.0 Total Sources 2,295.7
Uses: 0.000DIP 100.0Administraitive Expenses 75.0Exisiting First Lien Debt 1,511.02nd Lien Debt 342.0Cash Balance Post Exit 219.2Exit Financing Fees and Expenses 48.5 Total Uses 2,295.7
Pro Forma Credit Stats1st Lien Leverage 3.1xTotal leverage 4.1xInterest Coverage 3.1xEBITDA-Capex/Interest 2.4x

Post-Reorg Financials
31Confidential
Restrucuted Financial Projections2013PF 2014PF 2015PF 2016PF 2017PF
Revenue 2,068.0 2,109.5 2,151.9 2,195.2 2,239.3Growth - 2.0% 2.0% 2.0% 2.0%
COGS 1,236.1 1,250.6 1,275.8 1,301.4 1,327.6Gross Profit 831.9 858.9 876.2 893.8 911.7
Margin % 40.2% 40.7% 40.7% 40.7% 40.7%SG&A 401.2 409.3 417.5 425.9 434.4
% of Revenue 19.4% 19.4% 19.4% 19.4% 19.4%EBITDA 430.7 449.7 458.7 467.9 477.3
Margin % 20.8% 21.3% 21.3% 21.3% 21.3%Interest 139.6 129.3 118.1 106.0 92.9Taxes 20.0 25.0 25.0 25.0 25.0D&A 240.0 245.0 250.0 260.0 265.0
EBIT 31.1 50.3 65.6 76.9 94.3Margin % 1.5% 2.4% 3.0% 3.5% 4.2%
EBTIDA 430.7 449.7 458.7 467.9 477.3-Interest (139.6) (129.3) (118.1) (106.0) (92.9)-Taxes (20.0) (25.0) (25.0) (25.0) (25.0)-WC (25.0) (25.0) (25.0) (25.0) (25.0)-Capex (100.0) (100.0) (100.0) (100.0) (100.0)
Free Cash Flow 146.1 170.3 190.6 211.9 234.3
Joshua Nahas 2009-2016 - for Personal Use Only, Not for Duplication

Post-Reorg Debt Schedule
32Confidential
Debt ScheduleExit TL 1,487.5 1,348.2 1,193.5 1,026.7 847.2
Mandatory Amort (29.8) (27.0) (23.9) (20.5) (16.9)75% FCF Sweep (109.6) (127.7) (143.0) (158.9) (175.8)
Ending Balance 1,348.2 1,193.5 1,026.7 847.2 654.5Interest 99.2 89.0 77.7 65.6 52.69.5% HY Bond 425.0 425.0 425.0 425.0 425.0Interest 40.4 40.4 40.4 40.4 40.4Total Interest 139.6 129.3 118.1 106.0 92.9Ending Cash 36.5 42.6 47.7 53.0 58.6Net Debt 1,736.7 1,575.9 1,404.0 1,219.2 1,020.9Net Debt /EBITDA 4.0x 3.5x 3.1x 2.6x 2.1xEBITDA/Interest 3.1x 3.5x 3.9x 4.4x 5.1xEBITDA-Capex/Interest 2.4x 2.7x 3.0x 3.5x 4.1x
Joshua Nahas 2009-2016 - for Personal Use Only, Not for Duplication

Post-Reorg Valuation Sensitivity
33Confidential
Pro Forma ValuationEV/EBITDA Multiple Enterprise Value
2013PF 2014PF 2015PF 2016PF 2017PF
5.5x 2,368.9 2,473.1 2,522.8 2,573.4 2,625.16.0x 2,584.2 2,697.9 2,752.1 2,807.3 2,863.76.5x 2,799.6 2,922.8 2,981.4 3,041.3 3,102.37.0x 3,015.0 3,147.6 3,210.8 3,275.2 3,341.07.5x 3,230.3 3,372.4 3,440.1 3,509.2 3,579.6
Less Net Debt (1,736.7) (1,575.9) (1,404.0) (1,219.2) (1,020.9)
Implied Equity Value5.5x 632.2 897.2 1,118.8 1,354.2 1,604.26.0x 847.6 1,122.0 1,348.1 1,588.1 1,842.86.5x 1,062.9 1,346.9 1,577.4 1,822.1 2,081.57.0x 1,278.3 1,571.7 1,806.8 2,056.0 2,320.17.5x 1,493.6 1,796.5 2,036.1 2,290.0 2,558.7
Joshua Nahas 2009-2016 - for Personal Use Only, Not for Duplication

Post-Reorg Returns Sensitivity
34Confidential
Return MatrixPurchase Price @75 Including Rights
997.8 1 2 3 4 5Pre-tax IRR 2013PF 2014PF 2015PF 2016PF 2017PF
5.5x -36.6% -5.2% 3.9% 7.9% 10.0%6.0x -15.1% 6.0% 10.6% 12.3% 13.1%6.5x 6.5% 16.2% 16.5% 16.2% 15.8%7.0x 28.1% 25.5% 21.9% 19.8% 18.4%7.5x 49.7% 34.2% 26.8% 23.1% 20.7%
Multiple of Invested Capital5.5x 0.63x 0.90x 1.12x 1.36x 1.61x6.0x 0.85x 1.12x 1.35x 1.59x 1.85x6.5x 1.07x 1.35x 1.58x 1.83x 2.09x7.0x 1.28x 1.58x 1.81x 2.06x 2.33x7.5x 1.50x 1.80x 2.04x 2.30x 2.56x
Joshua Nahas 2009-2016 - for Personal Use Only, Not for Duplication

Financial Forecast - RW Pressprich
35Confidential
Source: RW Pressprich
Joshua Nahas 2009-2016 - for Personal Use Only, Not for Duplication

Financial Forecast - POR
36Confidential
Source: POR
Joshua Nahas 2009-2016 - for Personal Use Only, Not for Duplication

HY Comps
37Confidential
Source: Barclays Capital
Joshua Nahas 2009-2016 - for Personal Use Only, Not for Duplication

HY Comps
38Confidential
Source: Wells Fargo
Joshua Nahas 2009-2016 - for Personal Use Only, Not for Duplication