co2 emission statistics for the world commercial fleetmartrans.org/docs/publ/refereed...
TRANSCRIPT
WMU Journal of Maritime Affairs, (2009)
© World Maritime University. All rights reserved. ISSN: 1651-436X print/1654-1642 online
CO2 Emission Statistics for the World Commercial Fleet*
Harilaos N. Psaraftis† and Christos A. Kontovas
* To appear in WMU Journal of Maritime Affairs, 2009. † Professor, Laboratory for Maritime Transport, School of Naval Architecture and Marine Engineering, National Technical University of Athens, Iroon Polytechniou 9, Zografou 15773, Greece, email: [email protected]
Laboratory for Maritime Transport, National Technical University of Athens, Greece
Abstract
The purpose of this paper is to present an analysis of carbon dioxide (CO2) emissions of the world commercial fleet. The analysis is based on the Lloyds-Fairplay world ship database for 2007 and produces various emissions statistics of the following major ship types: bulk carriers, crude oil tankers, container vessels, product/chemical carriers, LNG carriers, LPG carriers, reefer vessels, Ro-Ro vessels and general cargo ships. A separate analysis is carried out for small vessels under 400 GRT and for passenger vessels. The main outputs from this analysis for each ship type-size bracket are the emitted grams of CO2 per tonne-km and an estimate of the total CO2 produced in a year. The methodology for estimating these statistics is described, and a comparison with other studies is made.
Key words: Ship CO2 emissions, Ship air pollution, Modelling of ship fuel consumption and emissions, Greenhouse gases and shipping.
1 Introduction
Carbon dioxide (CO2) emissions from commercial shipping are currently unregulated. Nevertheless, they are a subject of intense scrutiny by the world shipping community. According to the Kyoto protocol to the United Nations Framework Convention on Climate Change -UNFCCC (1997), definite measures to reduce CO2 emissions are necessary in order to curb the projected growth of greenhouse gases (GHG) worldwide. Shipping has thus far escaped being included in the Kyoto global emissions reduction target for CO2 and other GHG, but it is clear that the time of non-regulation is rapidly approaching its end, and measures to curb future CO2 growth are being sought with a high sense of urgency. CO2 is the most prevalent of these GHGs, and it is therefore clear that any set of measures to reduce the latter should primarily focus on CO2.. In parallel, the broader analysis of other greenhouse gases (such as CH4 and N2O) and other, non-greenhouse gases, such as SO2, NOx and others is already very high on the International Maritime Organization’s (IMO) agenda. Various analyses of many aspects of the problem have been and are being carried out and a spectrum of measures are being contemplated. It is clear that a reliable emissions inventory is essential for both scientists and policy-makers in order to formulate and evaluate the implementation of relevant regulations.
To contribute to this debate and possibly complement other studies on the subject, the authors of this paper have conducted their own analysis on emissions of the world fleet database (as provided by Lloyds Fairplay for year 2007) and can herein present some preliminary results of the emissions statistics of the following major ship types: bulk carriers, crude oil tankers, container vessels, product/chemical carriers, LNG carriers, LPG carriers, reefer vessels, Ro-Ro vessels and general cargo ships. A separate analysis was carried out for small vessels under 400 GRT and for passenger
Psaraftis and Kontovas 2
vessels. The study was conducted by the National Technical University of Athens (Laboratory for Maritime Transport) for the Hellenic Chamber of Shipping (HCS).
The study had the following original objectives: (a) develop a web-based tool for calculating the exhaust gas emissions (CO2, SO2 and NOx) of specific types of ships under a variety of operational scenarios, and (b) produce various statistics of CO2 emissions, based on data from the world fleet database.
Reporting on objective (a) is outside the scope of this paper and is done elsewhere. The reader is referred to the study’s public final report for more details (see Psaraftis and Kontovas, 2008). The emissions web tool is freely available on-line1 and is the analogue of what some airlines have available on their web sites (tools available on-line) and of what some container lines have available for their customers (tools not available on-line).
One main output statistic of the world fleet analysis of this paper is the ratio of emitted grams of CO2 per tonne-km of transported cargo. The authors of this paper consider this statistic (which has been used for other transport modes as well) as reasonably representative of a vessel’s environmental performance in an operational setting. Another emissions statistic is an estimate of total CO2 emitted (in million tonnes per year) per size bracket for the above ship types (as compared to billions of tonne-kilometers carried by the same size bracket). Such statistics have been estimated for a variety of ship types and sizes and under a variety of scenarios as regards sea-to-port time, ship speed and fuel consumption at sea and in port. Some sensitivity analysis of these results has also been conducted. The description of the methodology and the results of this analysis are included in the rest of this paper.
The rest of this paper is organized as follows. Section 2 reports on relevant literature. Section 3 describes the methodology used in the paper. Section 4 describes the runs performed on the world shipping database. Section 5 comments on comparison with other studies and other modes. Finally Section 6 presents the paper’s conclusions.
2 Relevant Literature Looking at the literature on the broad area of this paper (including both scientific work and regulation-related documents), it is no surprise that the relevant material is immense. MEPC 572 alone had some 65 submissions, MEPC 58 had 45 submissions and the GHG intersessional group meeting in Oslo, Norway in June of 2008 had some 20 submissions. Still, we collected and studied a large number of such documents by focusing (a) on relations linking parameters such as bunker consumption, engine type and horsepower, to produced emissions of various exhaust types, (b) on data that can be used as inputs for our study (for instance, bunker consumption for various ship types) and (c) on various other reported statistics (for instance, bunker consumption). The latest documents that were reviewed before the study was completed were related to recent submissions to MEPC 57 and to BLG 123. After the study was completed, and as the final version of this paper was being written, we also reviewed documents that were submitted to MEPC 58 and, especially, the report of Phase 1 on the updated IMO study on GHG emissions from ships, of which more is discussed in section 5.1 of the paper (Buhaug et al, 2008).
Among the number of related IMO documents, perhaps the most seminal one from 2000 to mid-2008 was IMO (2000), in which an international consortium led by Marintek (Norway) delivered a report on GHG emissions from ships which included an estimation of the 1996 emissions inventory and the
1 Please go to www.martrans.org/emis . 2 MEPC: IMO’s Marine Environment Protection Committee. MEPC 57 was the committee’s 57th session, held in London on March 31- April 4, 2008. MEPC 58 was the committee’s 58th session, held also in London on October 6- October 10, 2008 3 BLG: IMO’s Subcommittee on Bulk Liquids and Gases. BLG 12 is the subcommittee’s 12th session, held in London, on February 4-8, 2008.
CO2 Emission Statistics for the World Commercial Fleet 3
examination of emission reduction possibilities through technical, operational and market-based approaches.
The Secretary-General of the IMO at MEPC 56 (London, July 2007) proposed the setting up of an informal Cross Government/Industry Scientific Group of Experts to evaluate the effects of the different fuel options proposed under the revision of MARPOL Annex VI and the NOx Technical Code. IMO(2007a) presented the inputs from the four subgroups to the final report. Among others, there is a section which contains the estimations of the fuel consumption and emissions for 2007 as well as the predicted trends leading to 2020. IMO(2007b) was the report on the outcome of this group of experts. Subsequently, MEPC 58 unanimously adopted amendments to the MARPOL Annex VI regulations. The main changes will see a progressive reduction in sulphur oxide (SOx) emissions from ships, with the global sulphur cap reduced initially to 3.50%, effective 1 January 2012; then progressively to 0.50 %, effective 1 January 2020 (IMO, 2008b).
Outside IMO documents, detailed methodologies for constructing fuel-based inventories of ship emissions have been published by Corbett and Köhler (2003), Endresen et al (2003, 2007), Eyring et al (2005), and in EMEP/CORINAIR (2002). The third edition of the Atmospheric Emission Inventory Guidebook was released by the EMEP Task Force on Emission Inventories. The guidebook outlined two methodologies (simple and detailed) for reporting national marine emissions for EU member states. The emission factors that were recommended in EMEP/CORINAIR in their 1999 study are widely used in the estimation of emission inventories (see, for example, IMO(2000), EMEP/CORINAIR(2002) and Endresen(2007)).
Corbett and Köhler (2003) estimate global fuel consumption for ships greater than 100 GRT by using engine power and vessel activity data. Endresen at al (2003) did a similar work but improved the spatial representation of global ship air emissions by weighting ship reporting frequencies using the Automated Mutual-assistance Vessel Rescue system (AMVER) data set.
The estimates of fuel consumption and emissions derived by Endresen et al. (2003) were significantly lower than those in Corbett and Köhler (2003) and Eyring et al. (2005). These differences have given rise to a debate about the veracity of the methods and results in the respective studies. The key input differences are the assumed utilization of installed engine power and the number of days vessels are assumed to spend at sea (Endresen,2007). Furthermore, Endresen et al (2004a) comment on Corbett’s and Köhler’s work led to a new paper from Corbett and Köhler (2004) where they published an updated version of their estimations by considering alternative input parameters in their activity-based model.
3 Methodology
3.1 “Bottom-up” versus “Top-down” approach There are generally two main methods that can be used to produce fuel consumption and emission estimates for shipping. One method uses marine fuel sales data in combination with fuel-related emission factors. The use of marine fuel sales to estimate emissions, also called top-down method, or fuel-based method, would be the most reliable method of estimating total fuel consumption and emissions if we could rely on the numbers of marine bunker fuels sales that are reported. Marine bunker supply is mainly collected from energy databases publish by the Energy Information Administration (EIA), the International Energy Agency (IEA) and United Nations Framework Convention on Climate Change (UNFCCC).
However, there is widespread doubt about the reliability of bunker fuel statistics as an indicator of actual fuel used in shipping. A first problem that becomes apparent when comparing these data sets is that EIA and IEA define “International bunkers” differently: IEA gives the fuel consumption of marine international bunkers including consumption by warship, while EIA includes some international jet fuel in its figures for world fuel consumption from international bunkers.
Psaraftis and Kontovas 4
Furthermore, estimates of global CO2 emissions from maritime transport derived from energy statistics differ substantially from activity-based estimates.
One reason for this discrepancy may be the practice of offshore tinkering, but probably the main reason is that bunker fuel statistics in some countries are unreliable. From the fuel suppliers’ side, errors such as sector misallocations or incorrect fuel-type descriptions may disturb the fuel balance, and general calculation uncertainties may bring a certain degree of inaccuracy to the fuel consumption figures arrived at.
Thus, fuel sales, even if we assume that the figures reported are correct, may provide reliable estimations of emissions in other transport modes such as rail and trucks but in shipping this would be true only for domestic shipping.
Due to difficulties in using the top-down method, as outlined above, an alternative method has emerged. This is the so-called bottom up method, or activity-based method. This is an approach based on fleet activity that tries to estimate world fleet emissions by calculating emissions for all possible ship-type and size brackets. This method needs information on ship movements and ship characteristics (vessel type and size, engine type and age, fuel type, etc), as well as the corresponding fuel consumption figures and emission factors. The approach has many variants, mainly depending on how the set of inputs is obtained, and what modelling or other assumptions are used.
In this study we have used a bottom-up approach, the methodology of which described in the rest of section 3 and in section 4.
3.2 Emissions factor
CO2 emissions in our study were calculated as follows. Fuel consumption was used as the main input, as opposed to horsepower, since fuel consumption data was the main input data that was solicited and received. Then, independent of type of fuel, one multiplies total bunker consumption (in tonnes per day) by a factor of 3.17 to compute CO2 emissions (in tonnes per day).
The 3.17 CO2 factor has been the empirical mean value most commonly used in CO2 emissions calculations based on fuel consumption (see EMEP/CORINAIR (2002) and Endresen(2007)). According to the IMO GHG study (IMO, 2000), the actual value of this coefficient may range from 3.159 (low value) to 3.175 (high value), that is, the maximum variation differential is about 0.5%.
The update of the IMO 2000 study (Buhaug et al,2008), which has been presented at MEPC 58, uses slightly lower coefficients, different for Heavy Fuel Oil and for Marine Diesel Oil. The actual values are 3.082 for Marine Diesel and Marine Gas Oils (MDO/MGO) and 3.021 for Heavy Fuel Oils (HFO). According to the report of the Working Group on Greenhouse Gas Emissions from Ships (IMO, 2008c), the group agreed that the Carbon to CO2 conversion factors used by the IMO should correspond to the factors used by IPCC (2006 IPCC Guidelines) in order to ensure harmonization of the emissions factor used by parties under the UNFCCC and the Kyoto Protocol.
If the new coefficients are adopted, our emission statistics will have to be proportionally scaled down (less than 5 %), but the major conclusions of our study will not change.
3.3 Data collection All ship emissions studies that we have seen use modelling to estimate fuel consumption on board a ship, mainly in order to convert engine horsepower to fuel consumption. Our study’s approach was to try using fuel consumption information (on a per ship basis) directly as an input, and only if such information was not available, compute it by other methods, for instance via engine horsepower.
CO2 Emission Statistics for the World Commercial Fleet 5
Thus, and for the purposes of this study, the Hellenic Chamber of Shipping (HCS) solicited from its members and provided to the authors a variety of data, and said data was subsequently analyzed. In total 29 member companies responded, providing data for some 375 ships of various types that covered a broad spectrum of ship types and sizes. Solicited data included:
• Ship type
• Year of built
• Deadweight (DWT)
• Average cargo payload per laden trip
• Engine type
• Horsepower
• Speed (laden, ballast)
• Time in port (loading, discharging)
• Fuel type (sea, port)
• Total Fuel consumption at sea(laden and ballast) - by type of fuel
• Total Fuel consumption at port (loading and discharging) - by type of fuel
Variants of such data for specific ship types (for instance, number of passengers for passenger ships) were also solicited.
We should clarify here that although perhaps a primary use of such data was for the study’s web tool, the data was also used as a valuable real-data cross-reference for the analysis of the world fleet.
A detailed top-down approach would require as inputs fuel consumption information for all ships in the world fleet. Since this kind of information is generally elusive, the next best alternative would be to gather detailed information on ship movements worldwide, and based on that, estimate fuel consumption for each ship. However, this alternative also presented problems, as an analysis of detailed ship movement information worldwide was outside the scope of our study. Our analysis broke down the world fleet into major ship types and size brackets (as described in section 4.1), and used the following inputs for each type-size bracket combination:
• Deadweight (DWT) (tonnes)
• Average Cargo Capacity Utilization w (0<w<1)
• Speed of ship at sea V (km/day)
• Percentage of total operational time that ships spends at sea, s (0≤s≤1)
• Total Fuel Consumption at sea, including fuel that is used by Maine Engine and Auxiliaries, F (tonnes/day)
• Total Fuel Consumption in port, including fuel that is used by Maine Engine and Auxiliaries, G (tonnes/day)
• Operational days per year, D (days) (D≤365)
The above inputs are averages, over all ships within the specific ship type and size bracket combination.
Psaraftis and Kontovas 6
3.4 Algebra of emissions If we assume the ship to be operational during a period of D days per year, and we also assume to know s, the fraction of D the ship is at sea (0≤s≤1), then the fraction of D the ship is at port is p = 1-s. Then, Sea days in a year: sD Port days in a year: pD (and idle days in a year: 365-D) We also note that if a ship travels full in one direction and empty on ballast (such as typically for tankers), then w=0.5. But in case of triangular routes (for instance, for bulk carriers) w could be higher than 0.5. Then we would have (for the specific ship type-size bracket under consideration): Sea kilometers in a year (km): sDV Total fuel consumption in a year (tonnes): (sF + pG)D Total CO2 in a year (tonnes): 3.17(sF + pG)D = 3.17[s(F-D)+G]D Total tonne-km’s in a year: (wW)(sDV) CO2 per tonne-km: 3.17[F+(p/s)G]/wWv Total tonne-km’s here are computed by multiplying the average payload carried by the ship when at sea (wW) by the total sea kilometers traveled by the ship in a year (sDV). Note that in the absence of trip distance information, it is impossible to know the total amount of cargo hauled in a year by a ship, although the equivalent tonne-km’s can be estimated. In fact, one can have two identical ships A and B, with ship A engaged in a trade with trip distance double that of ship B. If fractions s and p are the same for both ships, both would register the same tonne-km’s in a year, but the total amount of cargo carried by ship A would be half of that carried by ship B. Since our study did not use trip distance information, there was no estimate of the total amount of cargo carried by the world fleet either. However, there was an estimate of the total tonne-km’s registered. Some more observations are in order: First, it is interesting to see that, as much as total CO2 emitted is an increasing (in fact, linear) function of D (days per year the ship is operational), the total CO2 emitted per tonne-km is independent of D (which is probably not a surprise). Second, and since F>D, total CO2 emitted is –as expected- an increasing function of s, the fraction of time the ship is at sea, and therefore of the sea-to-port time ratio (s/p). But the CO2 emitted per tonne-km is a decreasing function of that same ratio. If the latter result looks counter-intuitive, it is not, since while in port the ship on the one hand produces emissions that are lower than those produced at sea (on a per day basis), on the other hand in port the ship hauls zero cargo, thus produces zero tonne-km’s, and this is what is the decisive factor. Also, an inverse relationship of CO2 per tonne-km with speed V is seen, but this is misleading as F is generally a cubic function of V, therefore the overall the CO2 produced per tonne-km is a quadratic function of V. In addition to the above, we could also compute other statistics on a fleet or size bracket basis, such as total bunkers consumed, total CO2 produced, and others (see also section 4). In case of pure passenger vessels, W should be replaced by the passenger number and statistics should be in terms of CO2 per passenger-km.
CO2 Emission Statistics for the World Commercial Fleet 7
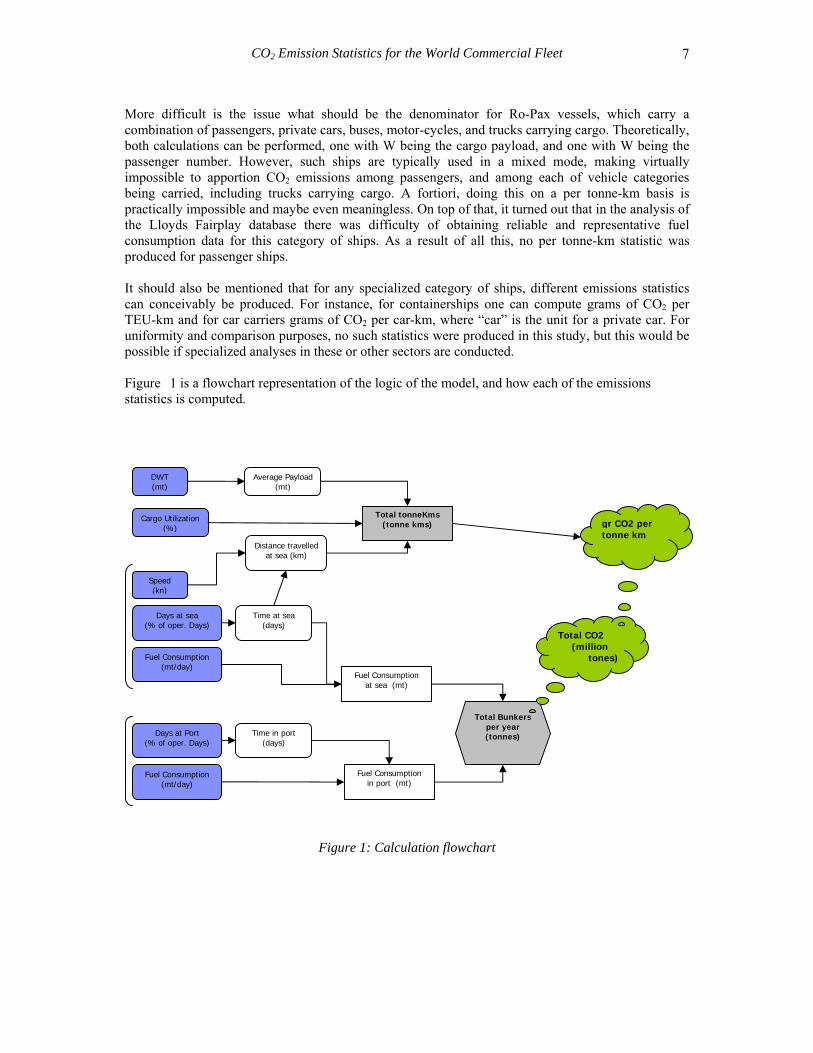
More difficult is the issue what should be the denominator for Ro-Pax vessels, which carry a combination of passengers, private cars, buses, motor-cycles, and trucks carrying cargo. Theoretically, both calculations can be performed, one with W being the cargo payload, and one with W being the passenger number. However, such ships are typically used in a mixed mode, making virtually impossible to apportion CO2 emissions among passengers, and among each of vehicle categories being carried, including trucks carrying cargo. A fortiori, doing this on a per tonne-km basis is practically impossible and maybe even meaningless. On top of that, it turned out that in the analysis of the Lloyds Fairplay database there was difficulty of obtaining reliable and representative fuel consumption data for this category of ships. As a result of all this, no per tonne-km statistic was produced for passenger ships. It should also be mentioned that for any specialized category of ships, different emissions statistics can conceivably be produced. For instance, for containerships one can compute grams of CO2 per TEU-km and for car carriers grams of CO2 per car-km, where “car” is the unit for a private car. For uniformity and comparison purposes, no such statistics were produced in this study, but this would be possible if specialized analyses in these or other sectors are conducted. Figure 1 is a flowchart representation of the logic of the model, and how each of the emissions statistics is computed.
Figure 1: Calculation flowchart
DWT (mt)
Cargo Utilization (%)
Speed (kn)
Days at sea (% of oper. Days)
Fuel Consumption (mt/day)
Days at Port (% of oper. Days)
Fuel Consumption (mt/day)
Time at sea (days)
Average Payload (mt)
Fuel Consumptionat sea (mt)
Time in port (days)
Fuel Consumptionin port (mt)
Distance travelled at sea (km)
Total tonneKms(tonne kms)
Total Bunkersper year (tonnes)
Total CO2 (million tones)
gr CO2 per tonne km
Psaraftis and Kontovas 8
4 Runs of world fleet database
4.1 Main runs The analysis of the world fleet database (source: Lloyds Fairplay) was extensive and has produced CO2 emission statistics for the following ship types, broken down in several size brackets for each type: bulk carriers, crude oil tankers, container vessels, product/chemical carriers, LNG carriers, LPG carriers, reefer vessels, Ro-Ro vessels and general cargo ships. A separate analysis was carried out for small vessels under 400 GRT and for passenger vessels. The main output of the analysis for each ship type and size bracket has been the ratio of emitted grams of CO2 per tonne-km of transported cargo in a year. Another output has been the total CO2 produced per size bracket for the above ship types. All this has been estimated under a variety of scenarios as regards sea-to-port time, ship speed and fuel consumption at sea and in port. Some sensitivity analysis of these results has also been conducted.
It should be mentioned that whereas the Lloyds-Fairplay ship database (Lloyds Maritime Information Services, 2007) includes some 100,293 vessels greater than 100 GRT. 49,748 of these are either non-commercial or non self-propelled ships, including barges, dredgers, drilling ships, fishing vessels, fire-fighting vessels, ice-breakers, offshore vessels, tugs, naval vessels, and a variety of others. The analysis carried out concerns the rest of the database (50,545 vessels) and includes cargo and passenger vessels. This subgroup represents 95% of the total gross tonnage of the ocean-going fleet and is mostly relevant for the IMO as the provisions of MARPOL’s Annex VI concern commercial ships of 400 GRT and above and oil tankers of 150 GRT and above.
This subgroup of the fleet was further broken down into major categories of ships such as bulk carriers, crude oil carriers and containerships, among others. A number of vessels (4,925) were left out of the analysis either because of insufficient data (for example no registered engine horse power), or because they did not belong to any major category (for example non-crude oil tankers such as sulphur tankers, water tankers, other unspecified tankers, non-dry bulk carriers, livestock carriers and others). With these vessels excluded, our analysis was carried out using data from 45,620 vessels. As the 4,925 vessels that were left out are typically of very small size, it is speculated that their effect on overall emissions statistics, should they be eventually included in the analysis, would be very small.
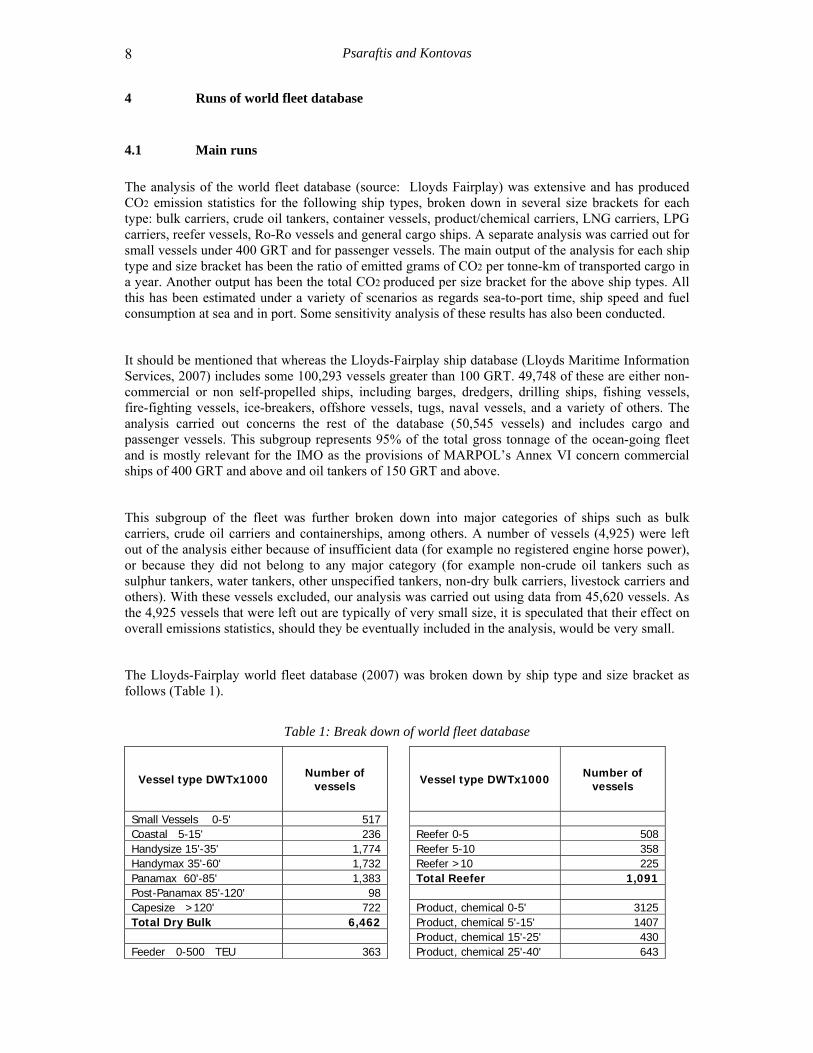
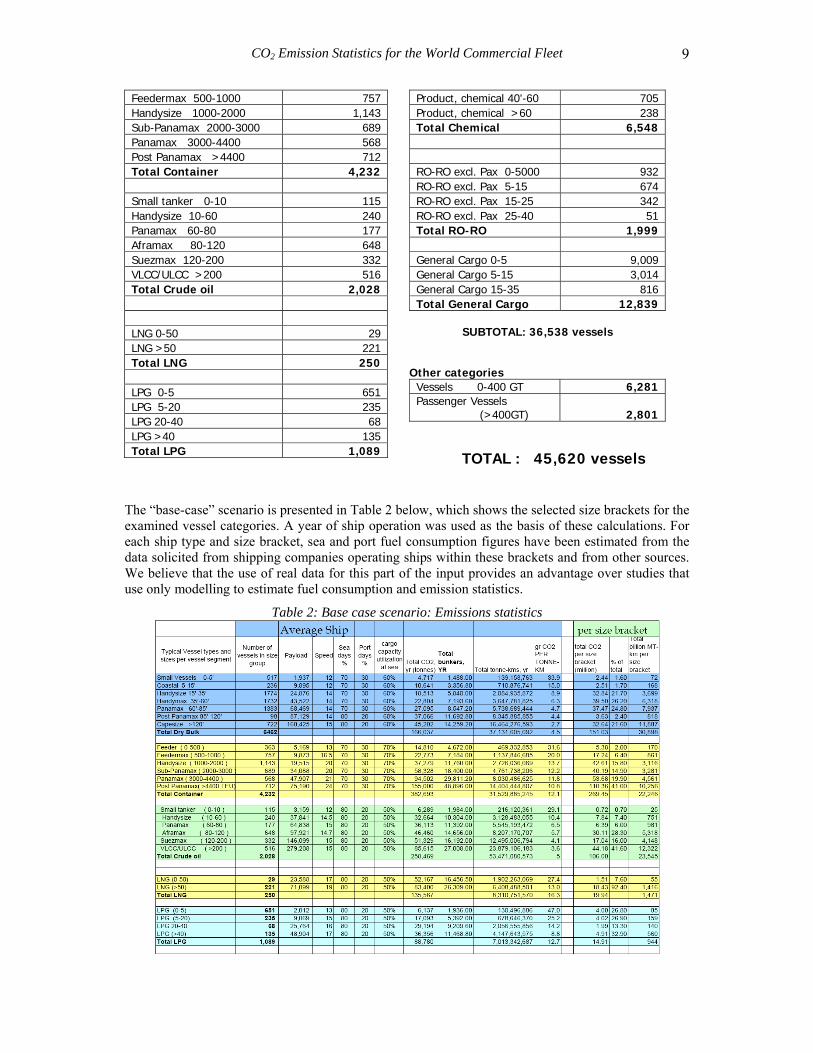
The Lloyds-Fairplay world fleet database (2007) was broken down by ship type and size bracket as follows (Table 1).
Table 1: Break down of world fleet database
Vessel type DWTx1000 Number of vessels
Small Vessels 0-5' 517 Coastal 5-15' 236 Handysize 15'-35' 1,774 Handymax 35'-60' 1,732 Panamax 60'-85' 1,383 Post-Panamax 85'-120' 98 Capesize >120' 722 Total Dry Bulk 6,462 Feeder 0-500 TEU 363
Vessel type DWTx1000 Number of vessels
Reefer 0-5 508 Reefer 5-10 358 Reefer >10 225 Total Reefer 1,091 Product, chemical 0-5' 3125 Product, chemical 5'-15' 1407 Product, chemical 15'-25' 430 Product, chemical 25'-40' 643
CO2 Emission Statistics for the World Commercial Fleet 9
Feedermax 500-1000 757 Handysize 1000-2000 1,143 Sub-Panamax 2000-3000 689 Panamax 3000-4400 568 Post Panamax >4400 712 Total Container 4,232 Small tanker 0-10 115 Handysize 10-60 240 Panamax 60-80 177 Aframax 80-120 648 Suezmax 120-200 332 VLCC/ULCC >200 516 Total Crude oil 2,028 LNG 0-50 29 LNG >50 221 Total LNG 250 LPG 0-5 651 LPG 5-20 235 LPG 20-40 68 LPG >40 135 Total LPG 1,089
Product, chemical 40'-60 705 Product, chemical >60 238 Total Chemical 6,548 RO-RO excl. Pax 0-5000 932 RO-RO excl. Pax 5-15 674 RO-RO excl. Pax 15-25 342 RO-RO excl. Pax 25-40 51 Total RO-RO 1,999 General Cargo 0-5 9,009 General Cargo 5-15 3,014 General Cargo 15-35 816 Total General Cargo 12,839
SUBTOTAL: 36,538 vessels
Other categories Vessels 0-400 GT 6,281Passenger Vessels (>400GT)
2,801
TOTAL : 45,620 vessels
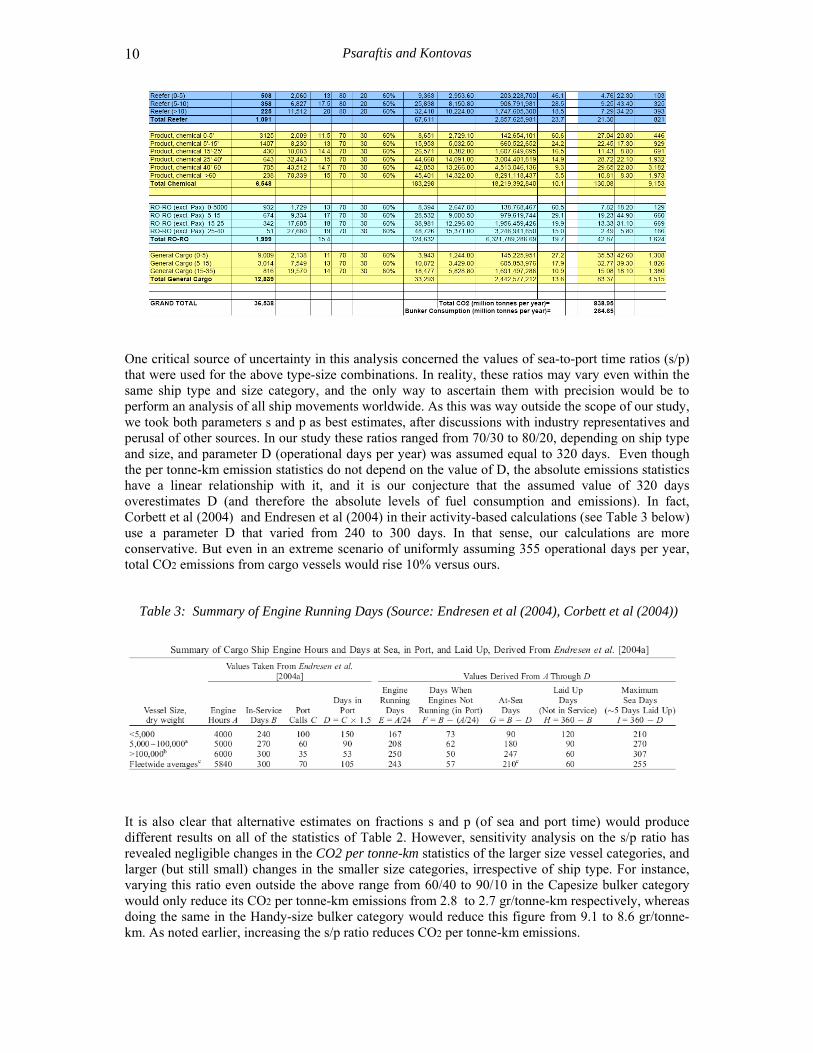
The “base-case” scenario is presented in Table 2 below, which shows the selected size brackets for the examined vessel categories. A year of ship operation was used as the basis of these calculations. For each ship type and size bracket, sea and port fuel consumption figures have been estimated from the data solicited from shipping companies operating ships within these brackets and from other sources. We believe that the use of real data for this part of the input provides an advantage over studies that use only modelling to estimate fuel consumption and emission statistics.
Table 2: Base case scenario: Emissions statistics
Psaraftis and Kontovas 10
One critical source of uncertainty in this analysis concerned the values of sea-to-port time ratios (s/p) that were used for the above type-size combinations. In reality, these ratios may vary even within the same ship type and size category, and the only way to ascertain them with precision would be to perform an analysis of all ship movements worldwide. As this was way outside the scope of our study, we took both parameters s and p as best estimates, after discussions with industry representatives and perusal of other sources. In our study these ratios ranged from 70/30 to 80/20, depending on ship type and size, and parameter D (operational days per year) was assumed equal to 320 days. Even though the per tonne-km emission statistics do not depend on the value of D, the absolute emissions statistics have a linear relationship with it, and it is our conjecture that the assumed value of 320 days overestimates D (and therefore the absolute levels of fuel consumption and emissions). In fact, Corbett et al (2004) and Endresen et al (2004) in their activity-based calculations (see Table 3 below) use a parameter D that varied from 240 to 300 days. In that sense, our calculations are more conservative. But even in an extreme scenario of uniformly assuming 355 operational days per year, total CO2 emissions from cargo vessels would rise 10% versus ours.
Table 3: Summary of Engine Running Days (Source: Endresen et al (2004), Corbett et al (2004))
It is also clear that alternative estimates on fractions s and p (of sea and port time) would produce different results on all of the statistics of Table 2. However, sensitivity analysis on the s/p ratio has revealed negligible changes in the CO2 per tonne-km statistics of the larger size vessel categories, and larger (but still small) changes in the smaller size categories, irrespective of ship type. For instance, varying this ratio even outside the above range from 60/40 to 90/10 in the Capesize bulker category would only reduce its CO2 per tonne-km emissions from 2.8 to 2.7 gr/tonne-km respectively, whereas doing the same in the Handy-size bulker category would reduce this figure from 9.1 to 8.6 gr/tonne-km. As noted earlier, increasing the s/p ratio reduces CO2 per tonne-km emissions.
CO2 Emission Statistics for the World Commercial Fleet 11
Of course, the apparent lack of sensitivity of the per tonne-km emissions statistics on the s/p ratio does not hold for the statistics on the absolute quantities of total bunkers consumed and total CO2 emitted. These are sensitive to the assumed values of sea and port times, all of them being increasing functions of the s/p ratio. Therefore the values of these statistics in our study should be interpreted with caution if the intent is to use them to estimate total world bunker consumption or global CO2 emissions of the word fleet. However, we were able to cross check some annual bunker consumption figures with industry representatives for various types of ships, and, as a result, we have a reasonable degree of confidence on bunker consumption figures for several types of ships (most notably bulk carriers, crude oil carriers and container vessels).
In all ship categories, maximum payload was assumed equal to 95% of DWT, and several average capacity utilizations (w) when at sea were assumed, ranging from 70% for container vessels to 50% for tankers. The 50% figure for tankers means that the ship spends half of its sea time full and half empty (on ballast), while higher figures (60%) are possible for bulk carriers due to possible triangular routes and for container vessels (70%) due to the nature of the container trades. Again, statistics of Table 1 depend on the assumed values of these capacity utilizations. In terms of sensitivity analysis, changing the figures of capacity utilization (w) was found to change the CO2 per tonne-km figures uniformly (down for increasing utilization), with no change in the relative standing among ship categories.
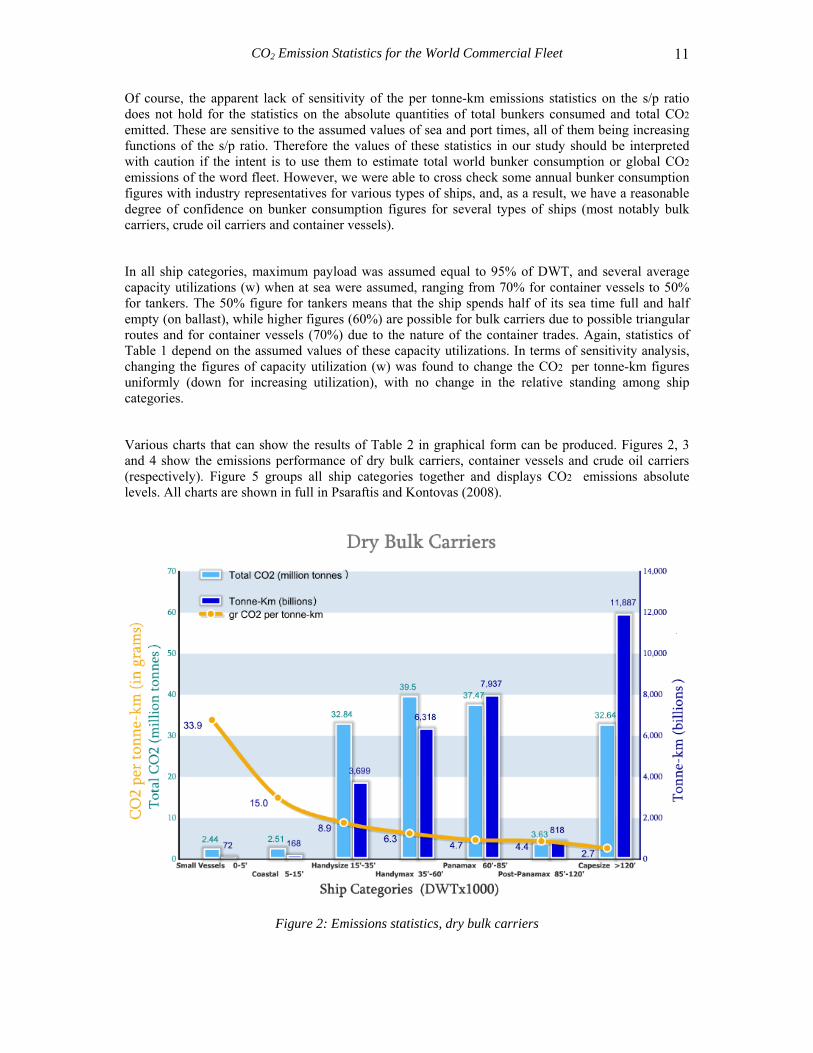
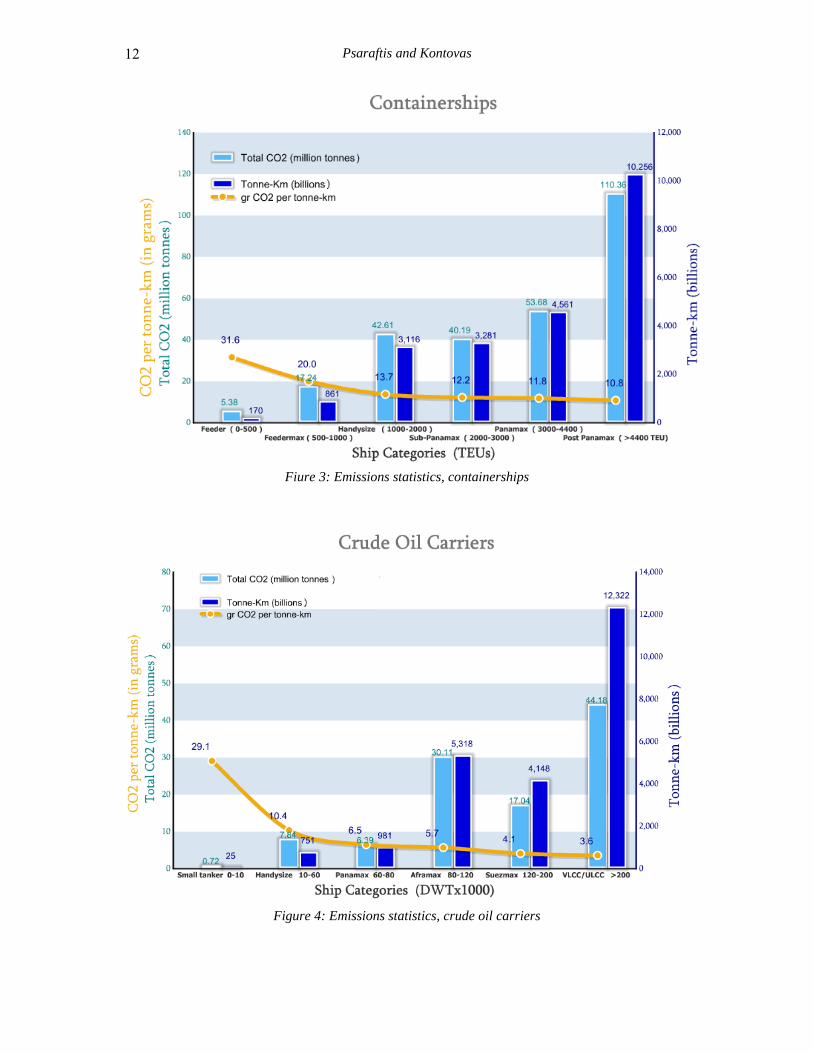
Various charts that can show the results of Table 2 in graphical form can be produced. Figures 2, 3 and 4 show the emissions performance of dry bulk carriers, container vessels and crude oil carriers (respectively). Figure 5 groups all ship categories together and displays CO2 emissions absolute levels. All charts are shown in full in Psaraftis and Kontovas (2008).
Figure 2: Emissions statistics, dry bulk carriers
Psaraftis and Kontovas 12
Fiure 3: Emissions statistics, containerships
Figure 4: Emissions statistics, crude oil carriers
CO2 Emission Statistics for the World Commercial Fleet 13
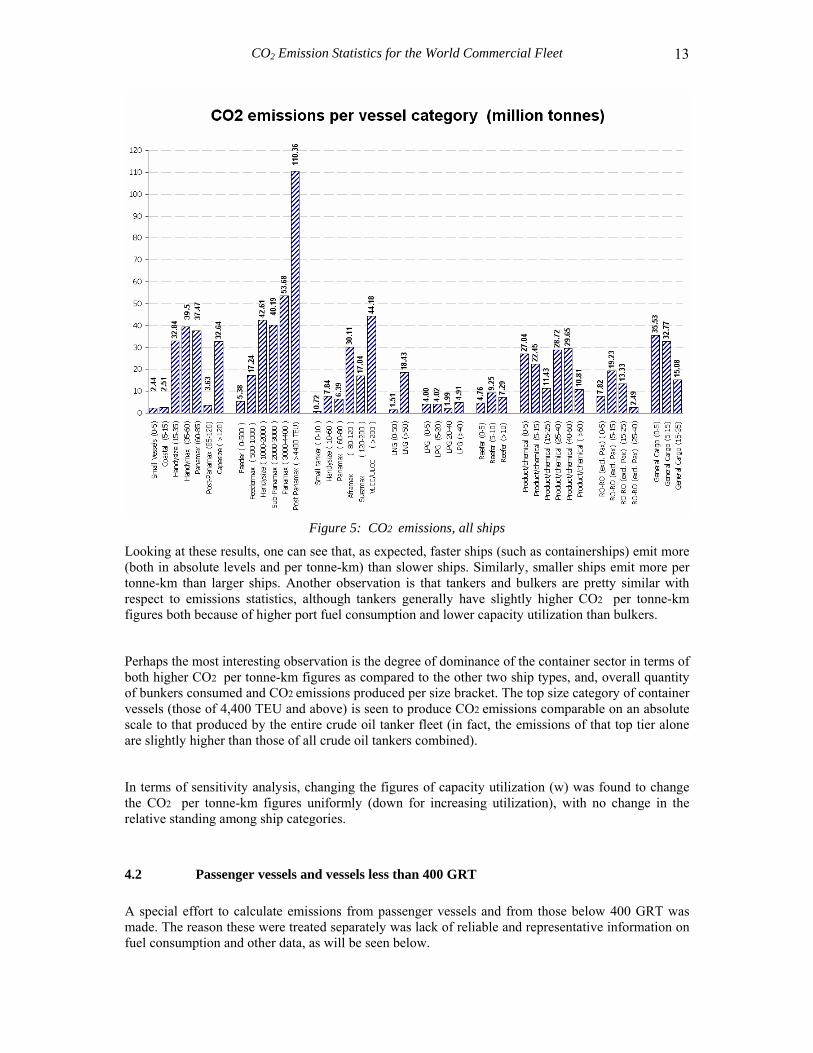
Figure 5: CO2 emissions, all ships
Looking at these results, one can see that, as expected, faster ships (such as containerships) emit more (both in absolute levels and per tonne-km) than slower ships. Similarly, smaller ships emit more per tonne-km than larger ships. Another observation is that tankers and bulkers are pretty similar with respect to emissions statistics, although tankers generally have slightly higher CO2 per tonne-km figures both because of higher port fuel consumption and lower capacity utilization than bulkers.
Perhaps the most interesting observation is the degree of dominance of the container sector in terms of both higher CO2 per tonne-km figures as compared to the other two ship types, and, overall quantity of bunkers consumed and CO2 emissions produced per size bracket. The top size category of container vessels (those of 4,400 TEU and above) is seen to produce CO2 emissions comparable on an absolute scale to that produced by the entire crude oil tanker fleet (in fact, the emissions of that top tier alone are slightly higher than those of all crude oil tankers combined).
In terms of sensitivity analysis, changing the figures of capacity utilization (w) was found to change the CO2 per tonne-km figures uniformly (down for increasing utilization), with no change in the relative standing among ship categories.
4.2 Passenger vessels and vessels less than 400 GRT A special effort to calculate emissions from passenger vessels and from those below 400 GRT was made. The reason these were treated separately was lack of reliable and representative information on fuel consumption and other data, as will be seen below.
Psaraftis and Kontovas 14
A number of 6,281 vessels below 400 GRT were identified. These were treated as a homogenous group, assuming an average fuel consumption of 210 gr/kWh and 300 operational days per year (of which 180 at sea). The fuel consumption figure was taken from IMO (2007b) and is supported by Endresen (2004) and Corbett and Köhler (2004).
The case of passenger ships was more difficult. A total fleet of 2,801 vessels was broken down into three basic categories: cruise vessels, multihulls and general Ro-Pax vessels. We assumed a fuel consumption of 160-180 gr/kWh (which is a typical fuel consumption for medium speed and high speed main engines according to engine manufacturers) and 300 operational days per year (of which 240 at sea). Based on this, the total CO2 emissions of this part of the fleet were calculated, based on the total recorded horsepower for these ships (as per Lloyds – Fairplay database).
In trying to cross-reference this information, we also obtained data from two Greek Ro-Pax shipping companies, operating modern ferries in the Adriatic and Aegean seas. Actual fuel consumption figures were some 12-25% lower than the ones assumed above. By contrast, annual days at sea were higher (as high as 270, as opposed to 240, i.e. about 12% higher), and we were unable to distinguish operational time in port (in which the ship’s auxiliary engines are running) from idle time in port (in which there are no emissions).
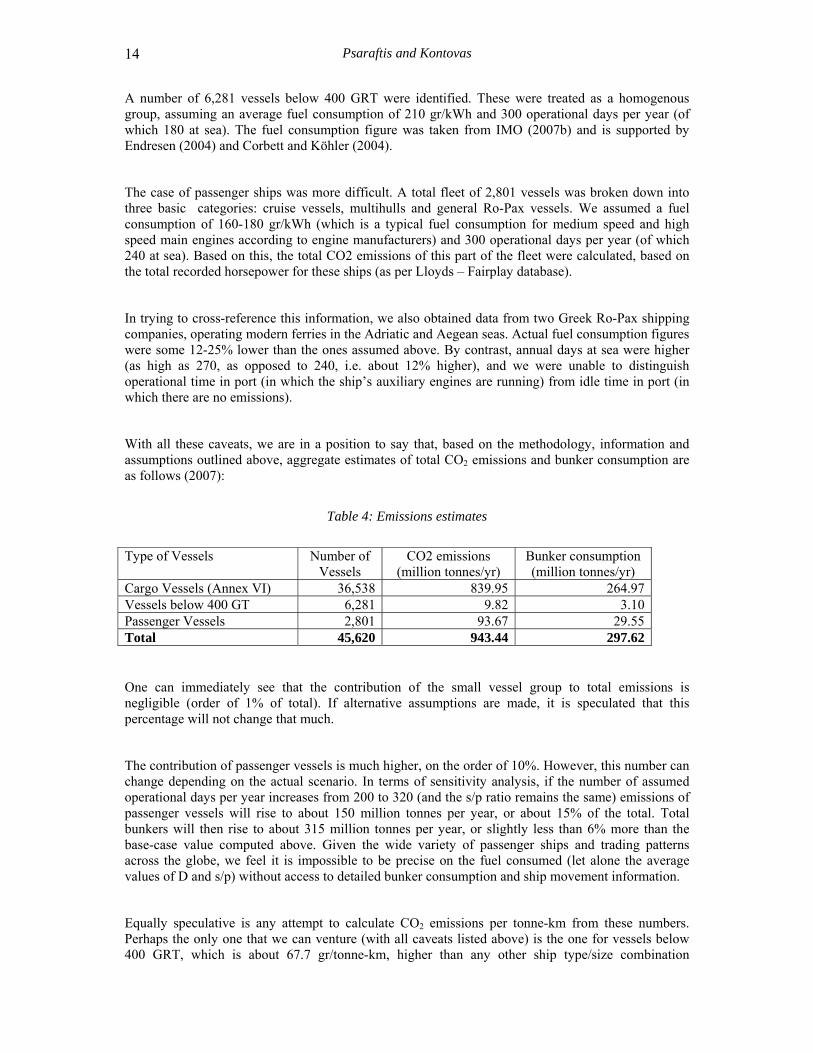
With all these caveats, we are in a position to say that, based on the methodology, information and assumptions outlined above, aggregate estimates of total CO2 emissions and bunker consumption are as follows (2007):
Table 4: Emissions estimates
Type of Vessels Number of Vessels
CO2 emissions (million tonnes/yr)
Bunker consumption (million tonnes/yr)
Cargo Vessels (Annex VI) 36,538 839.95 264.97 Vessels below 400 GT 6,281 9.82 3.10 Passenger Vessels 2,801 93.67 29.55 Total 45,620 943.44 297.62 One can immediately see that the contribution of the small vessel group to total emissions is negligible (order of 1% of total). If alternative assumptions are made, it is speculated that this percentage will not change that much.
The contribution of passenger vessels is much higher, on the order of 10%. However, this number can change depending on the actual scenario. In terms of sensitivity analysis, if the number of assumed operational days per year increases from 200 to 320 (and the s/p ratio remains the same) emissions of passenger vessels will rise to about 150 million tonnes per year, or about 15% of the total. Total bunkers will then rise to about 315 million tonnes per year, or slightly less than 6% more than the base-case value computed above. Given the wide variety of passenger ships and trading patterns across the globe, we feel it is impossible to be precise on the fuel consumed (let alone the average values of D and s/p) without access to detailed bunker consumption and ship movement information.
Equally speculative is any attempt to calculate CO2 emissions per tonne-km from these numbers. Perhaps the only one that we can venture (with all caveats listed above) is the one for vessels below 400 GRT, which is about 67.7 gr/tonne-km, higher than any other ship type/size combination
CO2 Emission Statistics for the World Commercial Fleet 15
examined (as expected). For passenger vessels, any aggregate per tonne-km figure would likely be misleading, or even meaningless, as cruise ships (that carry no cargo) are different from Ro-pax ships (that carry a mixture of passengers, vehicles and cargo), or multi-hull ships (that may or may not carry cargo).
5 Comparison with other studies and other modes
5.1 Comparison with other studies In trying to compare our estimates of global fuel consumption and overall emissions with those of similar studies that estimate these figures, it is not surprising to see that this task is anything but straightforward. Usually the basis for such a comparison (for instance, the fleet whose emissions are studied, the year for which the emissions estimate is made, the breakdown of the fleet into ship types and size brackets, and a variety of other parameters) varies across studies, and one would have to look carefully at all of the assumptions, modelling and others, of these studies to be able to compare them properly, both against each other and against ours. Suffice it to say that wide differences exist even among expert estimates of global fuel consumption, and even within the IMO expert group study (IMO (2007a,b)) different databases of the fleet were given by the various parties who were engaged in the study, and some adjustments were necessary to achieve compatibility.
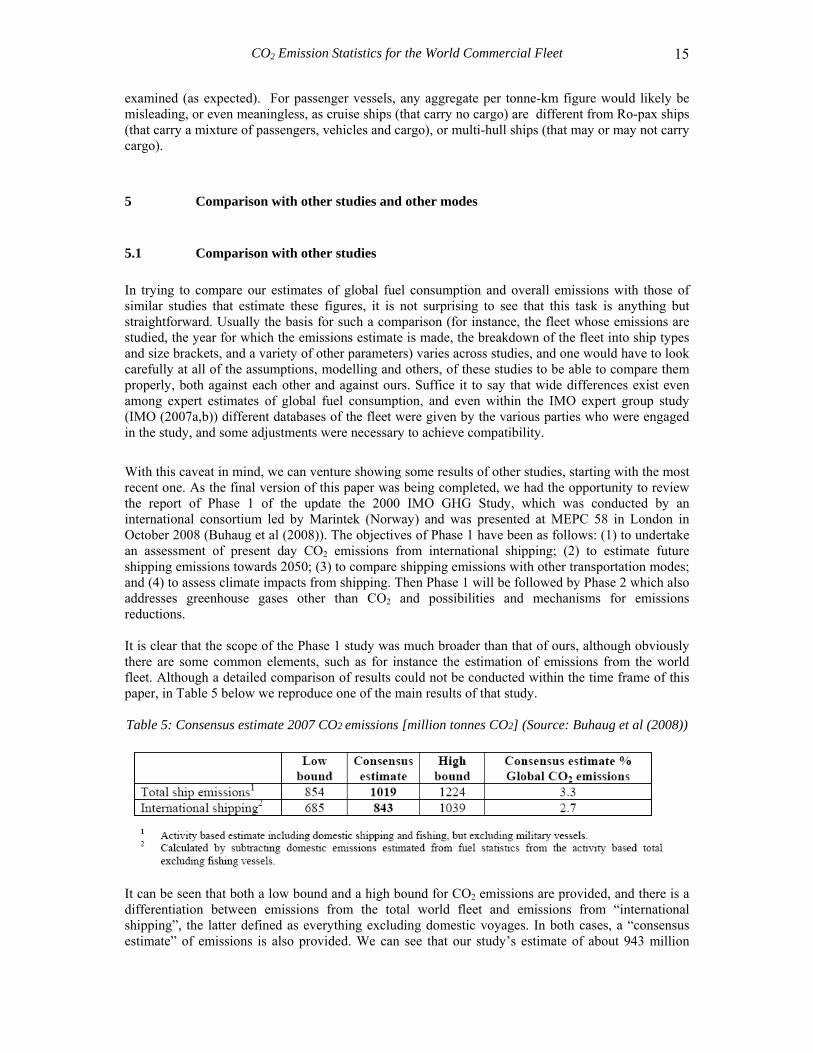
With this caveat in mind, we can venture showing some results of other studies, starting with the most recent one. As the final version of this paper was being completed, we had the opportunity to review the report of Phase 1 of the update the 2000 IMO GHG Study, which was conducted by an international consortium led by Marintek (Norway) and was presented at MEPC 58 in London in October 2008 (Buhaug et al (2008)). The objectives of Phase 1 have been as follows: (1) to undertake an assessment of present day CO2 emissions from international shipping; (2) to estimate future shipping emissions towards 2050; (3) to compare shipping emissions with other transportation modes; and (4) to assess climate impacts from shipping. Then Phase 1 will be followed by Phase 2 which also addresses greenhouse gases other than CO2 and possibilities and mechanisms for emissions reductions. It is clear that the scope of the Phase 1 study was much broader than that of ours, although obviously there are some common elements, such as for instance the estimation of emissions from the world fleet. Although a detailed comparison of results could not be conducted within the time frame of this paper, in Table 5 below we reproduce one of the main results of that study. Table 5: Consensus estimate 2007 CO2 emissions [million tonnes CO2] (Source: Buhaug et al (2008))
It can be seen that both a low bound and a high bound for CO2 emissions are provided, and there is a differentiation between emissions from the total world fleet and emissions from “international shipping”, the latter defined as everything excluding domestic voyages. In both cases, a “consensus estimate” of emissions is also provided. We can see that our study’s estimate of about 943 million
Psaraftis and Kontovas 16
tonnes of CO2 for 2007 lies within the range provided, being some 7.5% lower than the consensus estimate of 1,109 million tonnes. Given that the CO2 carbon coefficients we used are some 5% higher than those used by the other study, this means that our estimates are essentially about 12% lower.
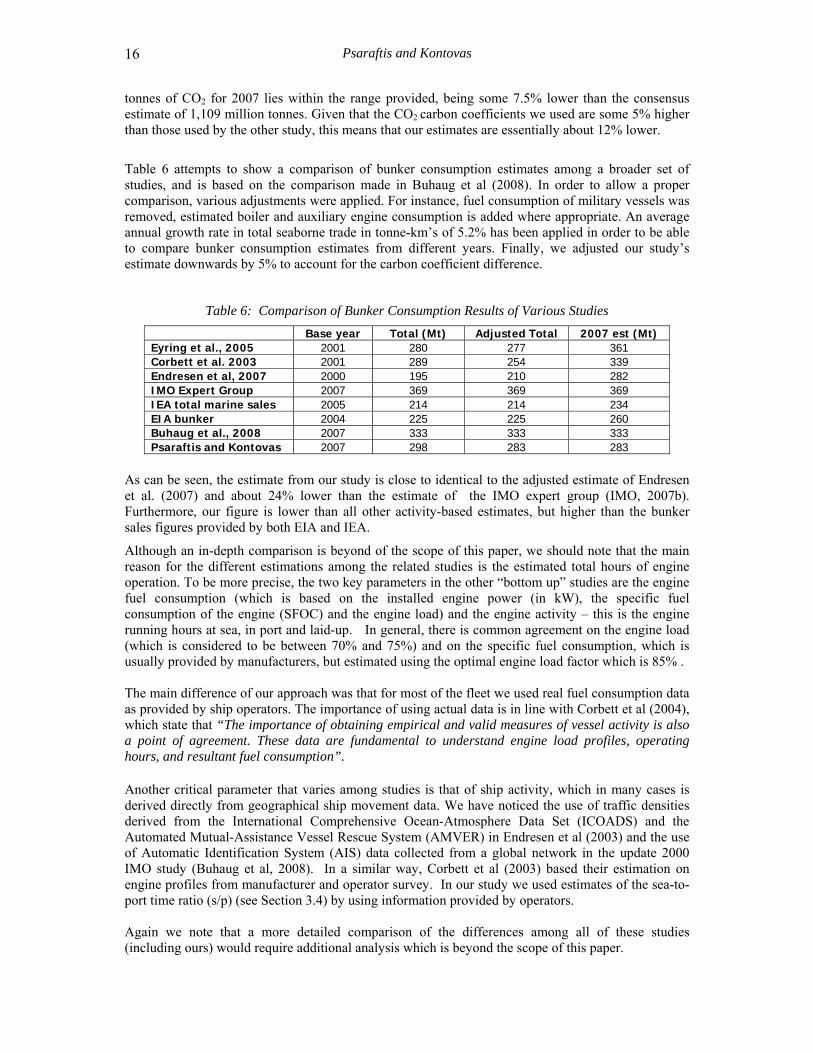
Table 6 attempts to show a comparison of bunker consumption estimates among a broader set of studies, and is based on the comparison made in Buhaug et al (2008). In order to allow a proper comparison, various adjustments were applied. For instance, fuel consumption of military vessels was removed, estimated boiler and auxiliary engine consumption is added where appropriate. An average annual growth rate in total seaborne trade in tonne-km’s of 5.2% has been applied in order to be able to compare bunker consumption estimates from different years. Finally, we adjusted our study’s estimate downwards by 5% to account for the carbon coefficient difference.
Table 6: Comparison of Bunker Consumption Results of Various Studies Base year Total (Mt) Adjusted Total 2007 est (Mt) Eyring et al., 2005 2001 280 277 361 Corbett et al. 2003 2001 289 254 339 Endresen et al, 2007 2000 195 210 282 IMO Expert Group 2007 369 369 369 IEA total marine sales 2005 214 214 234 EIA bunker 2004 225 225 260 Buhaug et al., 2008 2007 333 333 333 Psaraftis and Kontovas 2007 298 283 283
As can be seen, the estimate from our study is close to identical to the adjusted estimate of Endresen et al. (2007) and about 24% lower than the estimate of the IMO expert group (IMO, 2007b). Furthermore, our figure is lower than all other activity-based estimates, but higher than the bunker sales figures provided by both EIA and IEA.
Although an in-depth comparison is beyond of the scope of this paper, we should note that the main reason for the different estimations among the related studies is the estimated total hours of engine operation. To be more precise, the two key parameters in the other “bottom up” studies are the engine fuel consumption (which is based on the installed engine power (in kW), the specific fuel consumption of the engine (SFOC) and the engine load) and the engine activity – this is the engine running hours at sea, in port and laid-up. In general, there is common agreement on the engine load (which is considered to be between 70% and 75%) and on the specific fuel consumption, which is usually provided by manufacturers, but estimated using the optimal engine load factor which is 85% . The main difference of our approach was that for most of the fleet we used real fuel consumption data as provided by ship operators. The importance of using actual data is in line with Corbett et al (2004), which state that “The importance of obtaining empirical and valid measures of vessel activity is also a point of agreement. These data are fundamental to understand engine load profiles, operating hours, and resultant fuel consumption”. Another critical parameter that varies among studies is that of ship activity, which in many cases is derived directly from geographical ship movement data. We have noticed the use of traffic densities derived from the International Comprehensive Ocean-Atmosphere Data Set (ICOADS) and the Automated Mutual-Assistance Vessel Rescue System (AMVER) in Endresen et al (2003) and the use of Automatic Identification System (AIS) data collected from a global network in the update 2000 IMO study (Buhaug et al, 2008). In a similar way, Corbett et al (2003) based their estimation on engine profiles from manufacturer and operator survey. In our study we used estimates of the sea-to-port time ratio (s/p) (see Section 3.4) by using information provided by operators. Again we note that a more detailed comparison of the differences among all of these studies (including ours) would require additional analysis which is beyond the scope of this paper.
CO2 Emission Statistics for the World Commercial Fleet 17
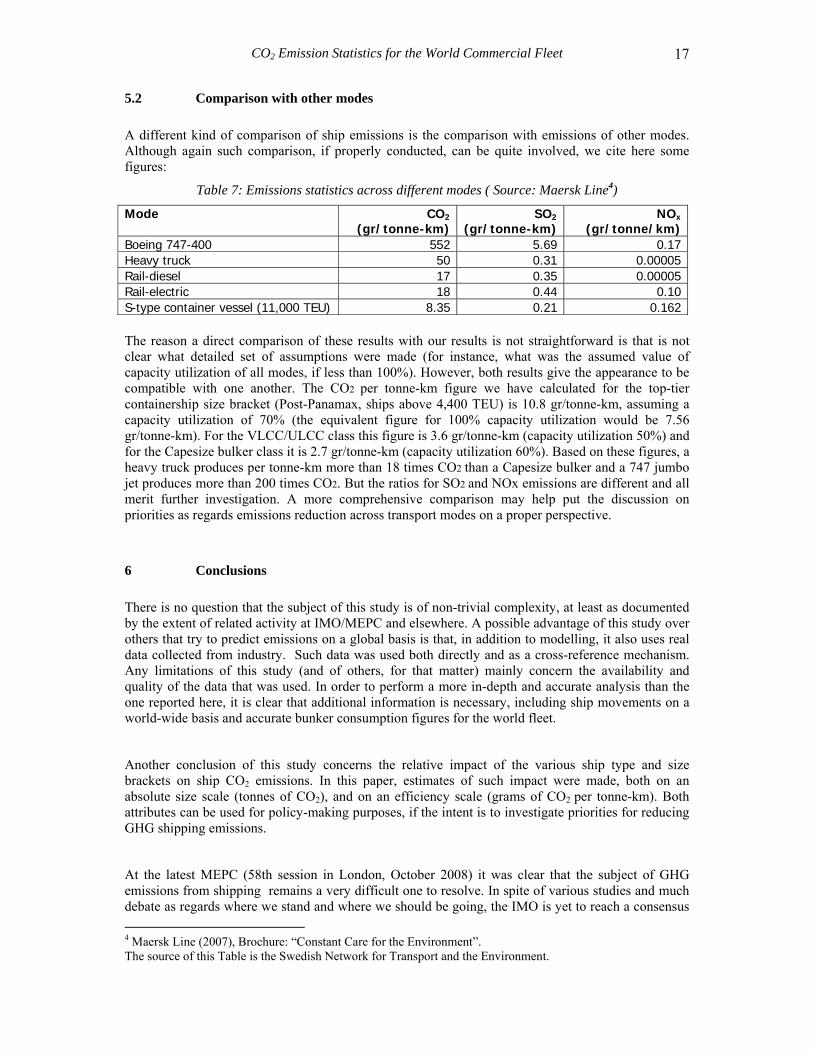
5.2 Comparison with other modes A different kind of comparison of ship emissions is the comparison with emissions of other modes. Although again such comparison, if properly conducted, can be quite involved, we cite here some figures:
Table 7: Emissions statistics across different modes ( Source: Maersk Line4)
Mode CO2
(gr/tonne-km)SO2
(gr/tonne-km)NOx
(gr/tonne/km)Boeing 747-400 552 5.69 0.17Heavy truck 50 0.31 0.00005Rail-diesel 17 0.35 0.00005Rail-electric 18 0.44 0.10S-type container vessel (11,000 TEU) 8.35 0.21 0.162 The reason a direct comparison of these results with our results is not straightforward is that is not clear what detailed set of assumptions were made (for instance, what was the assumed value of capacity utilization of all modes, if less than 100%). However, both results give the appearance to be compatible with one another. The CO2 per tonne-km figure we have calculated for the top-tier containership size bracket (Post-Panamax, ships above 4,400 TEU) is 10.8 gr/tonne-km, assuming a capacity utilization of 70% (the equivalent figure for 100% capacity utilization would be 7.56 gr/tonne-km). For the VLCC/ULCC class this figure is 3.6 gr/tonne-km (capacity utilization 50%) and for the Capesize bulker class it is 2.7 gr/tonne-km (capacity utilization 60%). Based on these figures, a heavy truck produces per tonne-km more than 18 times CO2 than a Capesize bulker and a 747 jumbo jet produces more than 200 times CO2. But the ratios for SO2 and NOx emissions are different and all merit further investigation. A more comprehensive comparison may help put the discussion on priorities as regards emissions reduction across transport modes on a proper perspective.
6 Conclusions There is no question that the subject of this study is of non-trivial complexity, at least as documented by the extent of related activity at IMO/MEPC and elsewhere. A possible advantage of this study over others that try to predict emissions on a global basis is that, in addition to modelling, it also uses real data collected from industry. Such data was used both directly and as a cross-reference mechanism. Any limitations of this study (and of others, for that matter) mainly concern the availability and quality of the data that was used. In order to perform a more in-depth and accurate analysis than the one reported here, it is clear that additional information is necessary, including ship movements on a world-wide basis and accurate bunker consumption figures for the world fleet.
Another conclusion of this study concerns the relative impact of the various ship type and size brackets on ship CO2 emissions. In this paper, estimates of such impact were made, both on an absolute size scale (tonnes of CO2), and on an efficiency scale (grams of CO2 per tonne-km). Both attributes can be used for policy-making purposes, if the intent is to investigate priorities for reducing GHG shipping emissions.
At the latest MEPC (58th session in London, October 2008) it was clear that the subject of GHG emissions from shipping remains a very difficult one to resolve. In spite of various studies and much debate as regards where we stand and where we should be going, the IMO is yet to reach a consensus 4 Maersk Line (2007), Brochure: “Constant Care for the Environment”. The source of this Table is the Swedish Network for Transport and the Environment.
Psaraftis and Kontovas 18
on what should be done to effectively curb CO2 and other GHG emissions. More important, significant divergence of opinion seems to exist among IMO member states on how to proceed. Phase 2 of the GHG study is just underway, and the hope is that this may used to bring about the action that is necessary to move ahead on this difficult problem. One thing is certain: it will not be easy.
7 Acknowledgments
Funding for this study was provided by the Hellenic Chamber of Shipping. We want to thank two anonymous referees for their comments on an earlier version of the manuscript and the shipping companies that provided data for our study. These are, alphabetically,
ANDRIAKI SHIPPING CO LTD AEOLOS MANAGEMENT SA ALPHA TANKER BLUE STAR FERRIES ANAΝGEL SHIP ENTERPRISES SA ATLANTIC BULK CARRIER MGT CARRAS HELLAS SA CELEBRITY CRUISES CENTROFIN MANAGEMENT INC CHANDRIS HELLAS INC COSTAMARE DANAOS SHIPPING CO LTD EASTERN MEDITERRANEAN MARITIME EASY CRUISE ELETSON CORP.
EUROPEAN PRODUCT CARRIERS FAFALIOS SHIPPING HALKIDON SHIPPING COPR HELLENIC SEAWAYS KRISTEN NAVIGATION MINERVA MARINE INC NEDA MARITIME NEPTUNE LINES NEREUS SHIPPING SA SKYROS SHIPPING SPRINGFIELD SHIPPING CO SUPERFAST FERRIES TSAGARIS PROS TSAKOS HELLAS VASSILIOS SHIPPING CO
References Buhaug, Ø.; Corbett, J. J.; Endresen, Ø.; Eyring, V.; Faber, J.; Hanayama, S.; Lee, D.S.; Lee, D.; Lindstad, H.; Mjelde, A.; Pålsson, C.; Wanquing, W.; Winebrake, J. J.; Yoshida, K. 2008. Updated Study on Greenhouse Gas Emissions from Ships: Phase I Report. International Maritime Organization (IMO) (included as Annex in document MEPC58/INF.6)
Corbett, J. J., and H. W. Köhler. 2003. Updated emissions from ocean shipping. Journal of Geophysical Research 108.
. 2004. Considering alternative input parameters in an activity-based ship fuel consumption and emissions model: Reply to comment by Øyvind Endresen et al. on ‘Updated emissions from ocean shipping. Journal of Geophysical Research 109.
Endresen, Ø., E. Sørgard, J. K. Sundet, S. B. Dalsøren, I. S. A. Isaksen, T. F. Berglen, and G. Gravir. 2003. Emission from international sea transportation and environmental impact. Journal of Geophysical Research 108.
CO2 Emission Statistics for the World Commercial Fleet 19
Endresen, Ø., E. Sørgard, J. Bakke, and I. S. A. Isaksen. 2004a. Substantiation of a lower estimate for the bunker inventory: Comment on ‘Updated emissions from ocean shipping’ by James J. Corbett and Horst W. Köhler. Journal of Geophysical Research. 109.
Endresen, Ø., Sørgård E., Behrens H. L., Brett P. O., and Isaksen I. S. A. . 2007. A historical reconstruction of ships fuel consumption and emissions. Journal of Geophysical Research 112.
EMEP/CORINAIR. 2002. EMEP Co-operative Programme for Monitoring and Evaluation of the Long Range Transmission of Air Pollutants in Europe, The Core Inventory of Air Emissions in Europe (CORINAIR), Atmospheric Emission Inventory Guidebook,” 3rd edition, October.
EnSys. 2007. Analysis of impacts ob global refining & CO2 emissions of potential MARPOL regulations for international marine bunker fuels. EnSys Energy & Systems.
Eyring, Köhler et al. 2005. Emissions from international shipping: 1. The last 50 years. Journal of Geophysical Research 110.
IMO. 2000. Study of Greenhouse Gas Emissions from Ships. Study by Marintek, Econ Centre for Economic Analysis, Carnegie Mellon University and DNV.
. 2007a. Input from the four subgroups and individual experts to the final report of the Informal Cross Government/Industry Scientific Group of Experts. Note by the Secretariat, BLG 12/INF.10.
. 2007b. Report on the outcome of the Informal Cross Government/Industry Scientific Group of Experts established to evaluate the effects of the different fuel options proposed under the revision of MARPOL Annex VI. Note by the Secretariat. BLG 12/6/1.
. 2008a. Future IMO regulation regarding green house gas emissions from international shipping. Submitted by Denmark, Marshall Islands, BIMCO, ICS, INTERCARGO, INTERTANKO and OCIMF. MEPC 57/4/2.
. 2008b. Report of the Drafting Group on amendments to MARPOL Annex VI and the NOx Technical Code. MEPC 58/WP.9. . 2008c. Report of the Working Group on Greenhouse Gas Emissions from Ships. MEPC 58/WP.8. Psaraftis, H.N., C.A. Kontovas. 2008. Ship Emissions Study. National Technical University of Athens. report to Hellenic Chamber of Shipping, May. Available online at http://www.martrans.org/emis/emis.htm.
UNFCC. 1997. Kyoto Protocol to the United Nations Framework Convention on Climate Change. available online at http://unfccc.int/resource/docs/convkp/kpeng.htm