survey on chronic pain - pae-eu.eu · the survey was developed by pae in collaboration with the...
TRANSCRIPT

P A I N A L L I A N C E E U R O P EJ U N E 2 0 1 7
The survey’s results analysis has been made possible with financial support from Grünenthal
SURVEY ON CHRONIC PAIN2 0 1 7
DIAGNOSIS, TREATMENT AND IMPACT OF PAIN

1
GETTING TO KNOW CHRONIC PAIN PATIENTS
Our mission is to improve the life of people suffering from chronic pain in Europe. For this, we need to know these people and their needs, and then we can define how we can address these in our future projects and activities.
The first step in this respect was to get to know them.
Pain Alliance Europe regularly consults its members and its members’ members via survey campaigns meant to find out where the challenges are and how they evolve, noticing the differences between different health management systems at national levels and then adapting the questions and the target according to the feedback thus received.
Should you have any suggestions or ideas on how the life of chronic pain patients can be improved, please write to us. Pain Alliance Europe’s mission is to make the patients’ voices heard, and this is exactly what we will do, sharing your ideas with the ones who can help making them work.
Consult this page regularly for updates on the upcoming surveys and how you can contribute. 1. INTRODUCTION
This report is about a survey on chronic pain performed in 17 countries. Pain Alliance Europe (PAE) regularly consults its members via survey campaigns in order to capture experiences and opinions on issues, challenges and solutions related to the impact of pain. Thus, the joint voice of patients and relevant stakeholders can be translated into policies and concrete actions to minimise the impact on pain.
Chronic pain is considered to be one of the main causes of disability, with considerable negative effects on productivity at work. It directly influences the budgets of social protection systems. It affects 20 percent of the adult population of Europe: 95 million people living with chronic pain1. Chronic pain patients are concerned about a lack of comprehensive legislation, inequalities in access to treatments, increasing the burden of the pain itself into a considerably reduced quality of life. About 34% of the patients suffering from chronic pain describe their pain as severe. Across Europe, the total cost of the consequences of chronic pain is estimated to be as high as €300 billion2.
1 Eurostat Data Explorer: http://appsso.eurostat.ec.europa.eu/nui/show.do 2 Pain Proposal: Improving the Current and Future Management of Chronic Pain. A European Consensus Report 2010

2
In 2006 Breivik and colleagues performed a large scale and very extensive survey on the prevalence, impact on daily life and treatment of chronic pain in Europe. Since then no follow-up survey has been conducted and therefore this survey was performed to give more up-to-date insights into the societal impact of pain in Europe. The survey focussed on issues from a patients’ perspective: such as experience with daily care delivery as well as information on who cares for people with pain. This survey is the first stepping stone for future consultations, with the objective of translating its findings into policy recommendations and actions. 2. METHODS 2.1 Data collection Pain Alliance Europe involved its member organisations in a survey in order to collect information from the pain patients themselves on their daily experience of chronic pain. This large scale online survey was performed during March and April 2017 in 17 countries in Europe. A questionnaire on the impact of pain was distributed through the member network of Pain Alliance Europe, The invitation to participate in the survey was sent to patients listed in the registries of 33 national patient organisations and charities. The invitation letter contained instructions and a link to the web-based SurveyMonkey response form which was available in 18 languages. In total 3490 complete responses forms were received and used for analysis. Due the ‘open’ invitation approach an exact response rate per country cannot be given. Consequently, no information is available on the representativeness of the survey sample and therefore selection bias may have occurred: meaning that patient groups with particular chronic pain condition could be underrepresented relative to the actual population of patients with pain in a given country simply because they are not a member of a charity. The same may be applicable for overrepresentation when a relative high number of patients suffering from a particular condition are members of a charity. 2.2 Survey The survey was developed by PAE in collaboration with the national patient organisations and was based on information from literature and existing questionnaires. In total the survey consisted of 23 items which addressed such topics as: ‘time dimensions of diagnosis and pain’, ‘treatment’ and ‘impact of pain’. The questionnaire was translated into 18 languages. Representatives of the national organisations were responsible for the translation of the questionnaire from English into their local language. 2.3 Analysis Descriptive statistics are presented for all questions of the survey. For continuous variables mean and standard deviation are shown and for categorical data the discrete numbers and percentages are stated. The percentages represent the proportion of respondents giving a valid answer to a particular question, excluding those respondents with invalid answers or for whom the question was not relevant or applicable.

3
3. RESULTS 3.1 Demographics of the sample
In total 3490 respondents filled in the online survey. Table 1 shows the absolute number of respondents per country and the percentage in the total sample, indicating a large variation between countries with respect to the number of respondents. To guarantee the reliability and validity of the analyses we selected only countries with a sample size of 50 or larger. This means that the first five countries in table 1 were excluded from further analysis.
Table 1. Number and percentages of respondents per country Frequency Percent Serbia 2 0.1 Poland 11 0.3 Flemish 13 0.4 Greek 41 1.2 Romania 48 1.4 Italy 50 1.4 Malta 65 1.9 Denmark 79 2.3 German 158 4.5 Norway 176 5.0 Portugal 181 5.2 Sweden 230 6.6 Spain 316 9.1 Finland 333 9.5 French 457 13.1 Netherlands 594 17.0 UK 736 21.1 Total 3490 100
Overall, mostly female respondents filled in the questionnaire. Figure 1 shows that this distribution varied from the lowest percentage in Malta (70%) to the highest percentage in Portugal (98%). In most countries respondents were between 36 and 50 years or between 51 and 65 years of age (figure 2). In Italy and the UK the percentage of respondents in younger age categories (younger than 35) was relatively higher, whereas in Portugal and Spain respondents were more often older.

4
Figure 1. Percentage male/female respondents Figure 2. Age of respondents In many countries the most frequently reported underlying condition for chronic pain was fibromyalgia (average about 40%). Other problems frequently mentioned were of musculoskeletal origin such as osteoarthrosis, arthritis or rheumatism (6%), low back pain (6%) and genetically predisposed hypermobility (11%). In addition, there was a relatively large variety in the frequency of reporting on a particular condition between countries: e.g. in Italy, 46% respondents indicated that a gynaecological problem was the underlying cause for chronic pain while in other countries this was rarely mentioned. This can be explained by the sample method and possible selection bias: i.e. the surveys were distributed by organisations dealing with particular conditions. Figure 3 shows that the majority of the respondents also had other health conditions for which they were being treated. The highest and lowest percentage of reported comorbidities was respectively in Germany (85%) and Denmark (55%).
Figure 3. other health conditions (co-morbidities) Figure 4. How long was it between your first visit to a healthcare professional about your condition and getting a
diagnosis?
3.2 Duration and intensity of pain The time between the first visit of a respondent to a healthcare professional and the moment of the actual diagnosis varies between countries (figure 4). Respondents from Sweden and Germany report longer time periods (4 to 6 years, 7 to 10 years, over 10 years) before they are adequately diagnosed. Overall, about 29% of the respondents received a diagnosis within one year. About 68% of the respondents had to wait longer than one year and 3% have not received a diagnosis (yet).

5
Table 2. Time of diagnosis in total sample Frequency Percent
less than 6 months 554 16.4 7 months to 1 year 434 12.9 1-3 years 754 22.3 4-6 years 470 13.9 7-10 years 361 10.7 over 10 years 707 20.9 no diagnosis 95 2.8
Total 3375 100.0
Figure 5. How long has your pain lasted? In line with the time period between first visit and time of diagnosis, respondents reported a relatively long period over which they experienced pain i.e. the majority of respondents reported suffering from pain for 7 years or more. This was especially the case in Portugal, Spain, Norway and Germany whereas respondents from Malta, Italy and France reported having a shorter time period of pain. What was the perceived level of daily pain of the respondents? Respondents were asked to rate their average daily pain level on a 10-point scale with “10” being the worst possible pain. Figure 6 shows the boxplots for each country. Each boxplot presents the distribution of the scores on this question. The median score for most countries is 7. Respondents from Spain, Malta and France reported the higher pain levels: 8.0, 8.1 and 7.5 respectively. In Portugal large variation in pain scores between respondents was found: between 2 and 10 with a larger standard deviation of 1.9. In contrast, Germany showed little variation between respondents: 6 and 9 with a standard deviation of 1.3.
Figure 6. Average pain score of respondents
3.3 Health services use by respondents This section addresses the health care services that were delivered to respondents and their related experience. Treatment of pain was provided by a general practitioner (GP) or family doctor (38%) in the setting of a local health care centre (11%) or private hospital (9%). Whereas dedicated pain clinic services were provided in local hospital (14%) or university hospital (7%) settings.

6
What was the duration of treatment by the family doctor or GP? Table 4. Duration of treatment by family doctor
Percent 1-3 months 25,8 4-6 months 16,0 7-12 months 14,5 13-18 months 7,9 19-24 months 7,8 25-36 months (2-3 years) 6,1 37 or more (longer than 3 years) 21,9
Figure 7. If yes, how many months were you treated by your
family doctor, before you were referred to special care/pain clinic?
Table 4 and figure 7 show respectively for the total sample and per country how many months’ respondents were treated by their GP before they were referred to special care or a pain clinic. Especially in Germany a relatively large group of respondents were treated for longer than 3 years (39%). Whereas in the Netherlands, Malta and Italy respondents were treated by their GP for a shorter period of time. The group of respondents that were treated by their GP 1 to 3 months was respectively 38%, 42% and 50% in these countries. Did family doctors refer respondents for additional therapy? Table 5. Referral to additional therapy in total sample
Yes, I was offered this and I have been in additional therapy
47,0%
Yes, I was offered this but due to my own personal issues I have not accepted this offer
3,9%
Yes, I was offered this but the hospital/physical centre hasn't accepted me as a patient
3,8%
No, I haven't been offered this 35,8%
Figure 8. Has your family doctor referred you to additional
therapy? Table 5 and figure 8 show how many respondents have been offered additional therapy and whether they also accepted this offer and were provided with these services. Analyses on the total sample show that 47% of the respondents were offered additional therapy and to what extend they made use of this.

7
Denmark, Finland and the Netherlands show a large percentage of respondents answering ‘yes, I was offered additional therapy and I have made use of this’: the blue bars show respectively 83%, 74% and 69%. Respondents in Portugal and Spain often reported not having been offered additional therapy, indicated by purple bars: respectively 73% and 66%. How often respondents visited a pain clinic? Table 6. Frequency of visits to the pain clinic
N visits Frequency Percent 1-2 547 33,1
3-5 418 25,3
6-10 278 16,8
11 or more 410 24,8
Total 1653 100,0
Figure 9. How many visits you had at the pain clinic?
Table 6 show that about 33% of the respondents visiting the pain clinic once or twice. About 25% of the respondents three to five times, 17% six to ten times and another 25% had 11 or more visits. In Denmark, Sweden and the Netherlands, a higher percentage of respondents reported having had 11 or more visits to a pain clinic (figure 9.). When did the respondents receive additional therapy? Table 7. Last time receiving additional therapy in total sample
Frequency Percent I'm in additional therapy at the moment
456 27.6
1-6 months 377 22.8 7-12 months 191 11.6 13-24 months 187 11.3 25-36 months 116 7.0 Over 3 years ago 323 19.6 Total 1650 100.0 Figure 10. Proportion additional therapy per country.
Table 7 show that about 28% of the respondents reported they were still receiving additional therapy and approximately 27% had received additional therapy until six months ago. A relatively large group (19.6%) had had their last additional therapy more than 3 years ago. Finland had the largest and Sweden the smallest population currently receiving additional therapy, while the respondents of Italy were the largest group reporting having current additional therapy or having been treated in the last 6 months (figure 10.).

8
How often have respondents received additional therapy?
Table 7. Frequency of additional therapy in total sample
Frequency Percent more often than once a week
128 11.9
once a week 156 14.5 26-51 times per year
72 6.7
13-25 times per year
94 8.7
6-12 times per year 232 21.5 1-5 times per year 396 36.7 Total 1737 100.0 Figure 11. Frequency of additional therapy in the
12 countries About a third of the respondents received additional therapy on a weekly basis but also more than a third of the respondents received fewer than one additional treatment every two months on average (table 7). Figure 11 presents the variation between countries with respect to the frequency of additional therapy. The red bars indicating that respondents of Sweden, Spain and UK received treatment only 1 to 5 times a year is relatively large: 43%, 46% and 49% respectively. In Italy the provision of additional therapy is higher: 80% of the respondents receives additional therapy at least once a week or more often. What was the satisfaction with the treatment received? Respondents were asked to what extent the treatment they received matched their expectations. The majority of the respondents report that the treatment was not as good as they expected (green bar in figure 12). Analyses over the total sample showed that 78% of the respondents who received treatment expressed that their treatment was not as good as they expected. Especially in Spain there was a large number of respondents where the treatment did not meet their expectations.
Figure 12. Percentage respondents agreeing that their treatment matched their expectations

9
3.4 Patient involvement Next to the use of health care services, respondents were asked to what extent they were involved in any form of support for their condition and to what extent they found this support helpful. Attending pain management group in local health care centre or hospital Of the total sample, 823 respondents (43%) attended a local health care centre’s or hospital’s pain management group: ‘yes’ categories in figure 13a. About 25.6% who attended a pain management group found this really helpful. About 20% of the respondents did not attend since the group was too far away and another 21.9% were not interested.
Figure 13a. Attending pain management group in local health care centre or hospital in total sample
Figure 13b. Attending pain management group in local health care centre or hospital in the 12 countries
The next figure shows the distribution for each of these answer categories per country. Respondents from Norway reported more often report that they were not interested in attending a patient management group (47%) while in Italy a large group of respondents indicated that such a support group was too far away (45%). In Malta and Denmark high percentages of respondents reported that attending a patient group was really helpful for them: 43% and 49% respectively. Attending pain group meetings Overall, 31% of the respondents attended patient group meetings and found them helpful. Half of the respondents from Norway reported that they have not attended any patient group meeting as they were not interested. On the contrary, respondents from Spain and Malta often did attend these meetings and found them really helpful: 54% and 50% respectively.

10
Figure 14a. Attending pain group meetings in total sample
Figure 14b. Attending pain group meetings in 12 countries
Participating in a patient association’s forum on the web Respondents from Spain, Italy and Germany expressed that participating in a patient’s association’s web forum was really helpful: 75%, 88% and 76% respectively. Whereas respondents from Portugal often reported (48%) ‘No, I haven’t as I’m not interested in this’. Analyses over the total sample showed that 55% found participating in a patient association’s forum on the web helpful. Twenty percent of the respondents said that participation on a web forum was not for them and 25% reported that they did not participate in this as they were not interested in it.
Figure 15. Participating in a patient association’s forum on the web
3.5 Relevance of future research The last part of the survey addressed questions related to respondents willingness to participate in a future survey and what they considered to be the relevance of contributing to research on the impact of pain. To the question whether this all-European survey would achieve more visibility for chronic pain, about 60% of the respondents answered positively with a ‘yes’. The remaining third part pf the respondents indicated that they just do not know whether this survey will help politicians and

11
decision-makers to acknowledge the societal impact of chronic pain. The majority of the respondents wanted to receive the results of the questionnaire, were willing to participate in future surveys and asked to receive the PAE newsletter to keep them updated on the impact of chronic pain in Europe. Table 3. Relevance of future research (total sample) Yes No Don’t know Do you think this kind of all-European survey would get more visibility for chronic pain?
62% 7.8% 30.2%
Do you thing this survey will help politicians and decision-makers to see the large scale problem of chronic pain?
46.5% 21.3% 32.2%
Do you want to receive the results of this questionnaire?
72.2% 27.8%
Do you want to receive the Pain Alliance Europe newsletter?
51.8% 48.2%
Do you want to participate in future questionnaires? 70.1% 29.9%
4. CONCLUSION These exploratory results suggest a significant impact of chronic pain for European citizens. Considering the results on how long respondents had to wait to get a diagnosis, the period over which they experienced pain, how long they received treatment from their family doctor and the duration and frequency of additional therapy we can conclude that these findings indicate a treatment gap in many countries in Europe. This may especially be due to a lack of early diagnosis and timely intervention. Additionally, respondents themselves indicate that treatment did not match their expectations. Therefore, also more insight is needed in patients’ needs and preferences with respect to their treatment. To gain a better understanding into the underlying mechanisms behind these findings and relate these to the different health care systems at place in these European countries a more extensive research is needed It is an encouragement for PAE to continue this research, improving the relevance of the questions and adapting the survey following the feedback received from the respondents, and thus bringing their contribution to the improvement of the quality of life of pain patients.

12
APPENDIX 1. ADDITIONAL FIGURES
Figure 16. Usefulness of survey for visibility for chronic pain in the 12 countries
Figure 17. Usefulness of survey for politicians and decision-makers in the 12 countries
Figure 19. Do you want to receive the results of this questionnaire?
Figure 20. Do you want to receive the Pain Alliance Europe newsletter?
Figure 21. Do you want to participate in future questionnaires?
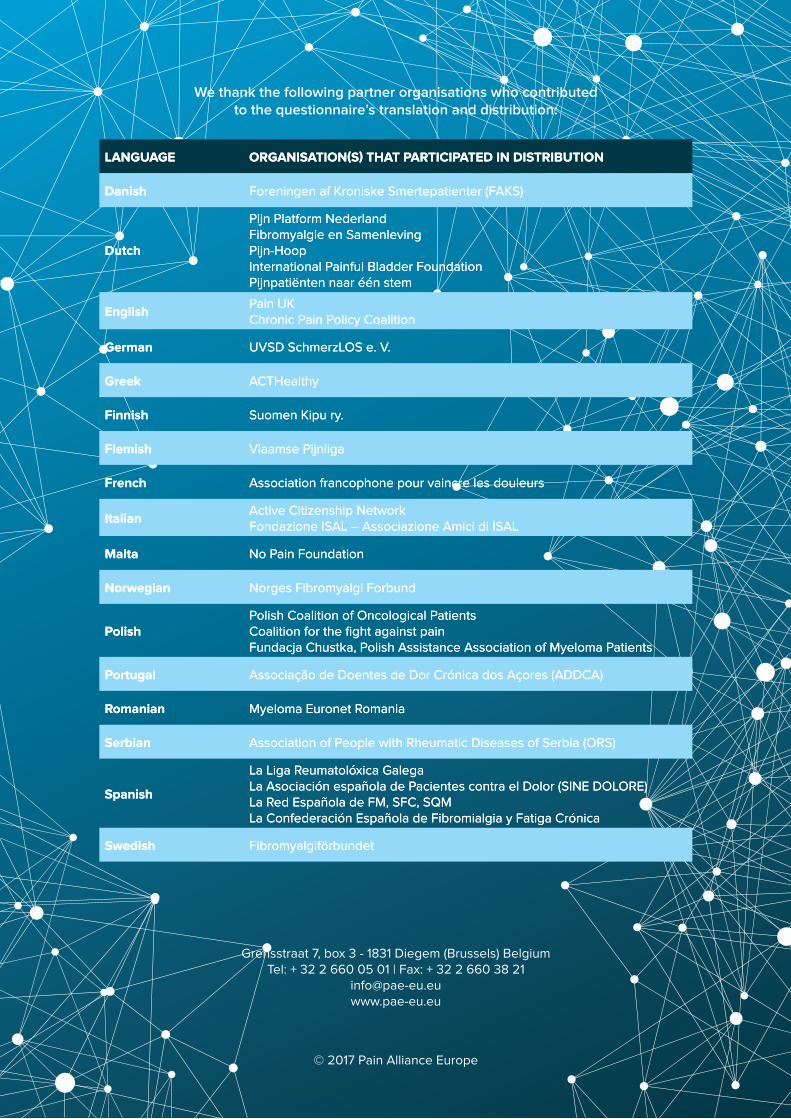
We thank the following partner organisations who contributedto the questionnaire’s translation and distribution:
LANGUAGE ORGANISATION(S) THAT PARTICIPATED IN DISTRIBUTION
Danish Foreningen af Kroniske Smertepatienter (FAKS)
Dutch
Pijn Platform NederlandFibromyalgie en SamenlevingPijn-HoopInternational Painful Bladder FoundationPijnpatiënten naar één stem
EnglishPain UKChronic Pain Policy Coalition
German UVSD SchmerzLOS e. V.
Greek ACTHealthy
Finnish Suomen Kipu ry.
Flemish Vlaamse Pijnliga
French Association francophone pour vaincre les douleurs
ItalianActive Citizenship NetworkFondazione ISAL – Associazione Amici di ISAL
Malta No Pain Foundation
Norwegian Norges Fibromyalgi Forbund
PolishPolish Coalition of Oncological PatientsCoalition for the fight against painFundacja Chustka, Polish Assistance Association of Myeloma Patients
Portugal Associação de Doentes de Dor Crónica dos Açores (ADDCA)
Romanian Myeloma Euronet Romania
Serbian Association of People with Rheumatic Diseases of Serbia (ORS)
Spanish
La Liga Reumatolóxica GalegaLa Asociación española de Pacientes contra el Dolor (SINE DOLORE)La Red Española de FM, SFC, SQMLa Confederación Española de Fibromialgia y Fatiga Crónica
Swedish Fibromyalgiförbundet
© 2017 Pain Alliance Europe
Grensstraat 7, box 3 - 1831 Diegem (Brussels) BelgiumTel: + 32 2 660 05 01 | Fax: + 32 2 660 38 21