ncomm ncml commodity market monitor · date: 26-09-2017 ncml commodity market monitor price drivers...
TRANSCRIPT

Date: 26-09-2017
NCML Commodity Market Monitor
HOME
NCoMM
NCML COMMODITY MARKET MONITOR
Cotton | Sugar | Soybean | RM Seed | Castor seed | Turmeric | Jeera | Pepper
OUTLOOK
OTHER DATA Sowing progress | Monsoon Situation | Advance estimates | Kharif MSP
WEEKLY ONLINE QUIZ
Click on the link to participate
Participate in our weekly quiz and get a chance to win Amazon gift coupons. Winners will be announced in next report and rewarded.

Date: 26-09-2017
NCML Commodity Market Monitor
Fundamentals- Domestic & International
Price Trend & Technicals
14000
16000
18000
20000
22000
24000
No
v-15
De
c-15
Feb
-16
Ap
r-16
Jun
-16
Au
g-1
6
Oct
-16
De
c-16
Jan
-17
Mar
-17
May
-17
Jul-1
7
Se
p-1
7
Cotton - 29 mm - Rajkot
COTTON
As expected, the cotton prices after trading in a thin range for a
prolonged period of time finally lost support and slipped sharply on
expectation of higher production and record high imports this year.
For the coming days we expect prices to continue trading under
pressure and move closer to the important support mark of Rs
18550. Expected rise in export demand will lend some support to the
prices around those levels. On the other side immediate resistance
can be seen around Rs 19800 odd levels but considering the current
negative momentum the chances of prices testing the resistance
level in looking highly unlikely.
IMPORTANT LEVELS
S2 S1 CMP R1 R2
18170 18550 19246.9 19800 20300
Outlook: Prices will continue to trade under pressure and will move closer to Rs 18550 mark.
• Other cotton producers like Brazil and Australia may find it difficult to match the price offered by India, where a bumper harvest is likely. The
government has fixed cotton production target at 35.5 million bales (170 kg each) for 2017-18. ICRA has projected India to produce 36 million bales
of cotton in 2017-18. As per government’s 4th advance estimates, India’s 2016-17 cotton production stood at 33.09 million bales in 2016/17.
• As on 22nd September 2017, the area sown under cotton has reached to 121.56 lakh hectares, which is 18.68% higher than 102.56 lakh hectares sown
last year till date and 5.95% higher than normal till date. Farmers have shifted to cotton from various crops across states due to higher realisation
last year.
• Cotton producing under-irrigated belt of Vidarbha and Eastern Madhya Pradesh has received below average rainfall, posing a threat to farmers
who have increased planting of the fibre on the back of a surge in demand. But the rainfall here has been forecasted to show recovery.
• India’s cotton imports, estimated at an all-time high of 30 lakh bales in 2016-17 against 20 lakh bales in 2015-16 are likely to fall in the coming season.
• According to the latest report by ICAC, world’s cotton area is likely to increase by 9% to 31.9 million hectares in 2017-18. Global cotton production to
rise by 9% from 23.07 million tonnes in 2016-17 to 25.14 million tonnes in 2017-18. Wherein, China, and Pakistan are projected to produce 5.2 million
tonnes (7% higher y-o-y) and 2 million tonnes (17% higher y-o-y) of cotton respectively.
• Although production forecast for the United States was 4.5 million tonnes, a rise of 20%, the impact of the recent hurricanes, Harvey & Irma, is yet
to be fully assessed as per ICAC. It now appears that there had been significant damage to US crop which will be incorporated in next estimates.
• Overall score of 2.9 shows consolidation to mild bearishness in cotton prices.
Fundamental Summary
Price Drivers Impact Weightage Score (1-5)*
Rise in export demand due to countries buying cotton from India post hurricane damage in US
Bullish 15% 4
Significantly higher cotton area sown Bearish 25% 2
Higher production estimate Bearish 20% 2
Inadequate rainfall in cotton belt of Vidarbha and MP Bullish 20% 4
Comfortable stocks Consolidation 20% 3
Overall fundamental score 2.9
*Bearish; 2. Marginal Bearish; 3. Consolidation; 4. Marginal Bullish; 5.Bullish
• World’s top cotton buyers, all in Asia, have turned to India, the second-
biggest cotton exporter, for supplies after fierce storms in the United States,
the biggest exporter of the fibre, affected the size and quality of the crop.
• India sealed deals to sell about a million bales to China, Taiwan, Vietnam,
Pakistan, Bangladesh & Indonesia in 2nd week of Sep compared with
300,000 bales in the two weeks before.
• Dealers expect similar contracts in the coming months. These could help
raise India’s exports, which in 2016-17 declined to 6 million bales from 7.2
million bales in 2015-16. Favourable crop conditions would help India sell 7.5
million bales of cotton in the world market in 2017/18 season starting in Oct.
BACK TO TOP
Mandi Price in Rs/ Qtl.
22-09-2017 15-09-2017 %Change
Akola (29 mm) 10818 11380 -4.94
Rajkot (29 mm) 11240 11485 -2.13
Abohar (28 mm) 9925 10210 -2.79

Date: 26-09-2017
NCML Commodity Market Monitor
Price Trend & Technicals
With expectations of higher production this year, higher acreage,
imposition of stock limits and allowing of concessional imports of
the government in efforts to check sugar prices have somewhat
shown impact on the prices. However the technical undertone in
the prices is still positive but any sharp spike in prices from here on
looks unlikely to happen. Prices have recently shown some pull back
and a breach of Rs 3680 anytime soon will result in generation of
fresh selling pressure. The prices can slip then towards Rs 3630
mark. Till then mild recovery will continue till the time the level of
Rs 3680 is not breached convincingly.
IMPORTANT LEVELS
• On 7 September, government allowed import of 0.3 mn tonnes of raw sugar at
southern ports at concessional duty of 25% to augment supplies. These were
permitted on top of 0.5 mn tonnes of duty free imports allowed in April.
• However according to ICRA, the small quantum of additional supplies is unlikely
to have significant negative impact on the prices in the near-term. Additionally, a
significant portion import quota is being surrendered as imports are unviable
and the deadline not practical
• On 29 August the government imposed stock limits on sugar. The mills can hold
21% of their output in stocks by the end of Sep, & bring down stock level to 8% of
output by the end of Oct. The govt also asked the states to start crushing early.
Mandi Price in Rs/ Quintal
22-09-2017
15-09-2017
%Change
Muzzafarnagar 3733.35 3716.25 0.46
Kolhapur 3665.2 3692.05 -0.73
Delhi 3804.5 3790.25 0.38
• India’s 2016-17 sugar production was 20.3 mn tonnes against 25.1 mn tonnes last year, creating concerns of shortage. According to ICRA, India’s
sugar production for 2017-18 is likely to rise 18-20% to around 24–24.5 million tonne. However, the sugar production in south Karnataka and
Tamil Nadu is likely to remain impacted by consecutive seasons of poor rainfall.
• India’s top sugar producing state Maharashtra will begin sugarcane crushing season from 1 Nov, with heavy rains not allowing early crushing.
The state’s sugarcane acreage is expected to recover to over 9 lakh ha compared to the 2016-17 season which recorded substantially low
sugarcane acreage of 6.3 lakh ha against state’s average sugarcane acreage of 1 million ha. Maharashtra’s sugar output in the 2017-18 is
expected to rise 75% from a year ago to 7.34 million tonnes.
• Sugar mills in UP have decided to begin crushing in October this year, a month ahead of schedule, to boost supply of sugar. Sugar production
in Uttar Pradesh is set to reach 10.3 mn tonnes in 2017/18, up from 8.77 mn tonnes a year ago
• High demand by stockists and bulk consumers to meet festive demand is keeping the sugar season prices firm currently. According to traders,
sugar stocks, which opened at 7 million tonnes, are expected to be driven down to 2 mn tonnes at October-end after Diwali.
• The sugarcane acreage has seen a rise of 9.44%. As on 22nd September 2017, sugarcane was sown in 49.95 lakh hectares against 45.64 lakh
hectares last year till the date.
• The global sugar production in 2017-18 is expected to climb by nearly 7% to a record 179.3 million tonnes. International sugar futures have been
under pressure as the European Union inches closer to liberalising its sugar quotas on October 1 and boosting production sharply.
• Overall fundamental score of 3.2 shows consolidation with bullish undertone.
BACK TO TOP
S2 S1 CMP R1 R2
3625 3675 3731 3825 3900
Outlook: Mild recovery can be seen till the time prices are trading above Rs 3680 mark.
2,100
2,400
2,700
3,000
3,300
3,600
3,900
De
c-13
Ap
r-14
Au
g-1
4
De
c-14
May
-15
Se
p-1
5
Jan
-16
May
-16
Se
p-1
6
Jan
-17
May
-17
Se
p-1
7
Sugar - M-grade : Muzaffarnagar
Fundamental Summary
Price Drivers Impact Weightage Score (1-5) *
Imposition of 21% stock limit by Sep end and 8% by October Bearish 10% 2
High domestic demand due to festive season Bullish 30% 4
Lower 2016-17 ending stocks season due to lower 2016-17 production Bullish 30% 4
Well progressed sowing of sugarcane for 2017-18 season and higher production oulook of sugar for 2017-18
Bearish 25% 2
Concessional imports of 0.3 million tonnes allowed at Southern p0rts Bearish 5% 2
Overall fundamental score 3.2
*Bearish; 2. Marginal Bearish; 3. Consolidation; 4. Marginal Bullish; 5. Bullish
Fundamentals- Domestic & International
Mandi Price in Rs/ Quintal
02-06-2017 26-05-2017 %Change
Muzzafarnagar 3915 3892.5 0.58
Kolhapur 3837 3847.5 -0.27
Delhi 3932.55 3920 0.32
Fundamentals- Domestic & International
SUGAR
Date: 26-09-2017
NCML Commodity Market Monitor
x
Price Trend &Technicals
13000
14000
15000
16000
17000
18000
19000
20000
Feb
-16
Ap
r-16
Jun
-16
Au
g-1
6
Oct
-16
No
v-16
Jan
-17
Mar
-17
May
-17
Jul-1
7
Se
p-1
7
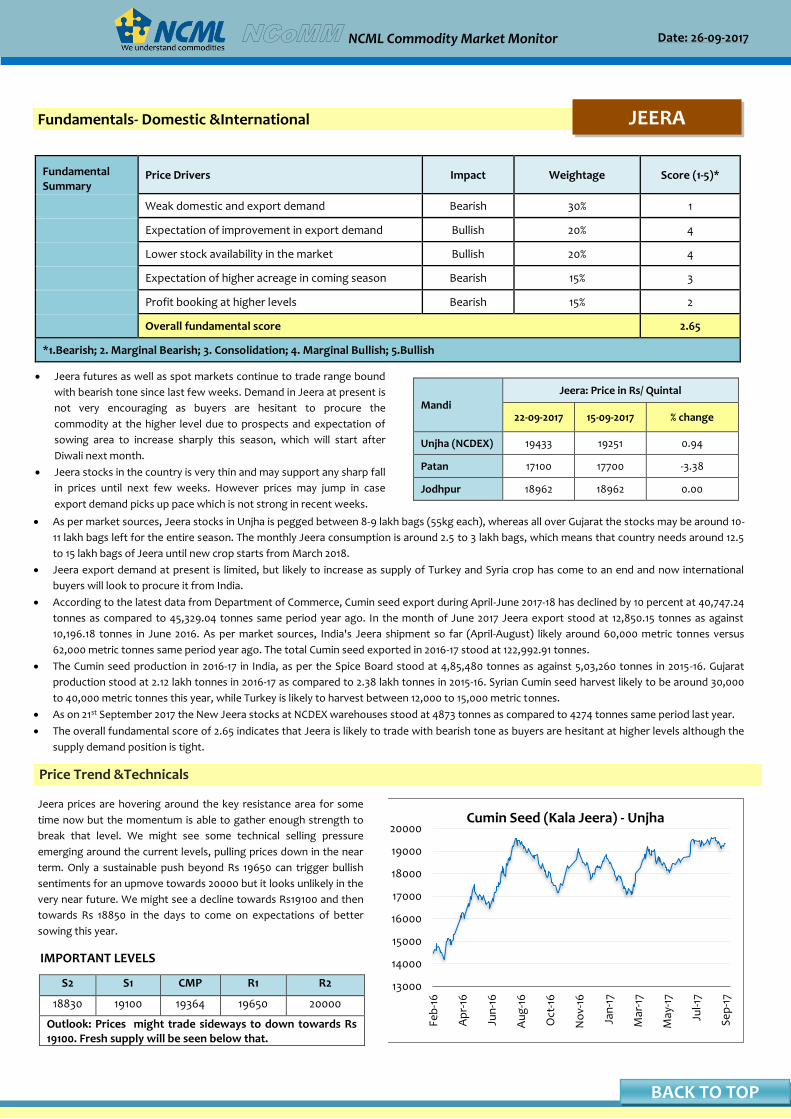
Cumin Seed (Kala Jeera) - UnjhaJeera prices are hovering around the key resistance area for some
time now but the momentum is able to gather enough strength to
break that level. We might see some technical selling pressure
emerging around the current levels, pulling prices down in the near
term. Only a sustainable push beyond Rs 19650 can trigger bullish
sentiments for an upmove towards 20000 but it looks unlikely in the
very near future. We might see a decline towards Rs19100 and then
towards Rs 18850 in the days to come on expectations of better
sowing this year.
IMPORTANT LEVELS
S2 S1 CMP R1 R2
18830 19100 19364 19650 20000
Outlook: Prices might trade sideways to down towards Rs 19100. Fresh supply will be seen below that.
• Jeera futures as well as spot markets continue to trade range bound
with bearish tone since last few weeks. Demand in Jeera at present is
not very encouraging as buyers are hesitant to procure the
commodity at the higher level due to prospects and expectation of
sowing area to increase sharply this season, which will start after
Diwali next month.
• Jeera stocks in the country is very thin and may support any sharp fall
in prices until next few weeks. However prices may jump in case
export demand picks up pace which is not strong in recent weeks.
Mandi
Jeera: Price in Rs/ Quintal
22-09-2017 15-09-2017 % change
Unjha (NCDEX) 19433 19251 0.94
Patan 17100 17700 -3.38
Jodhpur 18962 18962 0.00
• As per market sources, Jeera stocks in Unjha is pegged between 8-9 lakh bags (55kg each), whereas all over Gujarat the stocks may be around 10-
11 lakh bags left for the entire season. The monthly Jeera consumption is around 2.5 to 3 lakh bags, which means that country needs around 12.5
to 15 lakh bags of Jeera until new crop starts from March 2018.
• Jeera export demand at present is limited, but likely to increase as supply of Turkey and Syria crop has come to an end and now international
buyers will look to procure it from India.
• According to the latest data from Department of Commerce, Cumin seed export during April-June 2017-18 has declined by 10 percent at 40,747.24
tonnes as compared to 45,329.04 tonnes same period year ago. In the month of June 2017 Jeera export stood at 12,850.15 tonnes as against
10,196.18 tonnes in June 2016. As per market sources, India's Jeera shipment so far (April-August) likely around 60,000 metric tonnes versus
62,000 metric tonnes same period year ago. The total Cumin seed exported in 2016-17 stood at 122,992.91 tonnes.
• The Cumin seed production in 2016-17 in India, as per the Spice Board stood at 4,85,480 tonnes as against 5,03,260 tonnes in 2015-16. Gujarat
production stood at 2.12 lakh tonnes in 2016-17 as compared to 2.38 lakh tonnes in 2015-16. Syrian Cumin seed harvest likely to be around 30,000
to 40,000 metric tonnes this year, while Turkey is likely to harvest between 12,000 to 15,000 metric tonnes.
• As on 21st September 2017 the New Jeera stocks at NCDEX warehouses stood at 4873 tonnes as compared to 4274 tonnes same period last year.
• The overall fundamental score of 2.65 indicates that Jeera is likely to trade with bearish tone as buyers are hesitant at higher levels although the
supply demand position is tight.
Fundamental Summary
Price Drivers Impact Weightage Score (1-5)*
Weak domestic and export demand Bearish 30% 1
Expectation of improvement in export demand Bullish 20% 4
Lower stock availability in the market Bullish 20% 4
Expectation of higher acreage in coming season Bearish 15% 3
Profit booking at higher levels Bearish 15% 2
Overall fundamental score 2.65
*1.Bearish; 2. Marginal Bearish; 3. Consolidation; 4. Marginal Bullish; 5.Bullish
Fundamentals- Domestic &International JEERA
BACK TO TOP

Date: 26-09-2017
NCML Commodity Market Monitor
Price Trend & Technicals
2700
2930
3160
3390
3620
3850
4080
4310
Jan
-15
Ap
r-15
Jul-1
5
Oct
-15
Feb
-16
May
-16
Au
g-1
6
No
v-16
Mar
-17
Jun
-17
Se
p-1
7
Soybean : IndoreWith the commencement of new crop arrival the prices are expected
to witness some supply pressure as the arrivals starts to pick up. With
sufficient availability of the old seed any rise in prices in the near
future is unexpected. On a slip below 3050 we can see some more
pressure on the prices pulling it down further towards Rs 2930.
Rs 2930 is a strong support level and a probable short term floor of to
the soybean prices. Only a sustainable crack of it will pressurize the
prices further. Rs 3155 is the important resistance level and only a
crack of it will make soybean prices strong towards Rs3225.
IMPORTANT LEVELS
S2 S1 CMP R1 R2
2930 3050 3101 3155 3225
Outlook: Prices will slip towards Rs 2930 on successful breach of Rs 3050.
• According to the latest sowing report, soybean sowing acreage for 2017-18 is
recorded at 105.91 lakh hectares which is 7.68 per cent lower than last year’s
acreage of 114.72 lakh hectares at the same period. Lower sowing acreage report
may lend some support to the prices.
• Soybean planting is almost over and early sown crop has started hitting the
mandis of Rajasthan and Madhya Pradesh in small amounts. With the even spread
of rainfall in the second half of the current monsoon season raising prospects of
better kharif oilseed output. Arrivals of new crop are in the range of 1000-2000
bags and the moisture level is higher than normal. New crop arrivals may continue
to put downward pressure on the domestic prices.
Mandi Price in Rs/ Quintal
22-09-2017 15-09-2017 % change
Indore 3091 3065 0.85
Kota 2850 2856.25 -0.22
Nagpur 3161.3 3151.2 0.32
• Market participant are estimating a carryover stock of 1.5-2 million tonnes of soybean, based on the crop size of 11.5 million tonnes in 2016-17.
Higher carryover stock may help the crushing industry with availability of seeds, thereby containing a possible bullish price trend. However, higher
carryover stock will not let prices to move northward.
• India’s soymeal exports in the month of August 2017 were 81.079 thousand MT, higher by around 1 per cent as against of 80.797 thousand MT in
July 2017. Average Fob price of soybean meal in the month of August was $398 per tonnes against $391 per tonnes in the month of July. While the
global average price for soya de-oiled cake is $350 per tonne, Indian prices are prevailing at near $400 per tonne, making it unviable for most of the
crushers to sell internationally.
• The government’s decision to raise import duty early August, both edible oilseeds and oils have become a little costlier, mak ing soybean crushing
profitable. The duty on crude and refined oil was raised to 15 per cent and 25 per cent, respectively, from the earlier 7.5 per cent and 15 per cent.
• As per latest USDA weekly weather report, forty-one percent of this year’s soybean crop was at or beyond the leaf dropping stage by September
17, two percentage points behind both last year and the 5-year average. By week’s end, 4 percent of the soybean crop was harvested, equal to last
year but slightly behind the 5-year average. Overall, 59 percent of the soybean crop was reported in good to excellent condition, down slightly from
last week and 14 percentage points below the same time last year.
• The overall fundamental score of 2.9 shows range bound to slightly bearish movement in the coming days.
•
•
Fundamental Summary
Price Drivers Impact Weightage Score (1-5) *
Lower sowing area coverage Bullish 25% 4
Arrivals of new crop Bearish 15% 2
Higher carryover stock Bearish 20% 2
Lower export meal demand Bearish 20% 2
Higher import duty Bullish 20% 4
Overall fundamental score 2.9
*1-1.95: Bearish; 2-2.95: Marginal Bearish; 3: Consolidation; 3.05-3.95 Marginal Bullish; 4-5.Bullish
Fundamentals- Domestic & International SOYA BEAN
BACK TO TOP

Date: 26-09-2017
NCML Commodity Market Monitor
Price Trend &Technicals
3,500
3,750
4,000
4,250
4,500
4,750
5,000
5,250
Jun
-15
Au
g-1
5
Oct
-15
De
c-15
Feb
-16
Ap
r-16
Jun
-16
Au
g-1
6
No
v-16
Jan
-17
Mar
-17
May
-17
Jul-1
7
Se
p-1
7
Rapeseed & Mustard-Black - 42% oil content : JaipurWith the arrivals pouring in the prices have shown some correction
despite good seasonal demand. Higher imports and increased
arrivals may continue to put pressure on the prices in the near term.
Recent top of Rs 3987 will act as a short term ceiling to the prices
and for any significant move prices have to surpass that level
convincingly. On the downside Rs 3830 is seen as immediate
support and will act as a hurdle against any further fall beyond that
level. However a breach of Rs 3830 will result in some more fall in
prices towards Rs 3750. We expect prices to show some downtrend
in the coming fortnight.
IMPORTANT LEVELS
S2 S1 CMP R1 R2
3750 3830 3926 3987 4085
Outlook: Prices can see some further correction towards Rs 3830 levels in the next couple of weeks.
• India’s mustard meal exports in the month of August 2017 were 50.64
(provisional) thousand MT, higher by 243.78 per cent against 14.73
thousand MT in July 2017. Average FoB price of meal in August is
recorded at $239/tonne which is slightly higher than average price of
$220/tonne in the month of July. Higher demand may have a marginal
bullish impact on the prices.
Mandi Price in Rs/ Quintal
22-09-2017 15-09-2017 % change
Jaipur 3925 3950 -0.63
Alwar 3870.5 3896.25 -0.66
Sriganga Nagar 3451 3461 -0.29
• As per SEA recent data, mustard oil imports for period Nov-July in current oil year is recorded at 1.94 lakh tonnes which is 23 per cent lower than
last year import of 2.55 lakh tonnes in the same period. Higher domestic production of mustard has made India less dependent on imports.
• Moreover, Government has increased the import duty on both crude and refined edible oil. The duty on crude and refined oil was raised to 15%
and 25 per cent, respectively, from the earlier 7.5% and 15%. Higher import duty may have bullish impact on the domestic prices.
• As per fourth advance production estimate of 2016-17, India’s mustard production is estimated at 7.977 million metric tonne which is 17.36 per
cent higher than last year production estimate of 6.797 million metric tonne. Higher production estimate may have a marginal bearish impact on
the prices.
• Deficit rainfall received in the monsoon may affect the sowing of mustard crop in rabi season. Less monsoon rainfall leads to lower moisture
content in soil and water shortage in reservoirs--the two key factors which guide sowing in rabi season.
• Festive demand of mustard oil in the coming days may push give support to the cash market. However, higher availability of mustard in the
domestic market may not let prices to keep sharp northward movement.
• According to the agmark, all India Mustard crop mandi arrivals in third week of September is around 40.57 thousand tonnes which is 3.14 per cent
higher than second week arrivals of 39.33 thousand tonnes. Moreover, arrivals are higher than as compare to last year. However, higher arrivals
may continue to put downward pressure on the prices.
• The overall fundamental score of 2.9 shows range bound to slightly bearish movement in the coming days.
Fundamental Summary
Price Drivers Impact Weightage Score (1-5)*
Higher meal demand Bullish 10% 4
Higher import duty Bullish 10% 4
Higher arrivals in the mandis (w-o-w) Bearish 35% 2
Higher festive demand Bullish 25% 4
Higher production estimate Bearish 20% 2
Overall fundamental score 2.9
* 1. Bearish; 2. Marginal Bearish; 3. Consolidation; 4. Marginal Bullish; 5.Bullish
Fundamentals- Domestic & International RM SEED
BACK TO TOP

Date: 26-09-2017
NCML Commodity Market Monitor
Fundamentals- Domestic & International
Price Trend &Technicals
2800
3050
3300
3550
3800
4050
4300
4550
4800
Jan
-15
Mar
-15
Jun
-15
Se
p-1
5
No
v-15
Feb
-16
May
-16
Jul-1
6
Oct
-16
Jan
-17
Mar
-17
Jun
-17
Se
p-1
7
Castor - Deesa
CASTOR SEED
Heavy monsoon rains this year have expectedly damaged castor
crop, which are keeping the price sentiments positive. Decline in
the sowing numbers and good international demand for the meal
are all supportive for the prices. Some more upside can be seen in
the coming days pushing prices higher towards the important
resistance of Rs 4705. Fresh strength can be seen emerging only on
a successful invalidation of that level. On the other side a decline
below Rs 4550 may lead exert some more selling pressure on
prices pulling it down towards Rs 4310.
IMPORTANT LEVELS
S2 S1 CMP R1 R2
4310 4550 4625 4705 4775
Outlook: Prices will trade with sideways to downward bias till Rs 4705 level is not breached.
• According to the latest sowing report, kharif castor sowing acreage for
2017-18 is recorded at 8.17 lakh hectares which is 2.62 per cent lower
than the 8.39 lakh hectares in the same corresponding period last year.
Lower sowing acreage may have slightly bullish impact on the prices.
• According to the market participants, farmers are still holding castor
crop in expectation of getting higher prices in the coming months.
Farmers may not bring castor crop at lower domestic prices.
Mandi Price in Rs/ Quintal
22-09-2017 15-09-2017 % change
Kadi 4525 4550 -0.55
Rajkot 4200 4250 -1.18
Deesa 4643.9 4685.45 -0.89
• According to the traders of Gujarat, area of castor in Gujarat for 2017-18 may be equal or slightly higher than last year. However, as castor crop is
sown late this year as compared to normal sowing time, this may affect the yield of the crop. So, they are expecting same production of castor
crop this year as of last year.
• India’s castor meal exports in the month of August were 1.132 thousand MT, lower by 77.95 per cent against 5.134 thousand MT in July 2017.
India’s castor meal exports in the period April-August 2017-18 were 1.56 lakh MT as against 1.79 Lakh MT during the same period in 2015-16. Lower
export demand may have marginally bearish impact on the domestic prices.
• India’s castor oil export in the month of May is recorded at 43.97 thousand MT which is 20.84 percent lower than export of 55.55 thousand MT
of April 2017. Lower export demand may have marginal bullish impact on the prices.
• According to the government’s fourth advance estimate, Castor seed production is estimated at 14.21 lakh metric tonne for 2016-17 which is
18.89 per cent lower than the final production estimate of 17.52 lakh metric tonne of 2015-16. Moreover, according to SEA, all India castor seed
production is estimated at 10.61 Lakh MT for 2016-17 which is 25.43 per cent lower than last year production estimate of 14.23 Lakh metric
tonnes. Lower production estimate might have bullish impact on the prices.
• Overall score of 3.2 shows range bound to slightly firm movement in the coming days.
Fundamental Summary
Price Drivers Impact Weightage Score (1-5)*
Lower sowing area coverage Bullish 25% 4
Holding of stock with farmers Bullish 15% 4
Lower meal demand Bearish 20% 2
Lower oil demand Bearish 20% 2
Lower production estimate Bullish 20% 4
Overall fundamental score 3.2
*Bearish; 2. Marginal Bearish; 3. Consolidation; 4. Marginal Bullish; 5.Bullish
BACK TO TOP

Date: 26-09-2017
NCML Commodity Market Monitor
Price Trend &Technicals
4800
5500
6200
6900
7600
8300
9000
9700
Jun
-14
Oct
-14
Feb
-15
Jun
-15
Oct
-15
Feb
-16
Jun
-16
Se
p-1
6
Jan
-17
May
-17
Se
p-1
7
Turmeric : Unpolished fingers : Nizamabad
After rising sharply over the past few weeks the positive
momentum in the prices have started to show some signs of
fizzling out. However the undertone is still strong and prices may
resume its rising streak after a brief phase of consolidation. On a
breach of the key resistance of Rs 7770 prices will expectedly see
fresh buying in the spice pushing it towards Rs 8270. Any sharp
correction from here can take place only if the sentiments
strengthen towards the expectation of higher yield. Major
supports is seen standing at Rs 7200 towards which the prices can
slip on a breach of Rs 7360.
IMPORTANT LEVELS
S2 S1 CMP R1 R2
7200 7360 7600 7760 8270
Outlook: Prices will moderate and move closer to Rs 7360.
Fundamentals- Domestic & International TURMERIC
• Turmeric markets remained weak tracking subdued demand. As per
Nizamabad traders business activities are dull in the market despite of
festival season as Turmeric is used worldwide during this period in various
religious rituals. Buyers are hesitant to make any bulk deals in Turmeric
due to uncertainty about liquidation of stocks with APmarkfed. Andhra
Pradesh market federation procured around 48,500 metric tonnes.
• According to traders, activity in Erode market reported limited trade inquiries from overseas buyers. Turmeric stocks in Erode is good i.e, around 8-10 lakh bags (70kg each), but not in other trading centres, which is likely to lend support to the Turmeric prices.
Mandi Turmeric: Price in Rs/ Quintal
22-09-2017 15-09-2017 % change
Nizamabad 7600 7674 -0.96
Sangli 7500 7650 -1.96
Jaipur 8500 8550 -0.58
• Turmeric crop prospects has improved after good rainfall in Turmeric growing belts earlier this months, which has prompted buyers to do only
need-based buying. However, downside in the commodity is limited due to lower stocks in the country.
• As per the Telangana Agriculture Department, Turmeric acreage as on 13th September 2017 was reported lower at 0.45 lakh hectares as
compared to 0.46 lakh hectares same period last year. Turmeric acreage improved in Vikarabad, Nizamabad and Warangal districts.
• According to the Department of Agriculture Andhra Pradesh, as on 20th September Turmeric acreage in the state stood at 0.15 lakh hectares as
against 0.14 lakh hectares last year same period.
• Turmeric production for the next season is estimated to be as good as last season with the producing regions in southern India experiencing
good rainfall in the past few weeks. Sowing of the commodity was last seen marginally lower than the preceding year but the higher rainfall is
expected to boost the yield. Turmeric production would be lower in Tamil Nadu, but would be more than compensated from Maharashtra and
Andhra Pradesh as per Trade sources. As per the Spices Board of India, Turmeric production in 2016-17 in the country estimated at 10,51,160
tonnes as against 9,67,060 tonnes in 2015-16.
• According to the lastest data from Department of Commerce, Turmeric exports during April-June 2017-18 stood at 35,360.56 metric tonnes as
against 37,335.01 metric tonnes same period last year. Turmeric exports in the month of June 2017 was 10361.01 tonnes as against 13,215.69
tonnes in June 2016. India exported 125,536.43 metric tonnes in 2016-17.
• With overall fundamental score of 2.8 Turmeric is likely to remain in consolidating mode with slight bearish tone mainly on subdued demand.
Fundamental Summary
Price Drivers Impact Weightage Score (1-5)*
Subdued domestic and export demand Bearish 15% 2
Improved rainfall in Turmeric growing belts Bearish 25% 2
Lower acreage in current season Bullish 20% 4
Profit booking at higher levels Bearish 10% 2
Expectation of higher yield Bearish 10% 2
Tight stock position in markets Bullish 20% 4
Overall fundamental score 2.8
* 1. Bearish; 2. Marginal Bearish; 3. Consolidation; 4. Marginal Bullish; 5.Bullish
BACK TO TOP

Date: 26-09-2017
NCML Commodity Market Monitor
Fundamentals- Domestic & International PEPPER
Price Trend & Technicals
25000
35000
45000
55000
65000
75000
85000
Jan
-12
Jun
-12
De
c-12
Jun
-13
No
v-13
May
-14
No
v-14
May
-15
Oct
-15
Ap
r-16
Oct
-16
Mar
-17
Se
p-1
7
Pepper-Malabar Garbled : Cochin
Pepper prices at continued to trade with bearish sentiments in the
second half of September too. Cheap imports from Vietnam via sri-
lanka and dampened the sentiments strongly in India. Move to ban
imports from Vietnam can lend some support to the prices in the
days ahead. Considering the current momentum prices are
expected to stretch its declining streak in the near future and move
closer to Rs 43200, which is a strong support level and can
potentially halt further declines in the prices. Rs 48300 will act as a
near term resistance and will prevent any significant gains. Near
term outlook in pepper remains to be gloomy.
IMPORTANT LEVELS
S2 S1 CMP R1 R2
40800 43130 46180 49800 52500
Outlook: Will slip towards Rs 43200 mark.
• The Spice Board has recommended a ban on the imports over quality
concerns, months after cheap pepper imports from Vietnam routed
through Sri Lanka came under the scanner of Food Safety and Standards
Authority of India (FSSAI) for suspected contamination.
• The development comes at a time when cheap imports have brought
down the pepper price to Rs 400 a kg, from Rs 650 a kg about a year ago.
Imported pepper has been available at Rs 350 a kg.
Mandi Price in Rs/ Quintal
22-09-2017 15-09-2017 %change
Kochi 45561.55 47000 -3.06
Kuttoor 42600 43600 -2.29
Fundamental Summary
Price Drivers Impact Weightage Score (1-5)*
Large quantity of Vietnam pepper imports in India via Sri Lanka Bearish 35% 2
Recommended ban on pepper imports by spice board on contamination concerns
Bullish 10% 4
Higher 2016-17 domestic production over last year Bearish 15% 2
Low carryover stocks due low production in 2015-16 Bullish 10% 4
High domestic demand Bullish 15% 4
Higher global availability due to bumper production in Vietnam Bearish 15% 2
Overall fundamental score 2.7
*Bearish; 2. Marginal Bearish; 3. Consolidation; 4. Marginal Bullish; 5. Bullish
• Three months ago, the Multi Commodity Exchange (MCX) launched trading in Malabar Garbled Black Pepper futures contract. It was expected
this would bring some stability in prices, but it did not help as cheap imports were a major problem, say growers.
• The October futures for delivery in the National Commodity and Derivatives Exchange Limited (NCDEX) fell more than 6% this month as
speculators reduced exposure amid easing demand in the spot market against adequate stocks position.
• Under an ASEAN agreement, a duty of 54% is levied on pepper imported from Vietnam. However, under SAFTA (South Asian Free Trade Area),
pepper from Sri Lanka attracts a duty of just 8%, making the traders route bulks of Vietnamese pepper through Sri Lanka. According to market
sources, Vietnam exported 3,000 tonnes of pepper to Sri Lanka in July, and another 2,000 tonnes in August. Most of this has come to India.
• Earlier, the FSSAI instructed various nodal agencies and its offices across the country to check pepper imports into the country. The authority
suspected that pepper coming in from Vietnam, through Sri Lanka, might be contaminated.
• Indian normally imports around 7,500 tonnes pepper per annum. This year, the total imports might cross 12,000 tonnes.
• India’s pepper production in 2016-17 is estimated at to 55,000 MT in 2016-17 tonnes this year as against 48,500 tonnes in 2015-16. Spice Board data
show that in 2012-13, pepper production was 65,000 tonnes, which dropped to 55,500 in 2016-17, mainly due to industrialisation in pepper-
growing areas and unfavourable weather conditions. Karnataka has now overtaken Kerala to become the largest cultivator of pepper.
• India’s domestic demand for pepper is on the increase on account of changing food habits. The current demand is estimated at 60,000 tonnes
per annum with an annual growth rate of 4 per cent.
• Vietnam, which accounts for about 40 percent of global pepper production, is projected to produce 210,000 tons of pepper this year, up 27
percent from the same period a year ago. Indonesia, second in pepper production, will harvest 68,000 tons, up 4.6 percent from last year.
• Overall fundamental score of 2.7 shows bearishness in pepper prices.
BACK TO TOP

Date: 26-09-2017
NCML Commodity Market Monitor
• Government allows export of tur, moong and urad after a decade News Link
• Kharif rice may dip by 1.9mn ton; pulses down 70k ton News Link
• Kharif oilseeds sowing disappointing News Link
• Basmati exports up 32% in Q1 News Link
• India's edible oil output to hit all-time high of 7.7 mn tonnes in 2017-18 News Link
• NCDEX allays jeera traders' fears of poor quality dispatch to warehouses News Link
• Gujarat to procure groundnut at Rs. 900/20kg against market price of Rs. 650 News Link
• Maharashtra estimates sugar production of 7.34 million tonnes this year News Link
• Paperless agri-commodity trading to be launched News Link
• South Indian mills surrender import quota News Link
• Government looks to dispose of 18 lakh tonnes pulses from buffer stock News Link
• SIMA forecasts recovery of yarn; lower cotton prices News Link
• Branded foodgrains, flours to attract 5% levy under GST News Link
• Cotton forward export contracts halve as global prices stay low News Link
• Sugar prices to hit 10-year low, says Abares, raising output estimates News Link
-4.0-0.6
-0.3
-5.0
0.2
2.1
0.8
-0.6
-2.1
-0.7
-0.9
-1.0
0.95
-9.0 -7.0 -5.0 -3.0 -1.0 1.0 3.0
Chana
Tur
Wheat
Paddy
Maize
Guar
Soya
Mustard
Cotton
Sugar
Castor
Turmeric
Jeera
Maize
% age change since 15th September 2017News corner
OFFICIAL PRODUCTION ESTIMATES
First advance estimates 2017-18 &
previous years’ estimates :
First Advance Estimates 2017-18
Link for commodity-wise and
market-wise prices and arrivals:
http://agmarknet.gov.in/PriceAndArrivals/
CommodityWiseDailyReport2.aspx
MSP in Rs /Qtl- Kharif 2017-18
Commodity 2015-16 2016-17 2017-18
Paddy Common 1410 1470 1550
paddy grade A 1450 1510 1590
Jowar Hybrid 1570 1625 1700
Jowar Maldandi 1590 1650 1725
Bajra 1275 1330 1425
Ragi 1650 1725 1900
Maize 1325 1365 1425
Tur 4625 5050 5450*
Moong 4850 5225 5575*
Urad 4625 5000 5400*
Groundnut 4030 4220 4450*
Sunflower seed 3800 3950 4100 #
Soyabean black
2775 3050
Sesamum 4700 5000 5300 #
Nigerseed 3650 3825 4050 #
Cotton(Medium Staple) 3800 3680 4020
Cotton(Long Staple) 4100 4160 4320
*includes bonus of Rs 200 per quintal
# includes bonus of Rs 100 per quintal
BACK TO TOP
MONSOON SITUATION

Date: 26-09-2017
NCML Commodity Market Monitor
Sowing progress: Kharif 2017-18- LINK
BACK TO TOP

Date: 26-09-2017
NCML Commodity Market Monitor
Advisory Team
Basant Vaid Head: TCIG [email protected]
Sreedhar Nandam Vice President: SCM [email protected]
Research Team
Suresh Solanki Assistant Manager: TCIG [email protected]
Kamna Malhotra Economist: TCIG [email protected]
Akash Jaiswal Research Analyst: TCIG [email protected]
Ansh Aggarwal Senior Officer: Trade Support [email protected]
For any research queries, contact us at [email protected]
STOCK
Stock limits of States/UTs
Disclaimer:
This consultancy report has been prepared by National Collateral Management Services Limited (NCML) for the sole benefit of the addressee.
Neither the report nor any part of the report shall be provided to third parties without the written consent of NCML. Any third party in
possession of the report may not rely on its conclusions without the written consent of NCML. NCML has exercised reasonable care and skill in
preparation of this consultancy report but has not independently verified information provided by others. No other warranty, express or
implied, is made in relation to this report. Therefore, NCML assumes no liability for any loss resulting from errors, omissions or
misrepresentations made by others. Any recommendations, opinions and findings stated in this report are based on circumstances and facts as
they existed at the time of preparation of this report. Any change in circumstances and facts on which this report is based may adversely affect
any recommendations, opinions or findings contained in this report.
© National Collateral Management Services Limited (NCML) 2017
BACK TO TOP