2014 may grayreports - student demand trends
TRANSCRIPT

GRAYREPORTS Demand for Educational Programs
www.GrayAssociates.com
Results through May 2014
617.401.7662 www.GrayAssociates.com 2
GRAY For more information please contact Bob Atkins. Email: [email protected]
Agenda
1. Introduction
2. Demand: National Overview
3. Demand for On-Line Programs
4. Demand for On-Ground Programs
5. Demand by Program and City
6. Demand by Consumer Segment
7. Summary
617.401.7662 www.GrayAssociates.com 3
GRAY For more information please contact Bob Atkins. Email: [email protected]
Key Demand Trends and Observations
1. Data on market demand is now available that can help guide your decisions
2. Overall demand was down slightly in May.
3. Market share is shifting between:
§ On-line and on-ground programs
§ Large programs and smaller programs
§ Largest cities and other cities
§ Traditional segments and more affluent segments
617.401.7662 www.GrayAssociates.com 4
GRAY For more information please contact Bob Atkins. Email: [email protected]
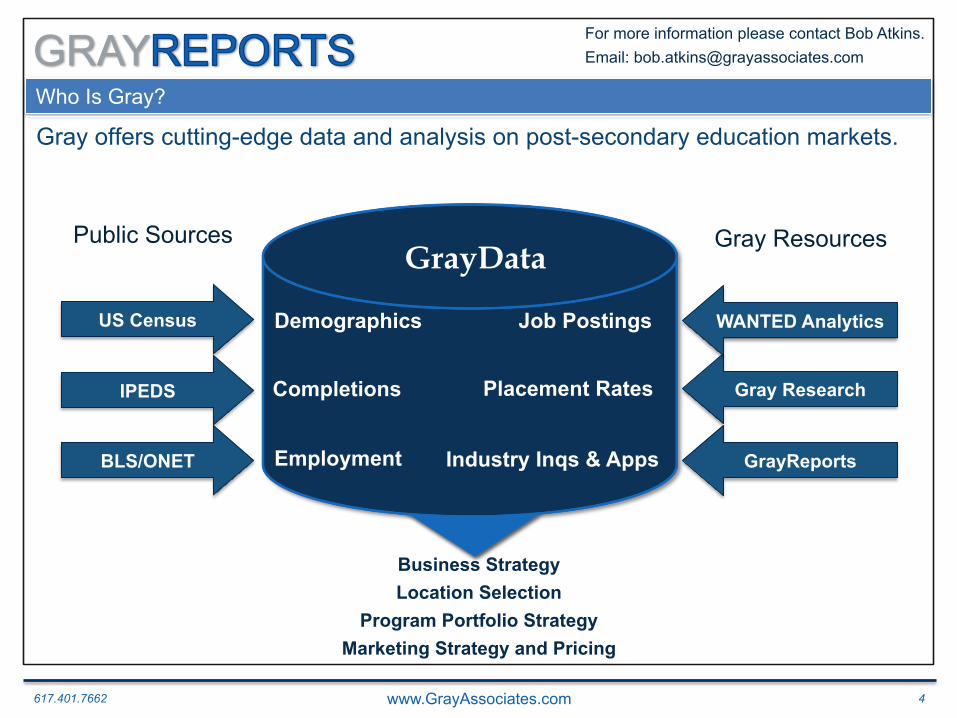
Who Is Gray?
Gray offers cutting-edge data and analysis on post-secondary education markets.
GrayReports
Completions
Employment
GrayData
Placement Rates
Industry Inqs & Apps
Demographics
BLS/ONET
Business Strategy Location Selection
Program Portfolio Strategy Marketing Strategy and Pricing
Gray Research
Job Postings
IPEDS
US Census WANTED Analytics
Public Sources Public Sources Gray Resources
617.401.7662 www.GrayAssociates.com 5
GRAY For more information please contact Bob Atkins. Email: [email protected]
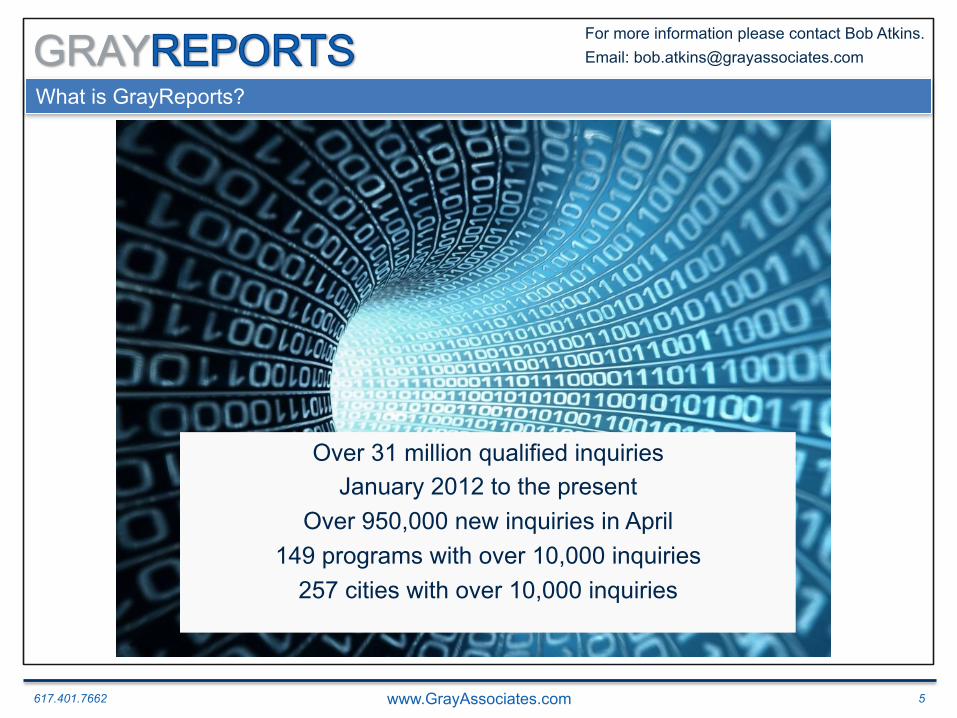
What is GrayReports?
Over 31 million qualified inquiries January 2012 to the present
Over 950,000 new inquiries in April 149 programs with over 10,000 inquiries
257 cities with over 10,000 inquiries
617.401.7662 www.GrayAssociates.com 6
GRAY For more information please contact Bob Atkins. Email: [email protected]
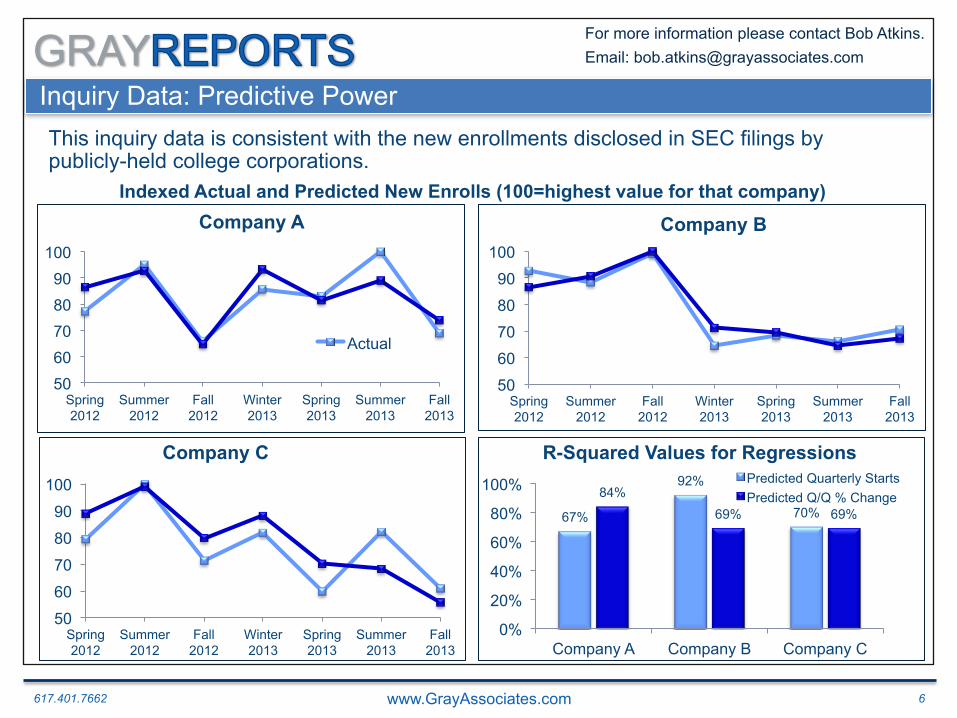
Inquiry Data: Predictive Power This inquiry data is consistent with the new enrollments disclosed in SEC filings by publicly-held college corporations.
Indexed Actual and Predicted New Enrolls (100=highest value for that company)
50 60 70 80 90
100
Spring 2012
Summer 2012
Fall 2012
Winter 2013
Spring 2013
Summer 2013
Fall 2013
Company A
Actual
50
60
70
80
90
100
Spring 2012
Summer 2012
Fall 2012
Winter 2013
Spring 2013
Summer 2013
Fall 2013
Company B
50
60
70
80
90
100
Spring 2012
Summer 2012
Fall 2012
Winter 2013
Spring 2013
Summer 2013
Fall 2013
Company C
67%
92%
70% 84%
69% 69%
0%
20%
40%
60%
80%
100%
Company A Company B Company C
R-Squared Values for Regressions Predicted Quarterly Starts Predicted Q/Q % Change
617.401.7662 www.GrayAssociates.com 7
GRAY For more information please contact Bob Atkins. Email: [email protected]
Agenda
1. Introduction
2. Demand: National Overview
3. Demand for On-Line Programs
4. Demand for On-Ground Programs
5. Demand by Program and City
6. Demand by Consumer Segment
7. Summary
617.401.7662 www.GrayAssociates.com 8
GRAY For more information please contact Bob Atkins. Email: [email protected]
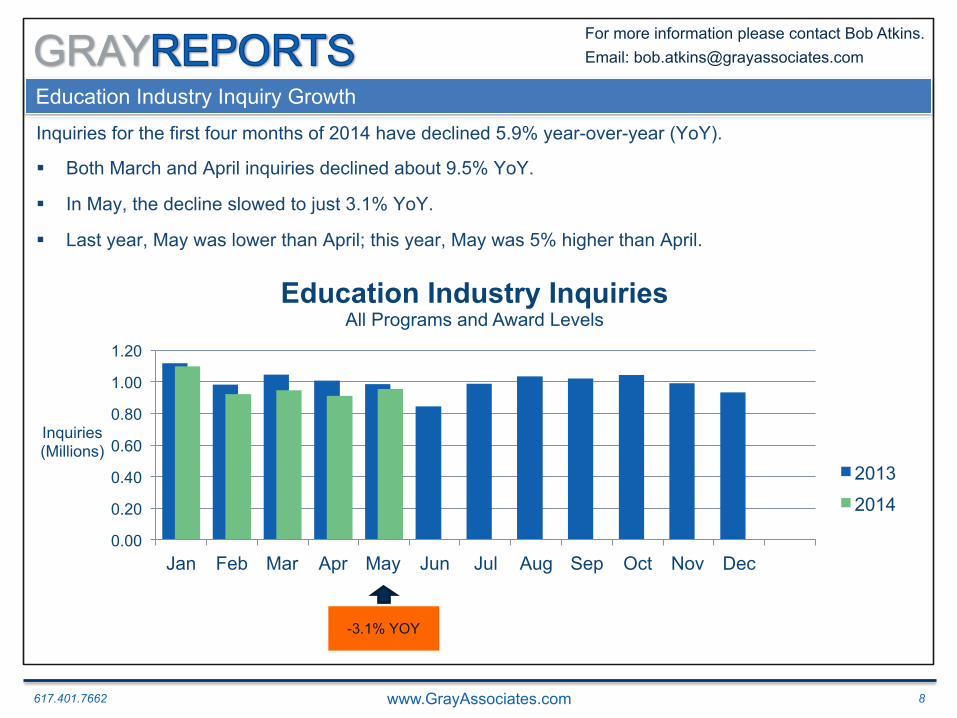
Education Industry Inquiry Growth
Inquiries for the first four months of 2014 have declined 5.9% year-over-year (YoY).
§ Both March and April inquiries declined about 9.5% YoY.
§ In May, the decline slowed to just 3.1% YoY.
§ Last year, May was lower than April; this year, May was 5% higher than April.
2012
0.00
0.20
0.40
0.60
0.80
1.00
1.20
Jan Feb Mar Apr May Jun Jul Aug Sep Oct Nov Dec
Inquiries (Millions)
Education Industry Inquiries All Programs and Award Levels
2013
2014
-3.1% YOY
617.401.7662 www.GrayAssociates.com 9
GRAY For more information please contact Bob Atkins. Email: [email protected]
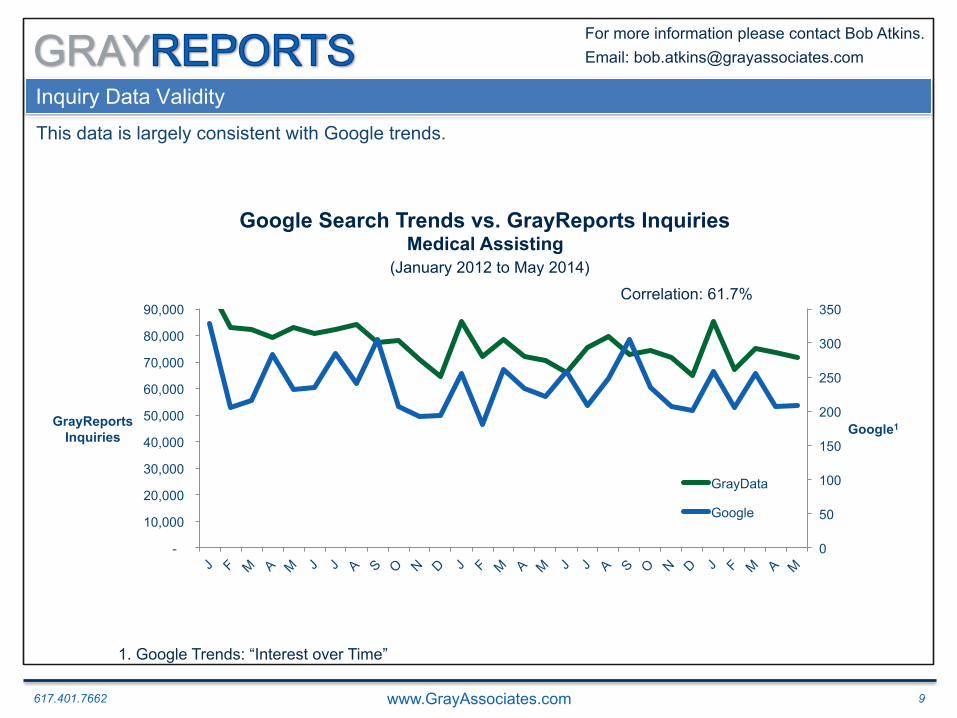
Inquiry Data Validity
This data is largely consistent with Google trends.
0
50
100
150
200
250
300
350
-
10,000
20,000
30,000
40,000
50,000
60,000
70,000
80,000
90,000
Google1 GrayReports Inquiries
GrayData
Google Search Trends vs. GrayReports Inquiries Medical Assisting
(January 2012 to May 2014)
1. Google Trends: “Interest over Time”
Correlation: 61.7%
617.401.7662 www.GrayAssociates.com 10
GRAY For more information please contact Bob Atkins. Email: [email protected]
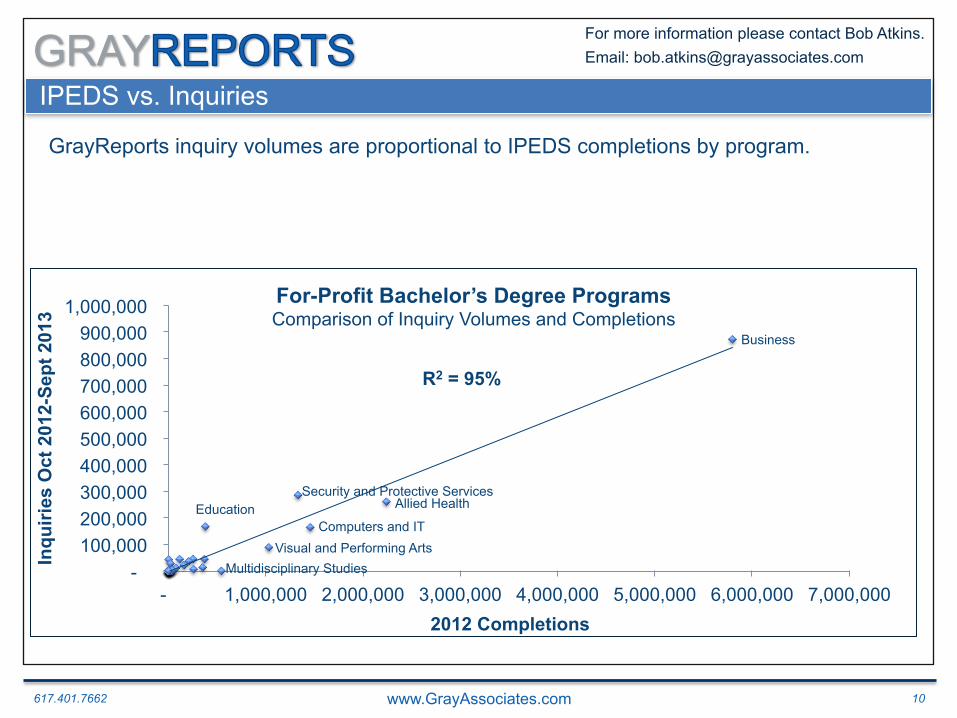
IPEDS vs. Inquiries
R2 = 95%
- 100,000 200,000 300,000 400,000 500,000 600,000 700,000 800,000 900,000
1,000,000
- 1,000,000 2,000,000 3,000,000 4,000,000 5,000,000 6,000,000 7,000,000
Inqu
iries
Oct
201
2-Se
pt 2
013
2012 Completions
For-Profit Bachelor’s Degree Programs Comparison of Inquiry Volumes and Completions
Computers and IT
Business
Security and Protective Services Allied Health
Multidisciplinary Studies Visual and Performing Arts
Education
GrayReports inquiry volumes are proportional to IPEDS completions by program.
617.401.7662 www.GrayAssociates.com 11
GRAY For more information please contact Bob Atkins. Email: [email protected]
2.9%
2.5%
3.0%
2.8%
2.9%
3.4%
3.2%
3.0%
2.7%
2.8%
2.6%
2.6%
2.4%
2.0%
2.4%
2.3%
1.9%
0.00%
0.50%
1.00%
1.50%
2.00%
2.50%
3.00%
3.50%
4.00%
Jan Feb Mar Apr May Jun Jul Aug Sep Oct Nov Dec
App
licat
ion
Rat
e
Education Industry Application Rates 2013 2014
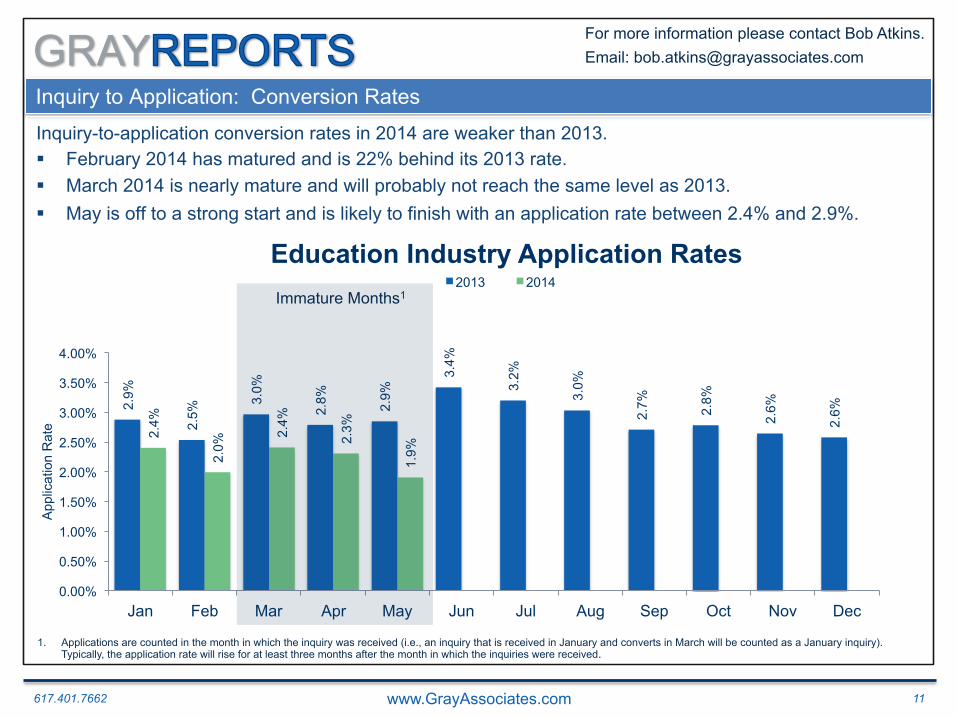
Inquiry to Application: Conversion Rates
Immature Months1
Inquiry-to-application conversion rates in 2014 are weaker than 2013. § February 2014 has matured and is 22% behind its 2013 rate. § March 2014 is nearly mature and will probably not reach the same level as 2013. § May is off to a strong start and is likely to finish with an application rate between 2.4% and 2.9%.
1. Applications are counted in the month in which the inquiry was received (i.e., an inquiry that is received in January and converts in March will be counted as a January inquiry). Typically, the application rate will rise for at least three months after the month in which the inquiries were received.
617.401.7662 www.GrayAssociates.com 12
GRAY For more information please contact Bob Atkins. Email: [email protected]
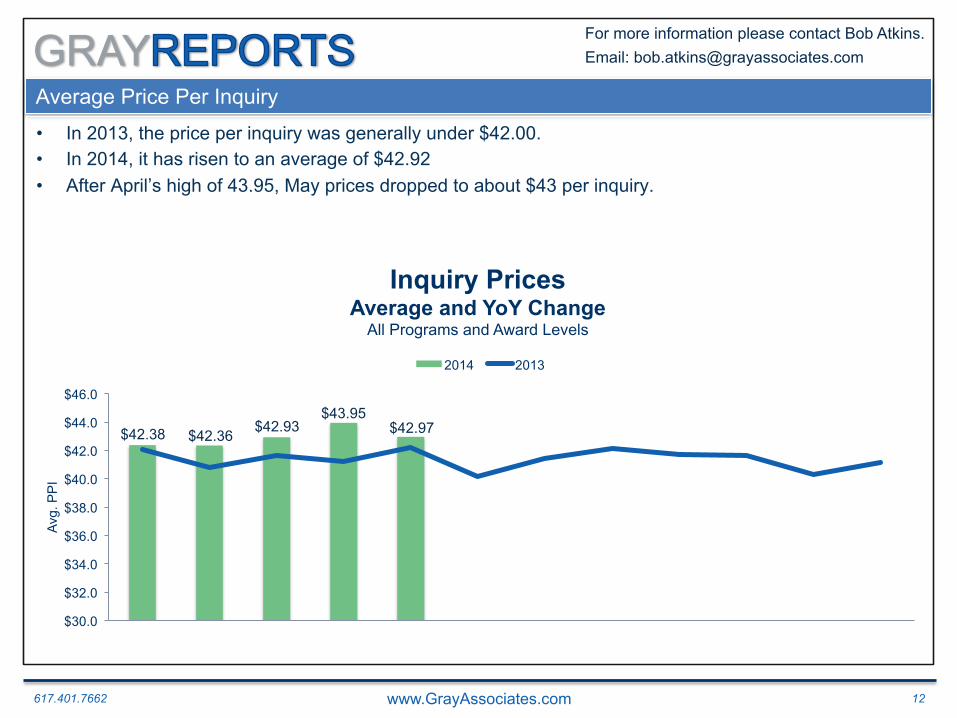
Average Price Per Inquiry
• In 2013, the price per inquiry was generally under $42.00. • In 2014, it has risen to an average of $42.92 • After April’s high of 43.95, May prices dropped to about $43 per inquiry.
$30.0
$32.0
$34.0
$36.0
$38.0
$40.0
$42.0
$44.0
$46.0
Avg.
PP
I
Inquiry Prices Average and YoY Change
All Programs and Award Levels
2014 2013
$42.38 $42.36 $42.93 $43.95
$42.97
617.401.7662 www.GrayAssociates.com 13
GRAY For more information please contact Bob Atkins. Email: [email protected]
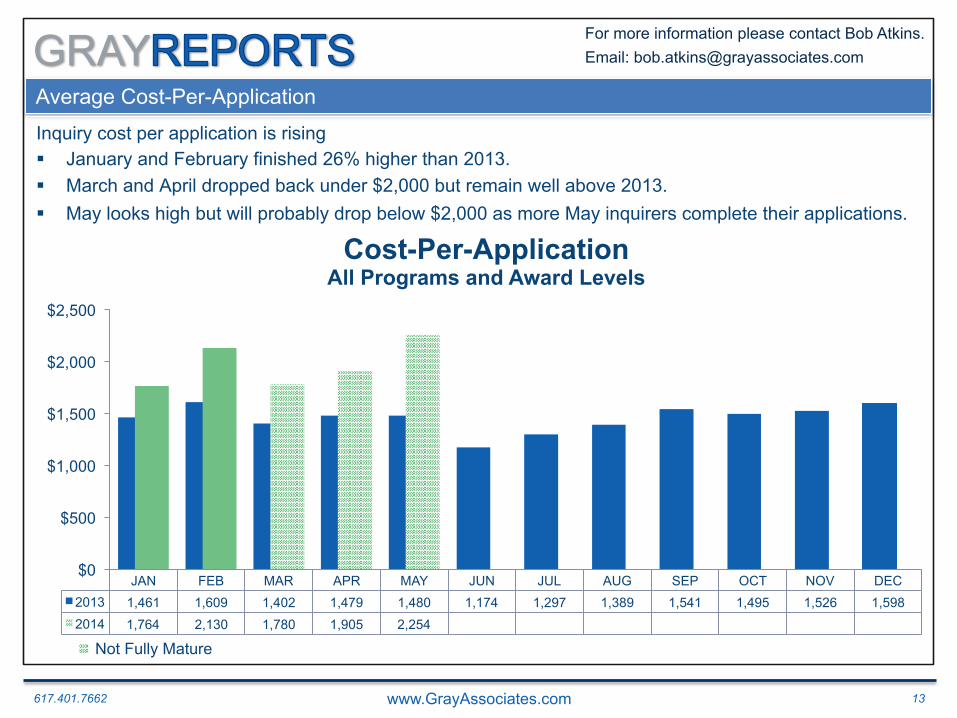
Average Cost-Per-Application
Inquiry cost per application is rising § January and February finished 26% higher than 2013. § March and April dropped back under $2,000 but remain well above 2013. § May looks high but will probably drop below $2,000 as more May inquirers complete their applications.
JAN FEB MAR APR MAY JUN JUL AUG SEP OCT NOV DEC 2013 1,461 1,609 1,402 1,479 1,480 1,174 1,297 1,389 1,541 1,495 1,526 1,598 2014 1,764 2,130 1,780 1,905 2,254
$0
$500
$1,000
$1,500
$2,000
$2,500
Cost-Per-Application All Programs and Award Levels
Not Fully Mature

617.401.7662 www.GrayAssociates.com 14
GRAY For more information please contact Bob Atkins. Email: [email protected]
Agenda
1. Introduction
2. Demand: National Overview
3. Demand for On-Line Programs
4. Demand for On-Ground Programs
5. Demand by Program and City
6. Demand by Consumer Segment
7. Summary
617.401.7662 www.GrayAssociates.com 15
GRAY For more information please contact Bob Atkins. Email: [email protected]
0
100,000
200,000
300,000
400,000
500,000
600,000
Jan Feb Mar Apr May Jun Jul Aug Sep Oct Nov Dec
Inqu
iries
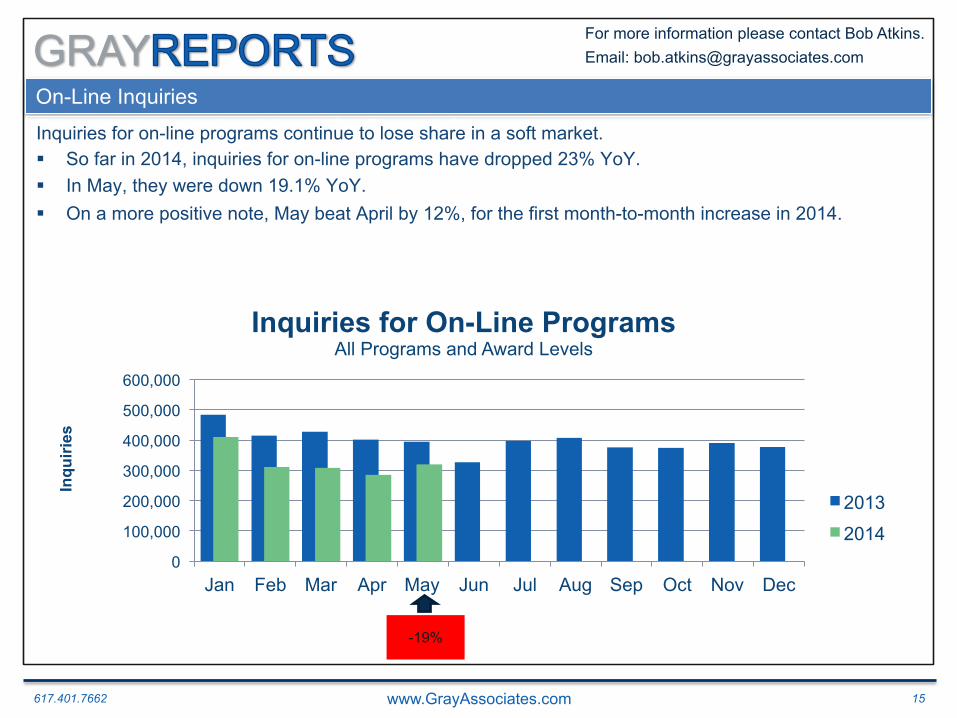
Inquiries for On-Line Programs All Programs and Award Levels
2013
2014
On-Line Inquiries Education Industry Inquiries: YOY Percent Change Inquiries for on-line programs continue to lose share in a soft market. § So far in 2014, inquiries for on-line programs have dropped 23% YoY. § In May, they were down 19.1% YoY. § On a more positive note, May beat April by 12%, for the first month-to-month increase in 2014.
-19%
617.401.7662 www.GrayAssociates.com 16
GRAY For more information please contact Bob Atkins. Email: [email protected]
1.8%
1.8%
2.1%
2.2%
2.1%
3.6%
1.9%
2.1%
2.0%
2.1%
1.8%
1.8%
1.5%
1.3%
1.8%
1.9%
1.7%
0.00%
0.50%
1.00%
1.50%
2.00%
2.50%
3.00%
3.50%
4.00%
Jan Feb Mar Apr May Jun Jul Aug Sep Oct Nov Dec
App
licat
ion
Rat
e
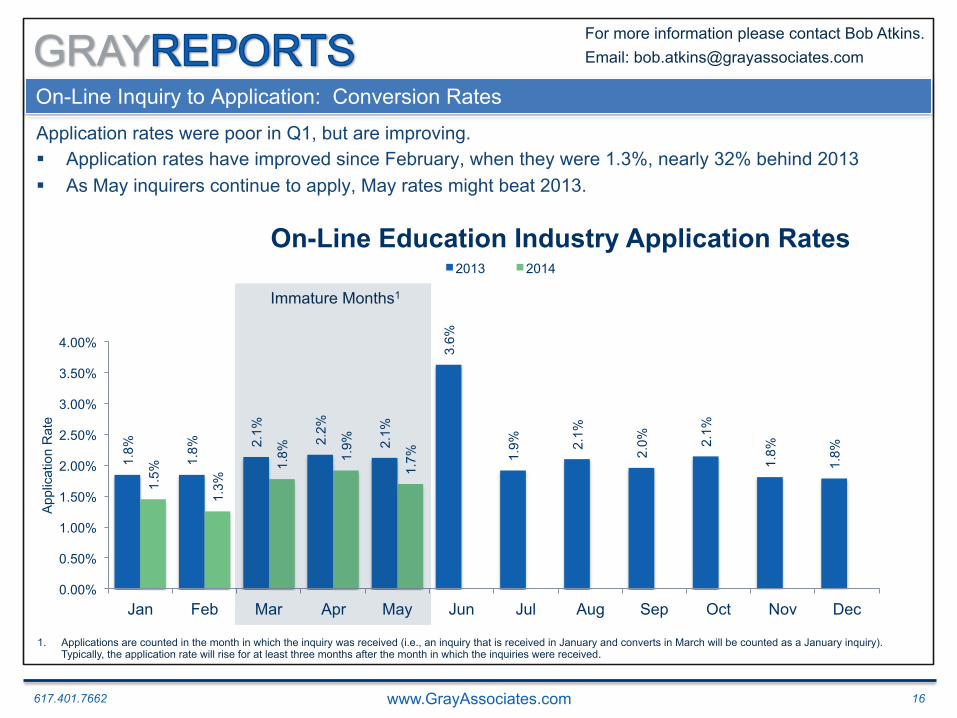
On-Line Education Industry Application Rates 2013 2014
On-Line Inquiry to Application: Conversion Rates
Immature Months1
Application rates were poor in Q1, but are improving. § Application rates have improved since February, when they were 1.3%, nearly 32% behind 2013 § As May inquirers continue to apply, May rates might beat 2013.
1. Applications are counted in the month in which the inquiry was received (i.e., an inquiry that is received in January and converts in March will be counted as a January inquiry). Typically, the application rate will rise for at least three months after the month in which the inquiries were received.

617.401.7662 www.GrayAssociates.com 17
GRAY For more information please contact Bob Atkins. Email: [email protected]
On-line Average Price Per Inquiry
Inquiries for on-line programs are getting more expensive. • Until May, price per inquiry rose every month. • May prices were lower than in April but still 10% higher than last year
$0.0
$5.0
$10.0
$15.0
$20.0
$25.0
$30.0
$35.0
$40.0
$45.0
$50.0
Jan Feb Mar Apr May Jun Jul Aug Sep Oct Nov Dec
Avg.
PP
I
On-line Inquiry Prices Average and YoY Change
All Programs and Award Levels
2014 2013
$41.94 $42.45 $43.53 $45.91 $44.41
617.401.7662 www.GrayAssociates.com 18
GRAY For more information please contact Bob Atkins. Email: [email protected]
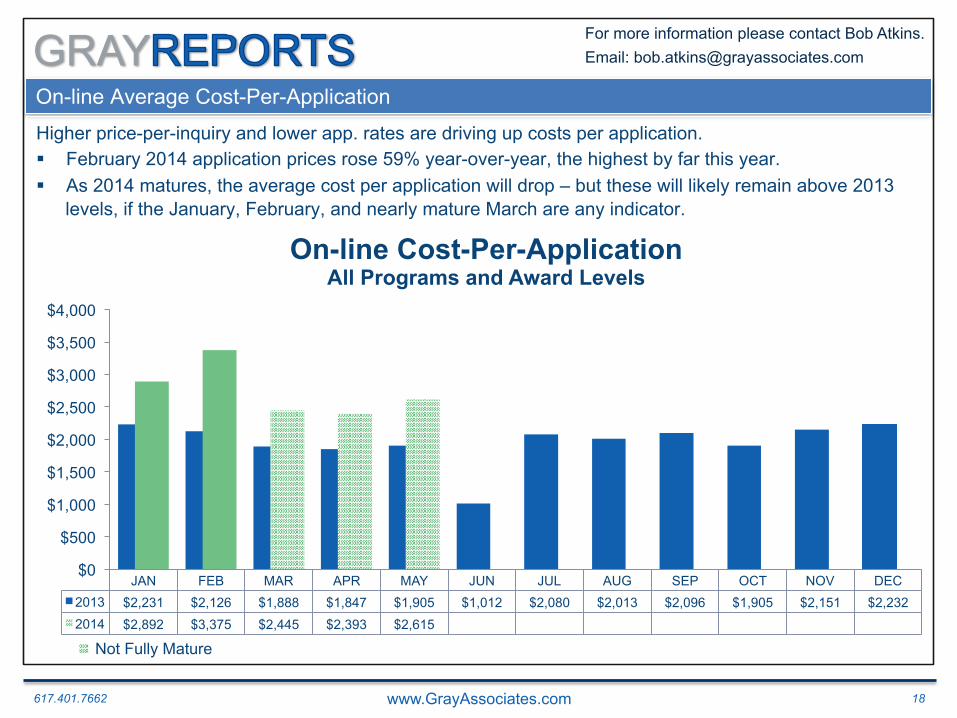
On-line Average Cost-Per-Application
Higher price-per-inquiry and lower app. rates are driving up costs per application. § February 2014 application prices rose 59% year-over-year, the highest by far this year. § As 2014 matures, the average cost per application will drop – but these will likely remain above 2013
levels, if the January, February, and nearly mature March are any indicator.
JAN FEB MAR APR MAY JUN JUL AUG SEP OCT NOV DEC 2013 $2,231 $2,126 $1,888 $1,847 $1,905 $1,012 $2,080 $2,013 $2,096 $1,905 $2,151 $2,232 2014 $2,892 $3,375 $2,445 $2,393 $2,615
$0
$500
$1,000
$1,500
$2,000
$2,500
$3,000
$3,500
$4,000
On-line Cost-Per-Application All Programs and Award Levels
Not Fully Mature

617.401.7662 www.GrayAssociates.com 19
GRAY For more information please contact Bob Atkins. Email: [email protected]
Agenda
1. Introduction
2. Demand: National Overview
3. Demand for On-Line Programs
4. Demand for On-Ground Programs
5. Demand by Program and City
6. Demand by Consumer Segment
7. Summary
617.401.7662 www.GrayAssociates.com 20
GRAY For more information please contact Bob Atkins. Email: [email protected]
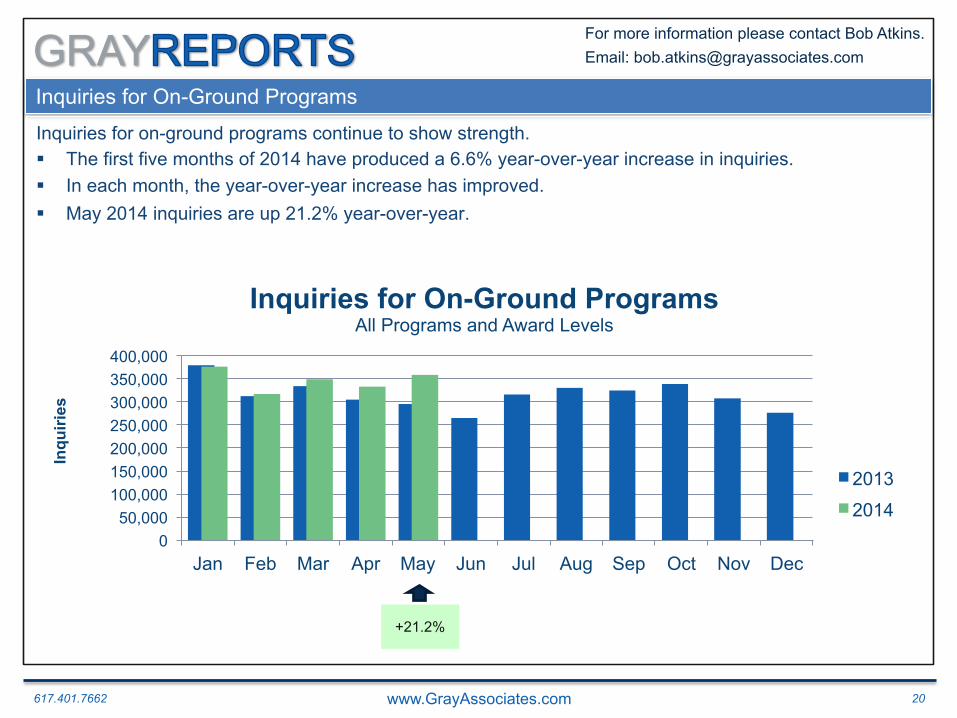
Inquiries for On-Ground Programs
Inquiries for on-ground programs continue to show strength. § The first five months of 2014 have produced a 6.6% year-over-year increase in inquiries. § In each month, the year-over-year increase has improved. § May 2014 inquiries are up 21.2% year-over-year.
2012
0 50,000
100,000 150,000 200,000 250,000 300,000 350,000 400,000
Jan Feb Mar Apr May Jun Jul Aug Sep Oct Nov Dec
Inqu
iries
Inquiries for On-Ground Programs All Programs and Award Levels
2013
2014
+21.2%
617.401.7662 www.GrayAssociates.com 21
GRAY For more information please contact Bob Atkins. Email: [email protected]
4.1%
3.5%
4.5%
4.1%
4.3%
4.0%
5.5%
3.8%
3.9%
3.8%
3.8%
4.0%
2.9%
2.4%
2.9%
2.7%
2.3%
0%
1%
2%
3%
4%
5%
6%
Jan Feb Mar Apr May Jun Jul Aug Sep Oct Nov Dec
Inquiry-to- Application
Conversion Rate
Education Industry Application Rates 2013 2014
On-Ground Inquiry to Application: Conversion Rates
Immature Months1
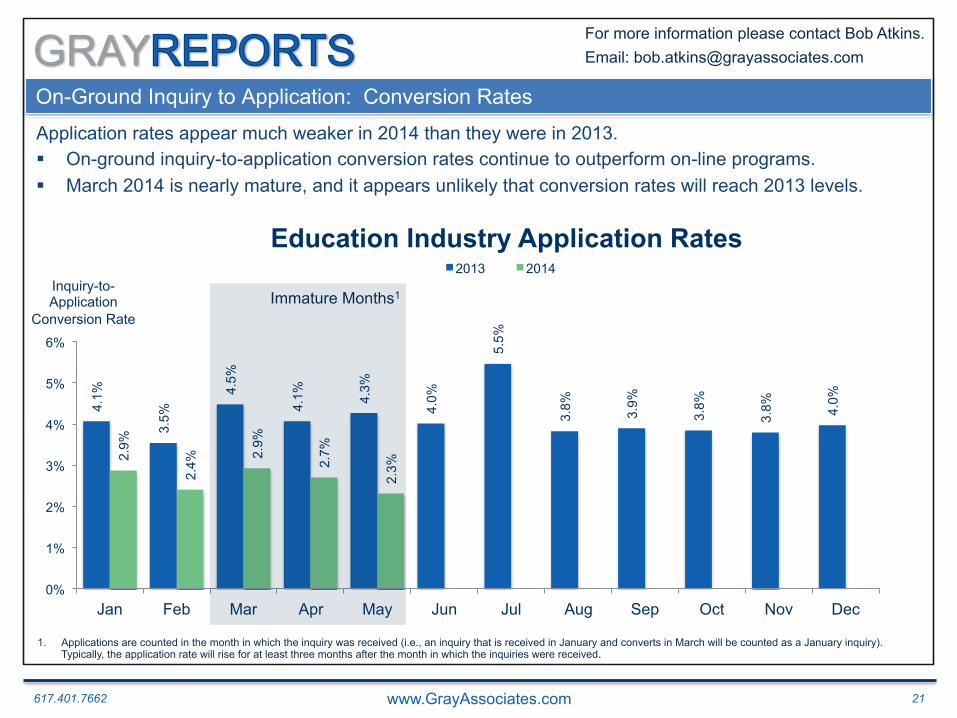
Application rates appear much weaker in 2014 than they were in 2013. § On-ground inquiry-to-application conversion rates continue to outperform on-line programs. § March 2014 is nearly mature, and it appears unlikely that conversion rates will reach 2013 levels.
1. Applications are counted in the month in which the inquiry was received (i.e., an inquiry that is received in January and converts in March will be counted as a January inquiry). Typically, the application rate will rise for at least three months after the month in which the inquiries were received.
617.401.7662 www.GrayAssociates.com 22
GRAY For more information please contact Bob Atkins. Email: [email protected]
On-Ground Average Price Per Inquiry
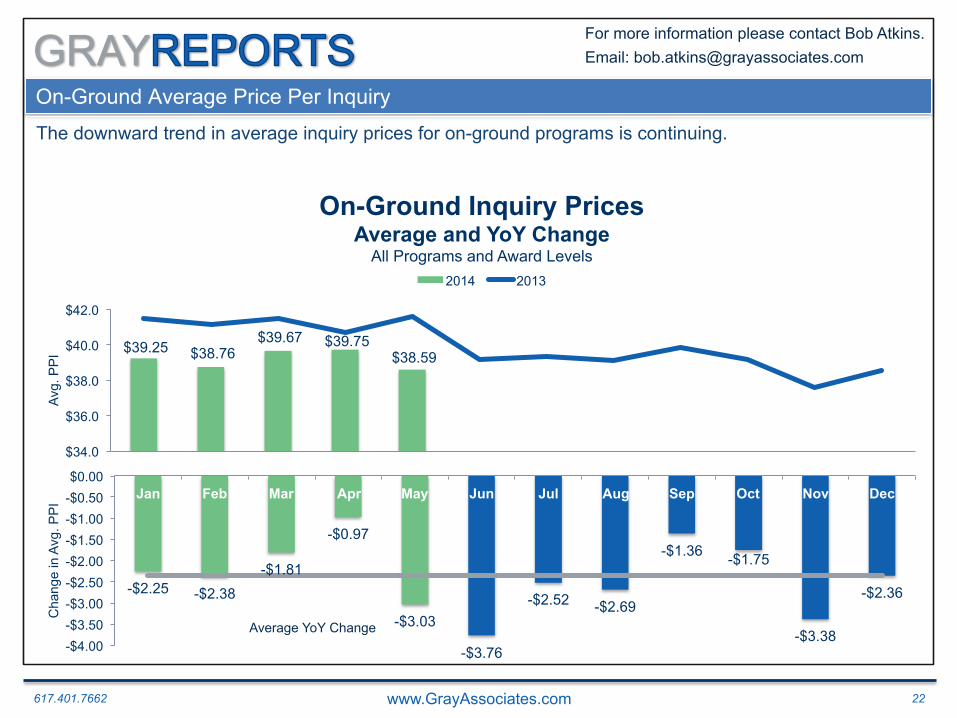
The downward trend in average inquiry prices for on-ground programs is continuing.
$39.25 $38.76 $39.67 $39.75
$38.59
$34.0
$36.0
$38.0
$40.0
$42.0
Avg.
PP
I
On-Ground Inquiry Prices Average and YoY Change
All Programs and Award Levels 2014 2013
-$2.25 -$2.38 -$1.81
-$0.97
-$3.03
-$3.76
-$2.52 -$2.69
-$1.36 -$1.75
-$3.38
-$2.36
-$4.00 -$3.50 -$3.00 -$2.50 -$2.00 -$1.50 -$1.00 -$0.50 $0.00
Jan Feb Mar Apr May Jun Jul Aug Sep Oct Nov Dec
Cha
nge
in A
vg. P
PI
Average YoY Change
617.401.7662 www.GrayAssociates.com 23
GRAY For more information please contact Bob Atkins. Email: [email protected]
On-Ground Average Cost-Per-Application
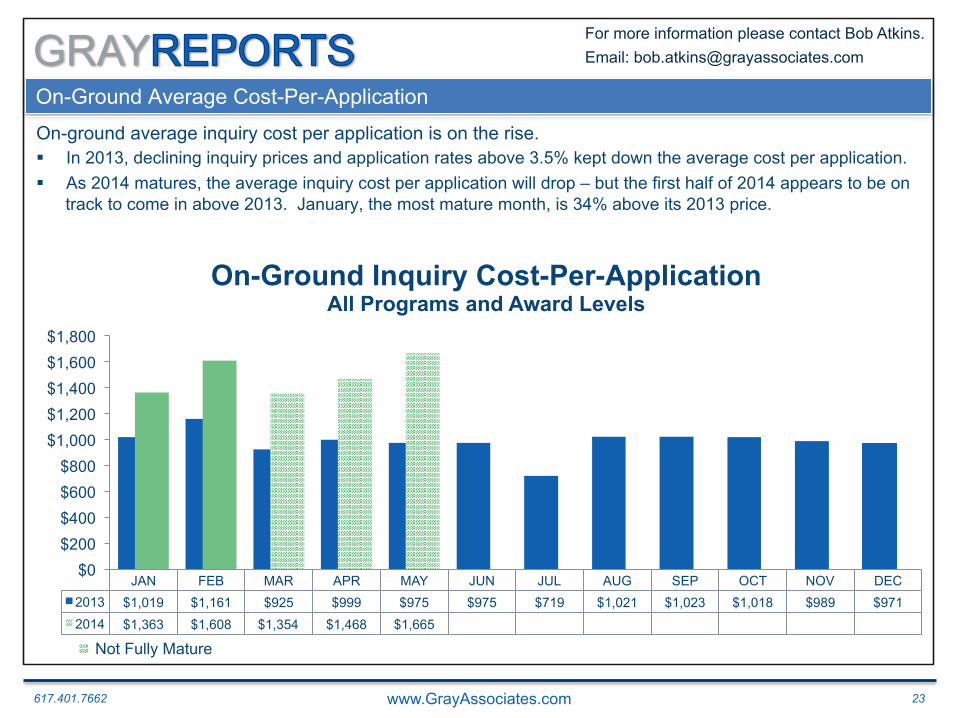
On-ground average inquiry cost per application is on the rise. § In 2013, declining inquiry prices and application rates above 3.5% kept down the average cost per application. § As 2014 matures, the average inquiry cost per application will drop – but the first half of 2014 appears to be on
track to come in above 2013. January, the most mature month, is 34% above its 2013 price.
JAN FEB MAR APR MAY JUN JUL AUG SEP OCT NOV DEC 2013 $1,019 $1,161 $925 $999 $975 $975 $719 $1,021 $1,023 $1,018 $989 $971 2014 $1,363 $1,608 $1,354 $1,468 $1,665
$0 $200 $400 $600 $800
$1,000 $1,200 $1,400 $1,600 $1,800
On-Ground Inquiry Cost-Per-Application All Programs and Award Levels
Not Fully Mature
617.401.7662 www.GrayAssociates.com 24
GRAY For more information please contact Bob Atkins. Email: [email protected]
Agenda
1. Introduction
2. Demand: National Overview
3. Demand for On-Line Programs
4. Demand for On-Ground Programs
5. Demand by Program and City
6. Demand by Consumer Segment
7. Summary
617.401.7662 www.GrayAssociates.com 25
GRAY For more information please contact Bob Atkins. Email: [email protected]
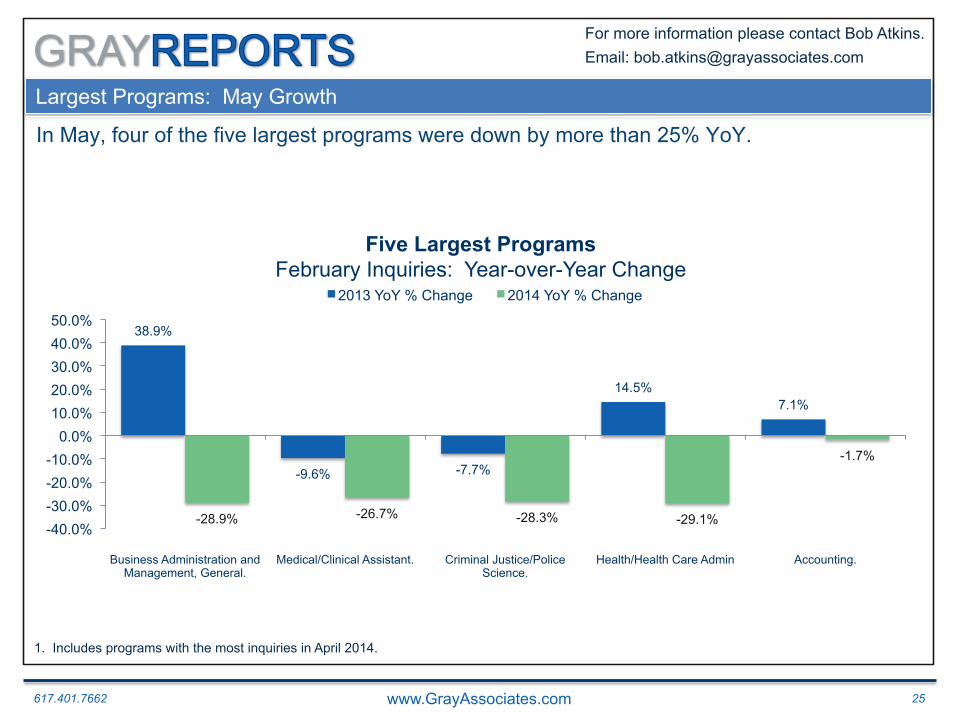
Largest Programs: May Growth
In May, four of the five largest programs were down by more than 25% YoY.
38.9%
-9.6% -7.7%
14.5% 7.1%
-28.9% -26.7% -28.3% -29.1%
-1.7%
-40.0% -30.0% -20.0% -10.0%
0.0% 10.0% 20.0% 30.0% 40.0% 50.0%
Business Administration and Management, General.
Medical/Clinical Assistant. Criminal Justice/Police Science.
Health/Health Care Admin Accounting.
Five Largest Programs February Inquiries: Year-over-Year Change
2013 YoY % Change 2014 YoY % Change
1. Includes programs with the most inquiries in April 2014.

617.401.7662 www.GrayAssociates.com 26
GRAY For more information please contact Bob Atkins. Email: [email protected]
Top 5 Fastest-Growing Programs in May
The five fastest-growing programs1 all grew over 95% year-over-year in May. § Two are traditional hands-on trade programs: Welding and Electrical Technician. § Health Information/Medical Records came in third, with over 100% growth. § The we have two programs that are new to list, Photography and Applied Behavior Analysis.
78.7%
-17.0%
61.5%
-9.2%
331.9%
206.6%
121.1% 98.7% 96.8%
-50.0% 0.0%
50.0% 100.0% 150.0% 200.0% 250.0% 300.0% 350.0% 400.0%
Welding Tech./Welder. Photography. Health Information/Medical Records Admin.
Electrical, Electronic & Comms. Engineering
Tech.
Applied Behavior Analysis.
Industry Inquiries Fastest Growing Programs – April 2014
2013 YoY % Change 2014 YoY % Change
1. Includes only programs within the top 75 for total inquiries since January 2012.
617.401.7662 www.GrayAssociates.com 27
GRAY For more information please contact Bob Atkins. Email: [email protected]
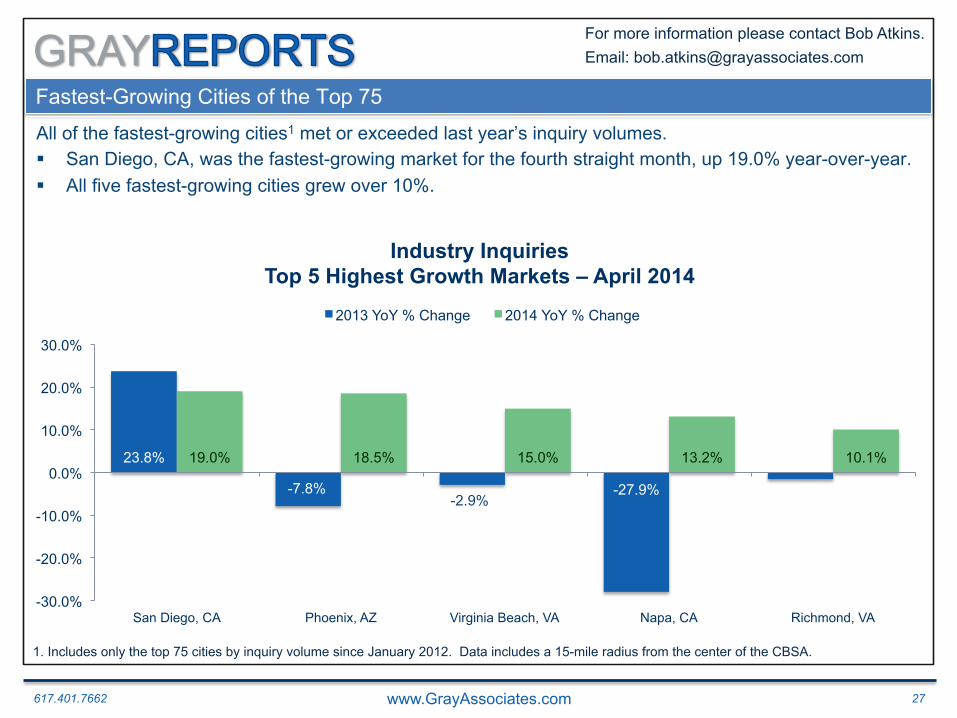
Fastest-Growing Cities of the Top 75
All of the fastest-growing cities1 met or exceeded last year’s inquiry volumes. § San Diego, CA, was the fastest-growing market for the fourth straight month, up 19.0% year-over-year. § All five fastest-growing cities grew over 10%.
23.8%
-7.8% -2.9%
-27.9% -1.6%
19.0% 18.5% 15.0% 13.2% 10.1%
-30.0%
-20.0%
-10.0%
0.0%
10.0%
20.0%
30.0%
San Diego, CA Phoenix, AZ Virginia Beach, VA Napa, CA Richmond, VA
Industry Inquiries Top 5 Highest Growth Markets – April 2014
2013 YoY % Change 2014 YoY % Change
1. Includes only the top 75 cities by inquiry volume since January 2012. Data includes a 15-mile radius from the center of the CBSA.
617.401.7662 www.GrayAssociates.com 28
GRAY For more information please contact Bob Atkins. Email: [email protected]
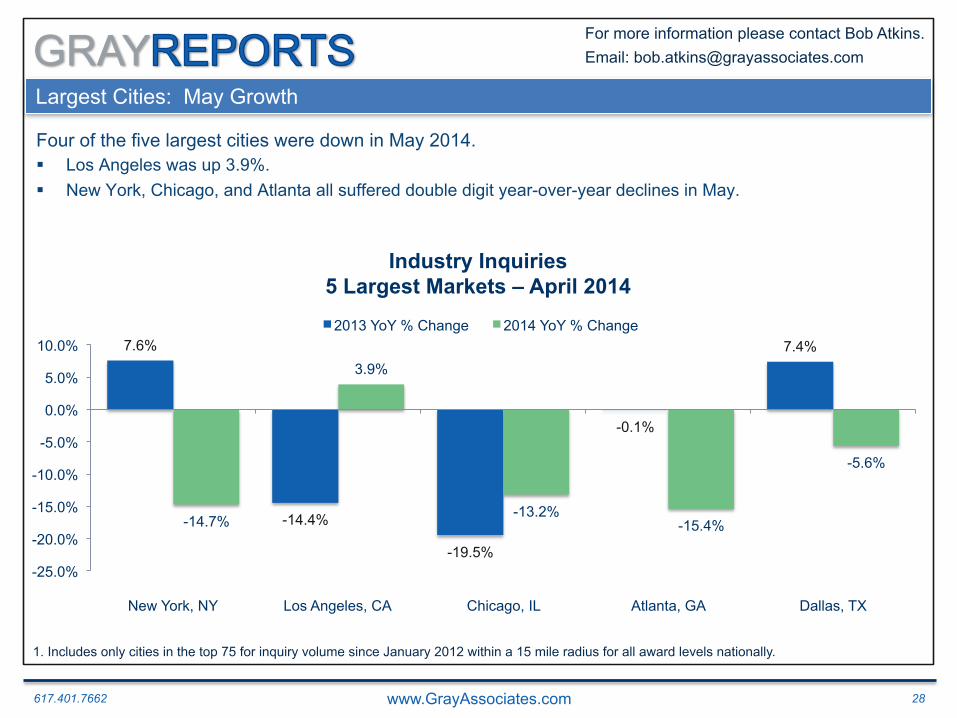
Largest Cities: May Growth
Four of the five largest cities were down in May 2014. § Los Angeles was up 3.9%. § New York, Chicago, and Atlanta all suffered double digit year-over-year declines in May.
7.6%
-14.4%
-19.5%
-0.1%
7.4%
-14.7%
3.9%
-13.2% -15.4%
-5.6%
-25.0%
-20.0%
-15.0%
-10.0%
-5.0%
0.0%
5.0%
10.0%
New York, NY Los Angeles, CA Chicago, IL Atlanta, GA Dallas, TX
Industry Inquiries 5 Largest Markets – April 2014
2013 YoY % Change 2014 YoY % Change
1. Includes only cities in the top 75 for inquiry volume since January 2012 within a 15 mile radius for all award levels nationally.
617.401.7662 www.GrayAssociates.com 29
GRAY For more information please contact Bob Atkins. Email: [email protected]
Agenda
1. Introduction
2. Demand: National Overview
3. Demand for On-Line Programs
4. Demand for On-Ground Programs
5. Demand by Program and City
6. Demand by Consumer Segment
7. Summary
617.401.7662 www.GrayAssociates.com 30
GRAY For more information please contact Bob Atkins. Email: [email protected]
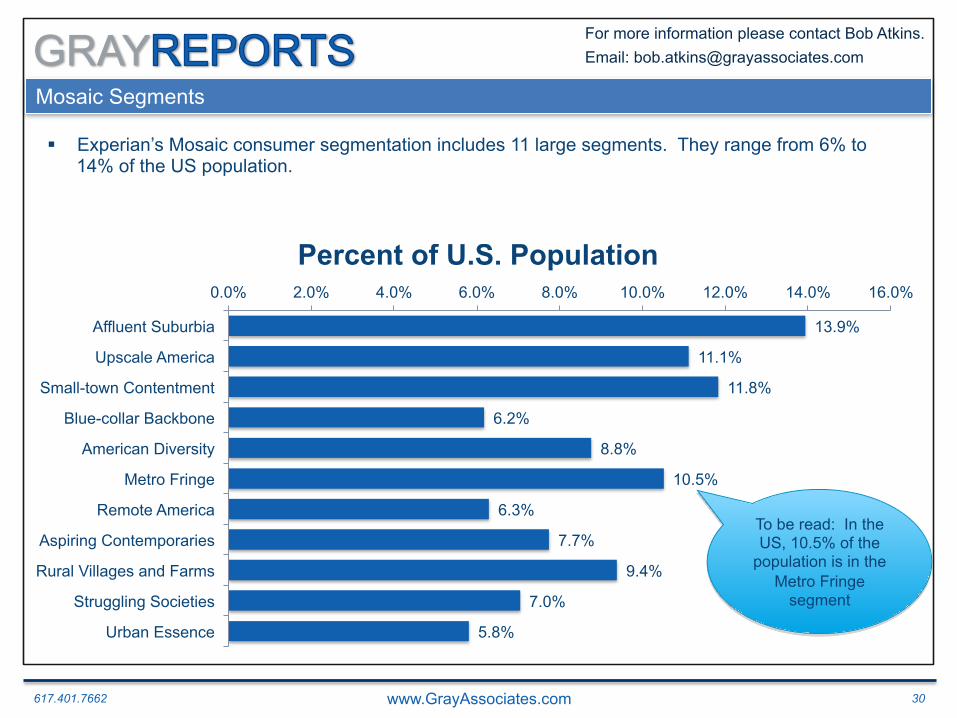
Mosaic Segments
13.9%
11.1%
11.8%
6.2%
8.8%
10.5%
6.3%
7.7%
9.4%
7.0%
5.8%
0.0% 2.0% 4.0% 6.0% 8.0% 10.0% 12.0% 14.0% 16.0%
Affluent Suburbia
Upscale America
Small-town Contentment
Blue-collar Backbone
American Diversity
Metro Fringe
Remote America
Aspiring Contemporaries
Rural Villages and Farms
Struggling Societies
Urban Essence
Percent of U.S. Population
§ Experian’s Mosaic consumer segmentation includes 11 large segments. They range from 6% to 14% of the US population.
To be read: In the US, 10.5% of the
population is in the Metro Fringe
segment

617.401.7662 www.GrayAssociates.com 31
GRAY For more information please contact Bob Atkins. Email: [email protected]
High-Demand Tracts
§ 74,000 total tracts in the US § 15,000 high-demand tracts
§ Top 20% of tracts in inquiry volume
§ Average of 800 inquiries per tract
617.401.7662 www.GrayAssociates.com 32
GRAY For more information please contact Bob Atkins. Email: [email protected]
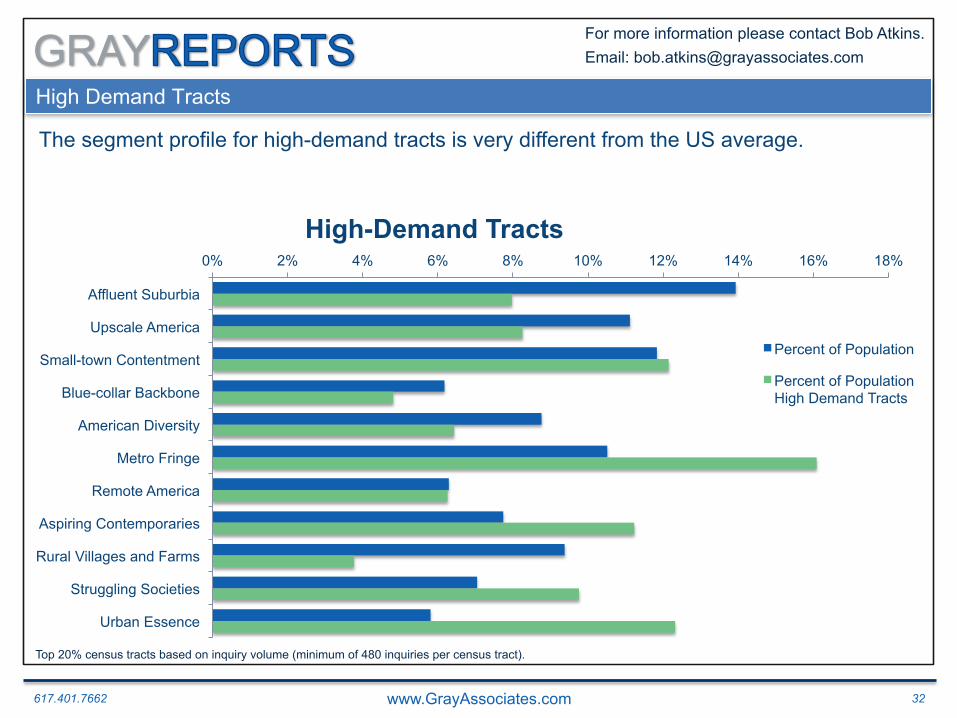
High Demand Tracts
The segment profile for high-demand tracts is very different from the US average.
0% 2% 4% 6% 8% 10% 12% 14% 16% 18%
Affluent Suburbia
Upscale America
Small-town Contentment
Blue-collar Backbone
American Diversity
Metro Fringe
Remote America
Aspiring Contemporaries
Rural Villages and Farms
Struggling Societies
Urban Essence
High-Demand Tracts
Percent of Population
Percent of Population High Demand Tracts
Top 20% census tracts based on inquiry volume (minimum of 480 inquiries per census tract).
617.401.7662 www.GrayAssociates.com 33
GRAY For more information please contact Bob Atkins. Email: [email protected]
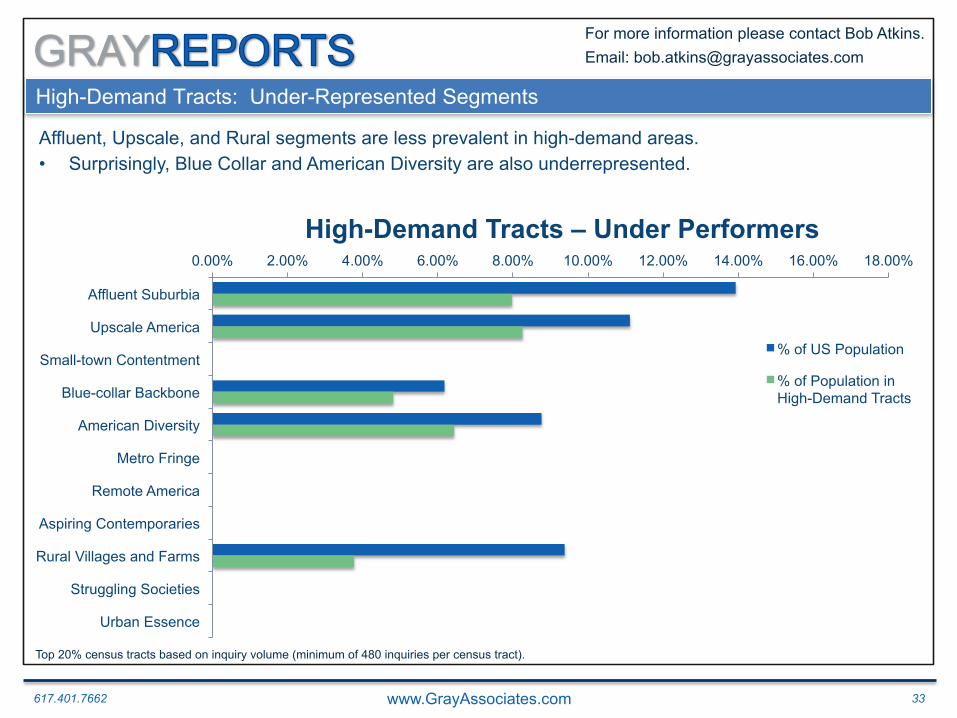
High-Demand Tracts: Under-Represented Segments
Affluent, Upscale, and Rural segments are less prevalent in high-demand areas. • Surprisingly, Blue Collar and American Diversity are also underrepresented.
0.00% 2.00% 4.00% 6.00% 8.00% 10.00% 12.00% 14.00% 16.00% 18.00%
Affluent Suburbia
Upscale America
Small-town Contentment
Blue-collar Backbone
American Diversity
Metro Fringe
Remote America
Aspiring Contemporaries
Rural Villages and Farms
Struggling Societies
Urban Essence
High-Demand Tracts – Under Performers
% of US Population
% of Population in High-Demand Tracts
Top 20% census tracts based on inquiry volume (minimum of 480 inquiries per census tract).
617.401.7662 www.GrayAssociates.com 34
GRAY For more information please contact Bob Atkins. Email: [email protected]
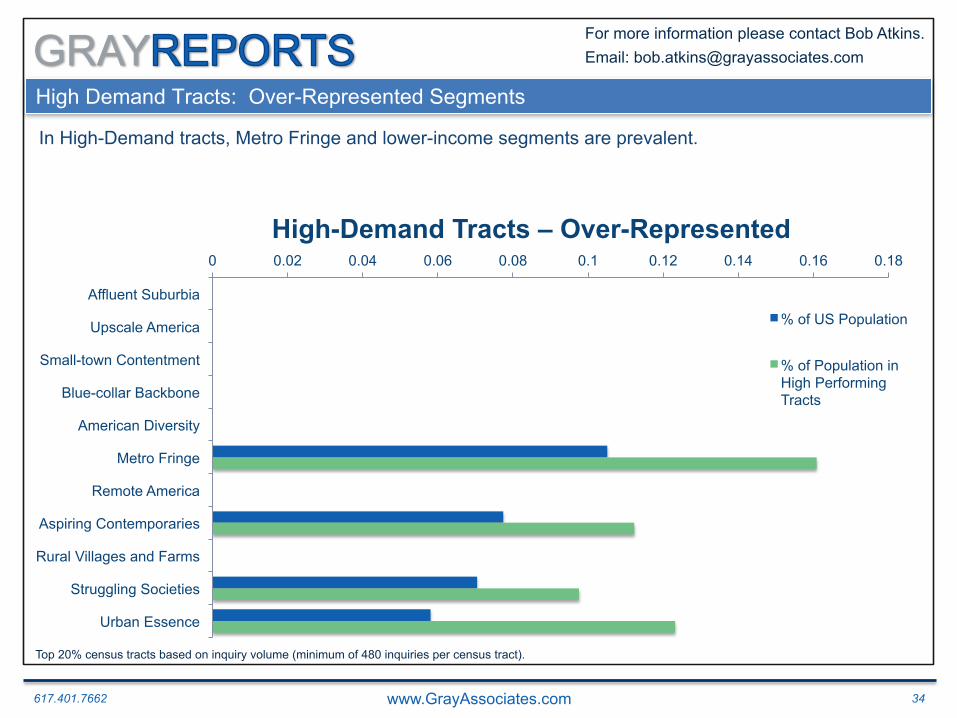
High Demand Tracts: Over-Represented Segments
In High-Demand tracts, Metro Fringe and lower-income segments are prevalent.
0 0.02 0.04 0.06 0.08 0.1 0.12 0.14 0.16 0.18
Affluent Suburbia
Upscale America
Small-town Contentment
Blue-collar Backbone
American Diversity
Metro Fringe
Remote America
Aspiring Contemporaries
Rural Villages and Farms
Struggling Societies
Urban Essence
High-Demand Tracts – Over-Represented
% of US Population
% of Population in High Performing Tracts
Top 20% census tracts based on inquiry volume (minimum of 480 inquiries per census tract).
617.401.7662 www.GrayAssociates.com 35
GRAY For more information please contact Bob Atkins. Email: [email protected]
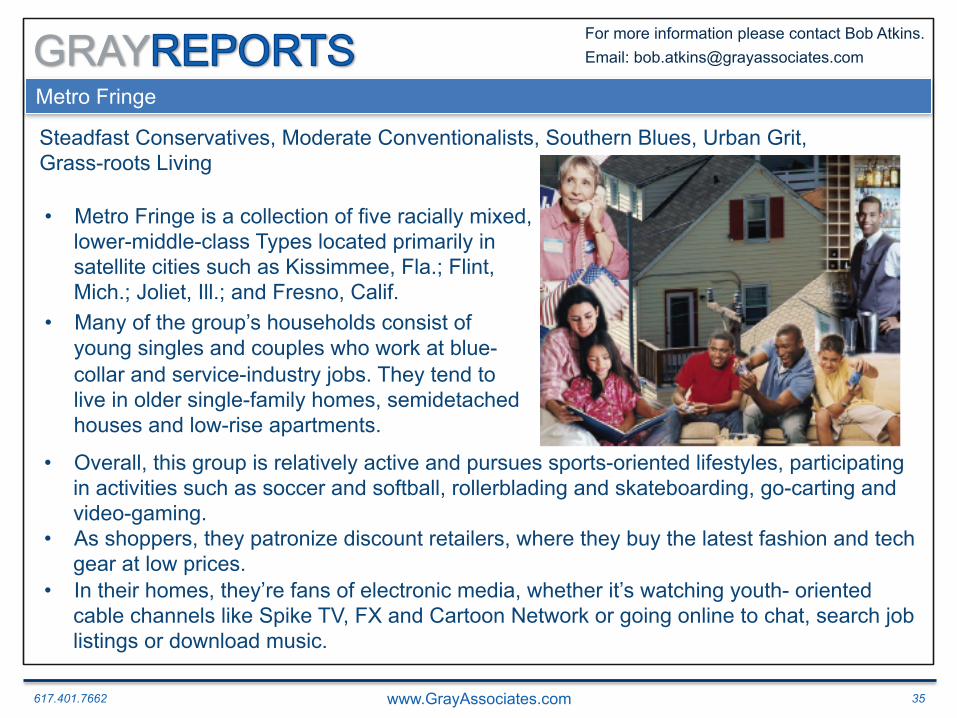
Metro Fringe
Steadfast Conservatives, Moderate Conventionalists, Southern Blues, Urban Grit, Grass-roots Living
• Metro Fringe is a collection of five racially mixed, lower-middle-class Types located primarily in satellite cities such as Kissimmee, Fla.; Flint, Mich.; Joliet, Ill.; and Fresno, Calif.
• Many of the group’s households consist of young singles and couples who work at blue-collar and service-industry jobs. They tend to live in older single-family homes, semidetached houses and low-rise apartments.
• Overall, this group is relatively active and pursues sports-oriented lifestyles, participating in activities such as soccer and softball, rollerblading and skateboarding, go-carting and video-gaming.
• As shoppers, they patronize discount retailers, where they buy the latest fashion and tech gear at low prices.
• In their homes, they’re fans of electronic media, whether it’s watching youth- oriented cable channels like Spike TV, FX and Cartoon Network or going online to chat, search job listings or download music.
617.401.7662 www.GrayAssociates.com 36
GRAY For more information please contact Bob Atkins. Email: [email protected]
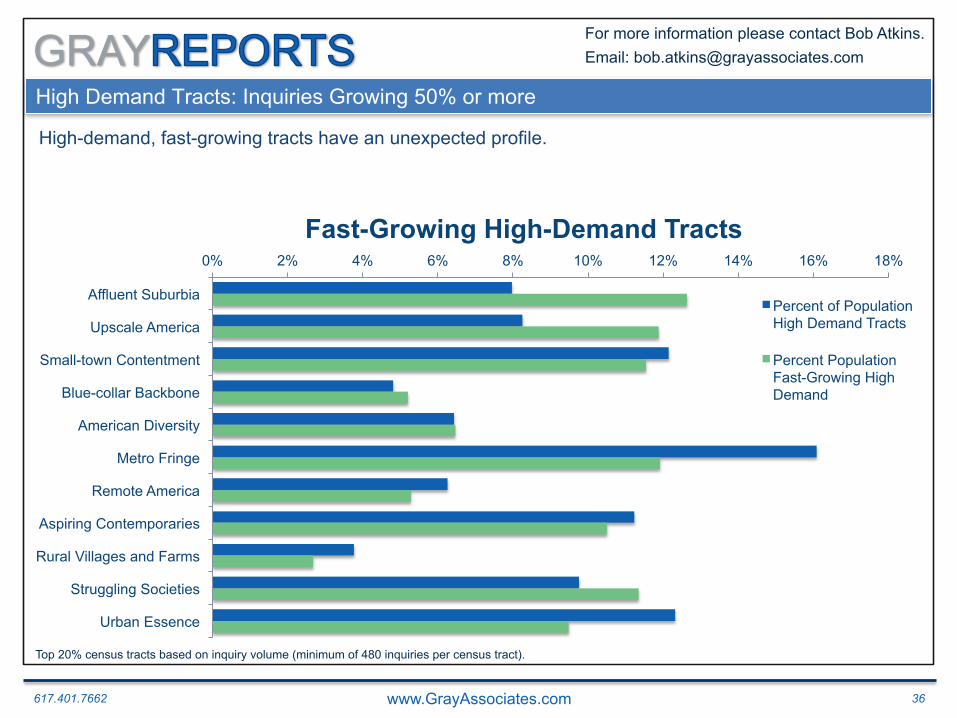
High Demand Tracts: Inquiries Growing 50% or more
High-demand, fast-growing tracts have an unexpected profile.
0% 2% 4% 6% 8% 10% 12% 14% 16% 18%
Affluent Suburbia
Upscale America
Small-town Contentment
Blue-collar Backbone
American Diversity
Metro Fringe
Remote America
Aspiring Contemporaries
Rural Villages and Farms
Struggling Societies
Urban Essence
Fast-Growing High-Demand Tracts
Percent of Population High Demand Tracts
Percent Population Fast-Growing High Demand
Top 20% census tracts based on inquiry volume (minimum of 480 inquiries per census tract).
617.401.7662 www.GrayAssociates.com 37
GRAY For more information please contact Bob Atkins. Email: [email protected]
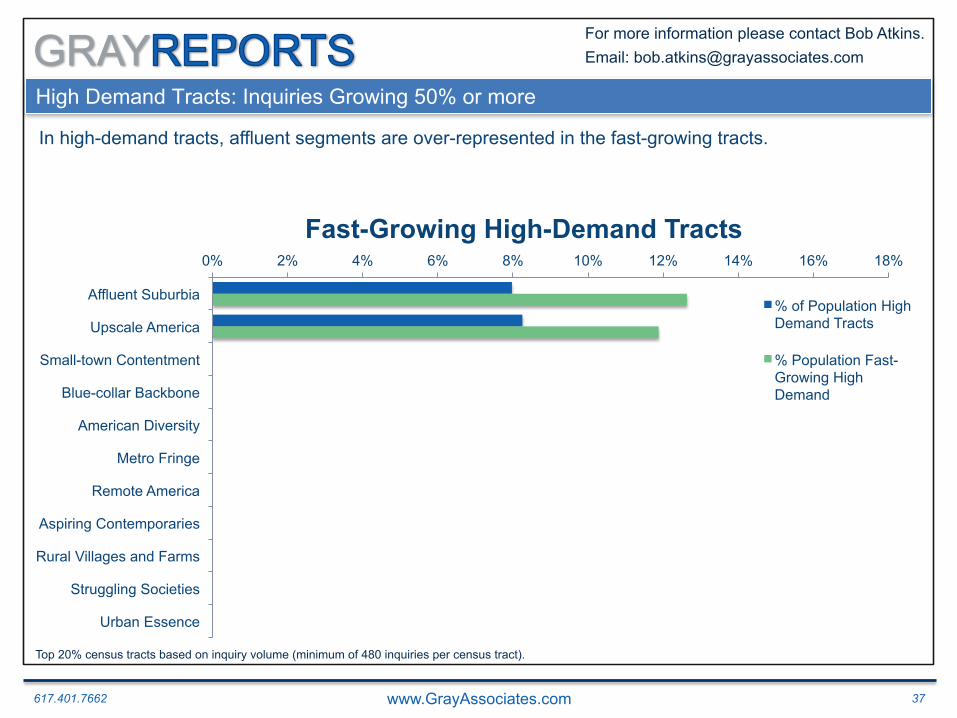
High Demand Tracts: Inquiries Growing 50% or more
In high-demand tracts, affluent segments are over-represented in the fast-growing tracts.
0% 2% 4% 6% 8% 10% 12% 14% 16% 18%
Affluent Suburbia
Upscale America
Small-town Contentment
Blue-collar Backbone
American Diversity
Metro Fringe
Remote America
Aspiring Contemporaries
Rural Villages and Farms
Struggling Societies
Urban Essence
Fast-Growing High-Demand Tracts
% of Population High Demand Tracts
% Population Fast-Growing High Demand
Top 20% census tracts based on inquiry volume (minimum of 480 inquiries per census tract).
617.401.7662 www.GrayAssociates.com 38
GRAY For more information please contact Bob Atkins. Email: [email protected]
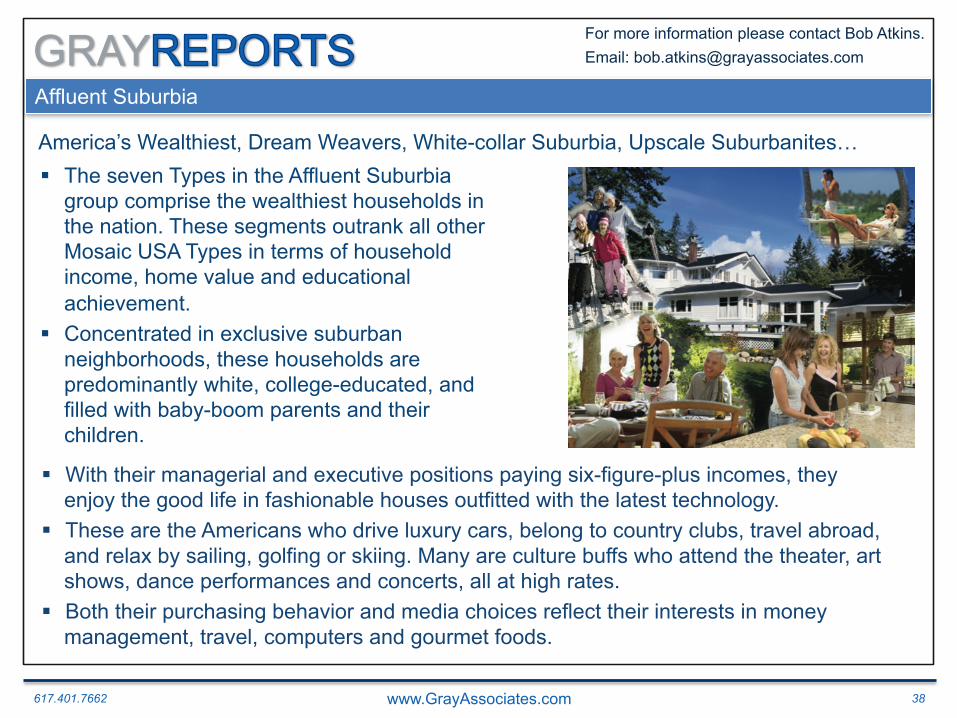
Affluent Suburbia
America’s Wealthiest, Dream Weavers, White-collar Suburbia, Upscale Suburbanites… § The seven Types in the Affluent Suburbia
group comprise the wealthiest households in the nation. These segments outrank all other Mosaic USA Types in terms of household income, home value and educational achievement.
§ Concentrated in exclusive suburban neighborhoods, these households are predominantly white, college-educated, and filled with baby-boom parents and their children.
§ With their managerial and executive positions paying six-figure-plus incomes, they enjoy the good life in fashionable houses outfitted with the latest technology.
§ These are the Americans who drive luxury cars, belong to country clubs, travel abroad, and relax by sailing, golfing or skiing. Many are culture buffs who attend the theater, art shows, dance performances and concerts, all at high rates.
§ Both their purchasing behavior and media choices reflect their interests in money management, travel, computers and gourmet foods.
617.401.7662 www.GrayAssociates.com 39
GRAY For more information please contact Bob Atkins. Email: [email protected]
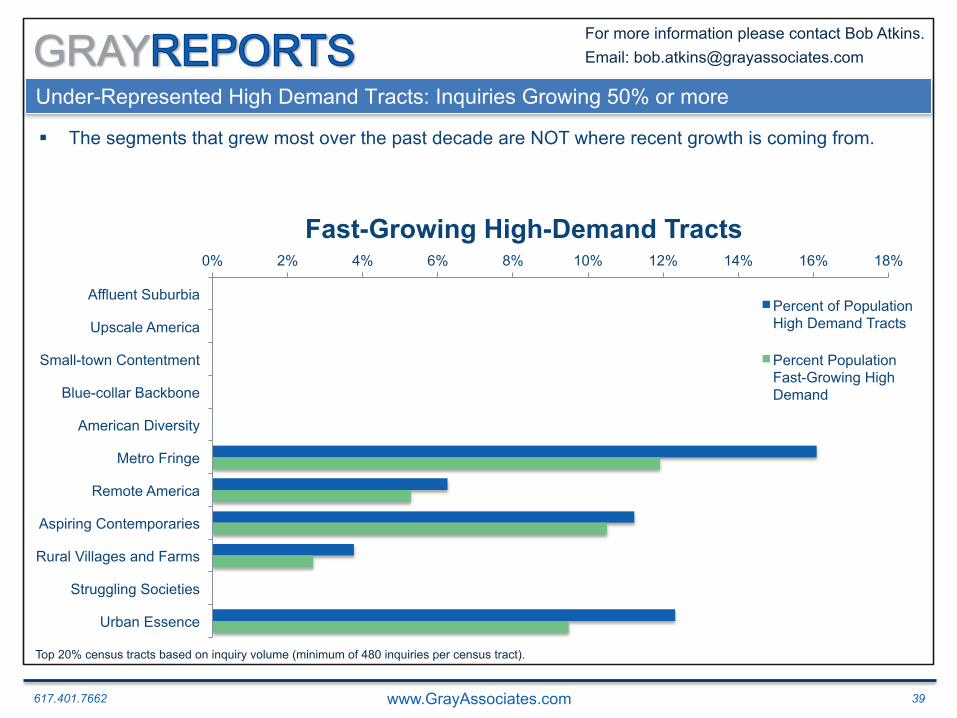
Under-Represented High Demand Tracts: Inquiries Growing 50% or more
§ The segments that grew most over the past decade are NOT where recent growth is coming from.
0% 2% 4% 6% 8% 10% 12% 14% 16% 18%
Affluent Suburbia
Upscale America
Small-town Contentment
Blue-collar Backbone
American Diversity
Metro Fringe
Remote America
Aspiring Contemporaries
Rural Villages and Farms
Struggling Societies
Urban Essence
Fast-Growing High-Demand Tracts
Percent of Population High Demand Tracts
Percent Population Fast-Growing High Demand
Top 20% census tracts based on inquiry volume (minimum of 480 inquiries per census tract).
617.401.7662 www.GrayAssociates.com 40
GRAY For more information please contact Bob Atkins. Email: [email protected]
Agenda
1. Introduction
2. Demand: National Overview
3. Demand for On-Line Programs
4. Demand for On-Ground Programs
5. Demand by Program and City
6. Demand by Consumer Segment
7. Summary
617.401.7662 www.GrayAssociates.com 41
GRAY For more information please contact Bob Atkins. Email: [email protected]
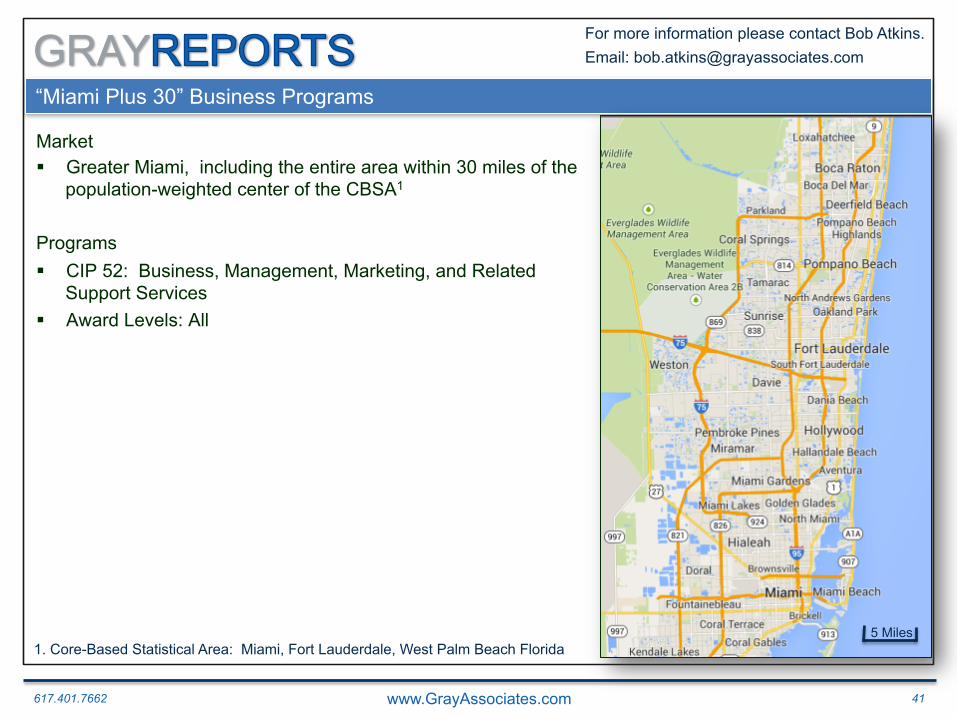
“Miami Plus 30” Business Programs
Market § Greater Miami, including the entire area within 30 miles of the
population-weighted center of the CBSA1
Programs § CIP 52: Business, Management, Marketing, and Related
Support Services § Award Levels: All
5 Miles 1. Core-Based Statistical Area: Miami, Fort Lauderdale, West Palm Beach Florida
617.401.7662 www.GrayAssociates.com 42
GRAY For more information please contact Bob Atkins. Email: [email protected]
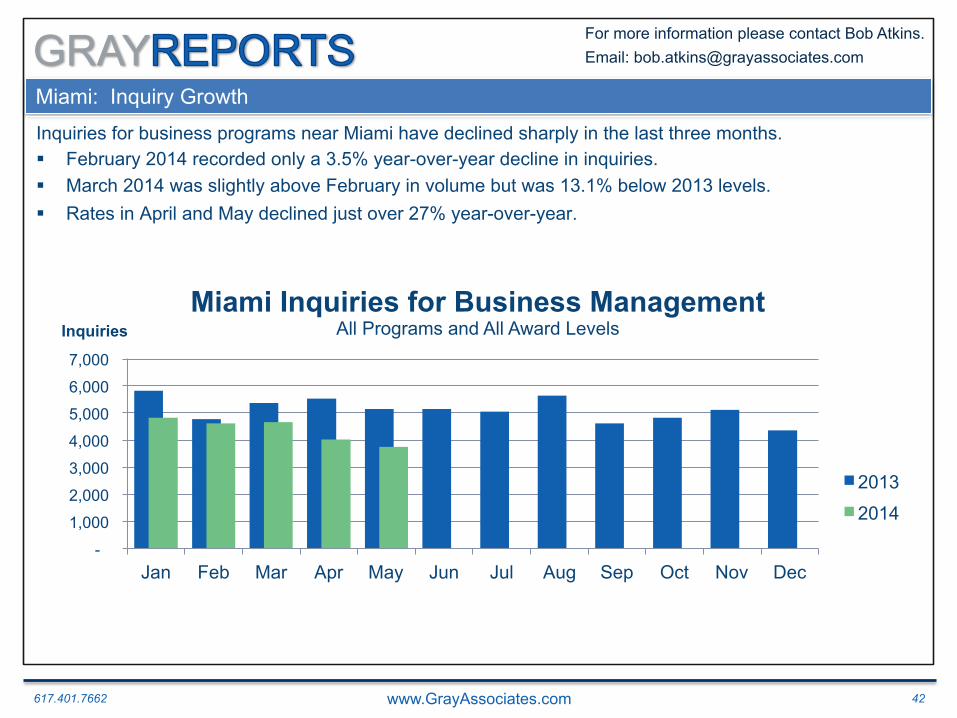
Miami: Inquiry Growth
Inquiries for business programs near Miami have declined sharply in the last three months. § February 2014 recorded only a 3.5% year-over-year decline in inquiries. § March 2014 was slightly above February in volume but was 13.1% below 2013 levels. § Rates in April and May declined just over 27% year-over-year.
2012
-
1,000
2,000
3,000
4,000
5,000
6,000
7,000
Jan Feb Mar Apr May Jun Jul Aug Sep Oct Nov Dec
Inquiries Miami Inquiries for Business Management
All Programs and All Award Levels
2013
2014
617.401.7662 www.GrayAssociates.com 43
GRAY For more information please contact Bob Atkins. Email: [email protected]
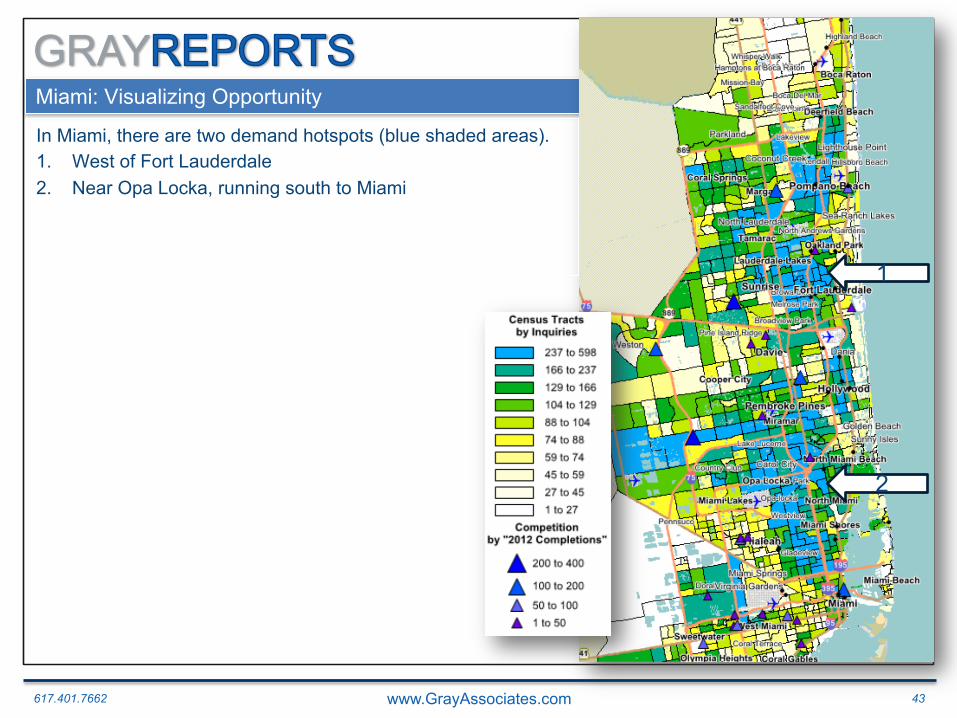
Miami: Visualizing Opportunity
In Miami, there are two demand hotspots (blue shaded areas). 1. West of Fort Lauderdale 2. Near Opa Locka, running south to Miami
2
1
617.401.7662 www.GrayAssociates.com 44
GRAY For more information please contact Bob Atkins. Email: [email protected]
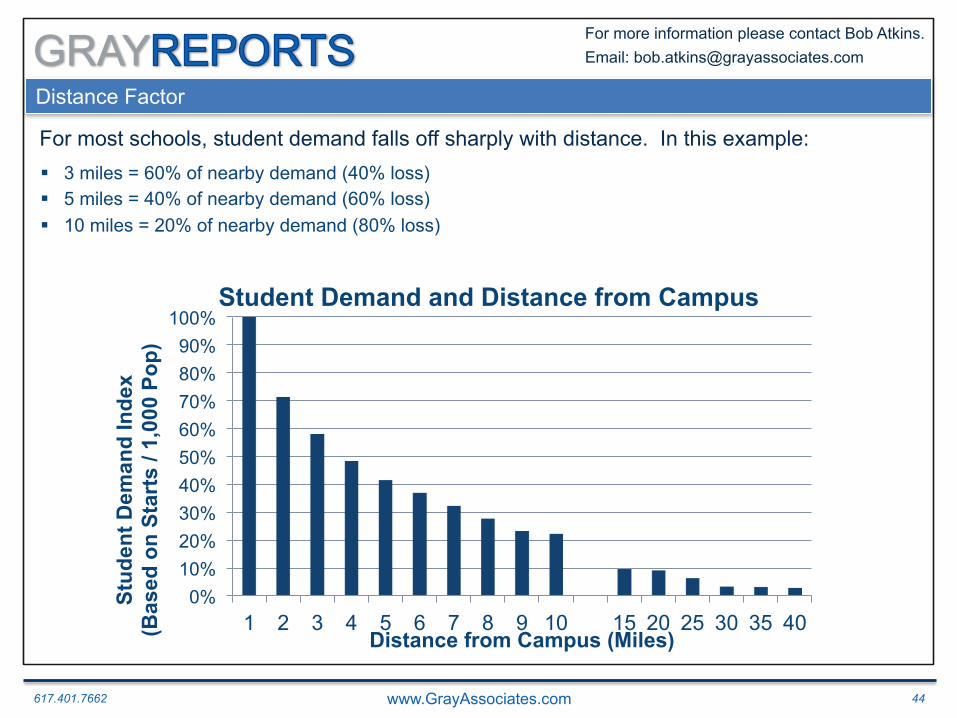
Distance Factor
§ 3 miles = 60% of nearby demand (40% loss) § 5 miles = 40% of nearby demand (60% loss) § 10 miles = 20% of nearby demand (80% loss)
For most schools, student demand falls off sharply with distance. In this example:
0% 10% 20% 30% 40% 50% 60% 70% 80% 90%
100%
1 2 3 4 5 6 7 8 9 10 15 20 25 30 35 40
Stud
ent D
eman
d In
dex
(Bas
ed o
n St
arts
/ 1,
000
Pop)
Distance from Campus (Miles)
Student Demand and Distance from Campus
617.401.7662 www.GrayAssociates.com 45
GRAY For more information please contact Bob Atkins. Email: [email protected]
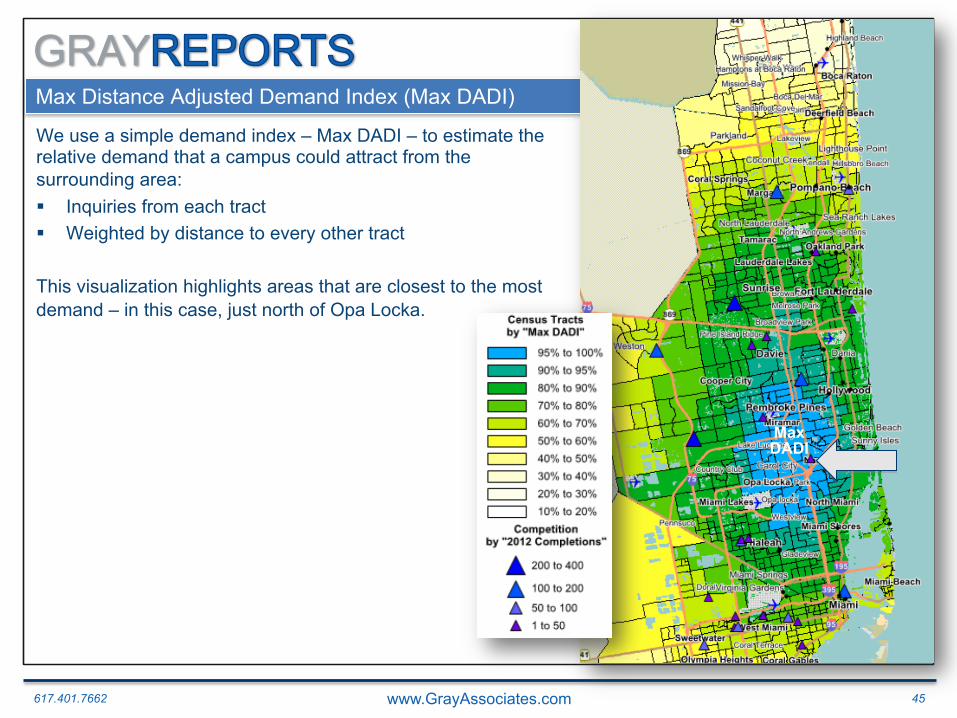
Max Distance Adjusted Demand Index (Max DADI)
We use a simple demand index – Max DADI – to estimate the relative demand that a campus could attract from the surrounding area: § Inquiries from each tract § Weighted by distance to every other tract This visualization highlights areas that are closest to the most demand – in this case, just north of Opa Locka.
Max DADI
617.401.7662 www.GrayAssociates.com 46
GRAY For more information please contact Bob Atkins. Email: [email protected]
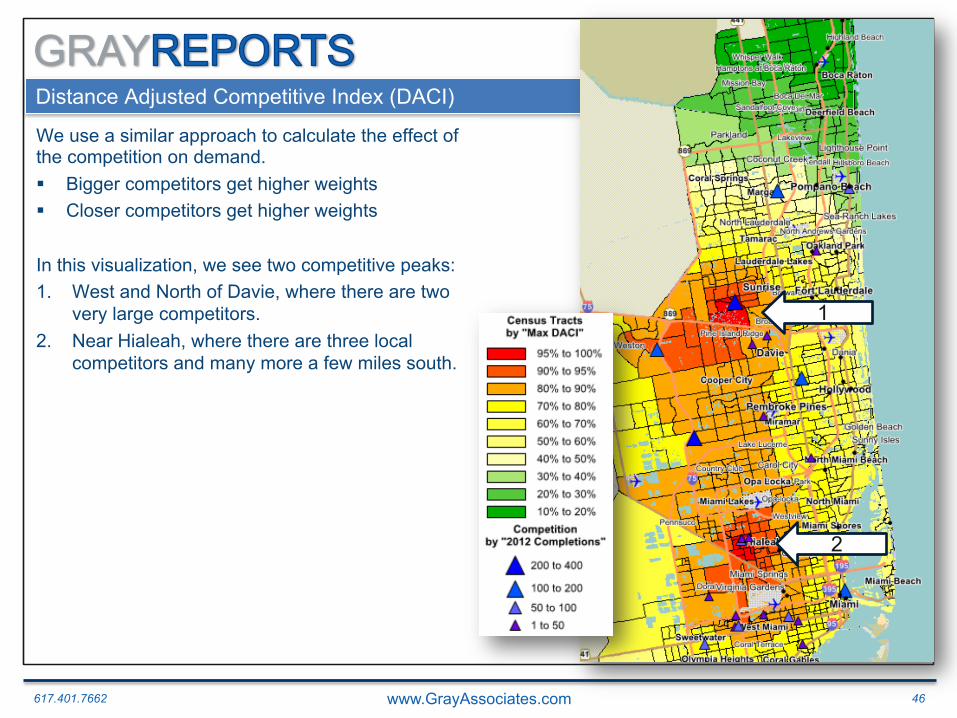
Distance Adjusted Competitive Index (DACI)
We use a similar approach to calculate the effect of the competition on demand. § Bigger competitors get higher weights § Closer competitors get higher weights
In this visualization, we see two competitive peaks: 1. West and North of Davie, where there are two
very large competitors. 2. Near Hialeah, where there are three local
competitors and many more a few miles south.
1
2
617.401.7662 www.GrayAssociates.com 47
GRAY For more information please contact Bob Atkins. Email: [email protected]
Distance Adjusted Competitive Index (DACI)
Purpose: § Identify under-performing areas § Determine their characteristics § Enable targeted marketing efforts to capture
opportunity
Method § Start with industry inquiry volumes § Estimate “expected share” of inquiries based on:
§ Market inquiries for relevant programs § Distance from campus § Competitive intensity (DACI)
§ Compare actual inquiries to expected share of market inquiries
§ Explore areas where actuals are less than expected
617.401.7662 www.GrayAssociates.com 48
GRAY For more information please contact Bob Atkins. Email: [email protected]
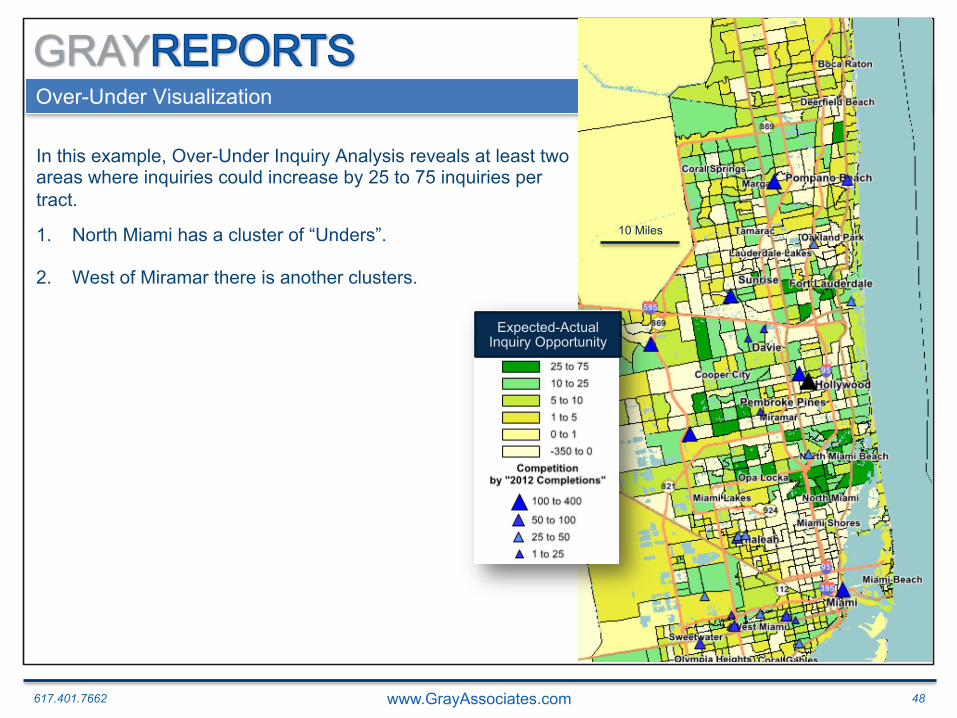
Over-Under Visualization
In this example, Over-Under Inquiry Analysis reveals at least two areas where inquiries could increase by 25 to 75 inquiries per tract.
1. North Miami has a cluster of “Unders”.
2. West of Miramar there is another clusters.
1
10 Miles
Expected-Actual Inquiry Opportunity

617.401.7662 www.GrayAssociates.com 49
GRAY For more information please contact Bob Atkins. Email: [email protected]
Miami: Over-Under Analysis
The “Unders” show clear differences by segment. § Heavier concentrations of Affluent Surburbia and American Diversity § Fewer Metro Fringe and Aspiring Contemporaries
0% 5% 10% 15% 20% 25% 30% 35% 40%
Affluent Suburbia
Upscale America
Small-town
Blue-collar Backbone
American Diversity
Metro Fringe
Remote America
Aspiring
Rural Villages and
Struggling Societies
Urban Essence
Varying Lifestyles
Miami Campus 10-Miles
Miami Campus 10-mile Under-Performing by 5% or More
Under-Over Analysis by Mosaic Segment

617.401.7662 www.GrayAssociates.com 50
GRAY For more information please contact Bob Atkins. Email: [email protected]
Agenda
1. Introduction
2. Demand: National Overview
3. Demand for On-Line Programs
4. Demand for On-Ground Programs
5. Demand by Program and City
6. Demand by Consumer Segment
7. Summary
617.401.7662 www.GrayAssociates.com 51
GRAY For more information please contact Bob Atkins. Email: [email protected]
Key Findings
1. Several long-term market trends appear to be reversing.
§ Inquiries are down 19% for On-line Programs.
§ Inquiries for on-ground programs increased over 20% in May.
§ Cost per application is up over 2013, but less so in the last few months.
§ Low-income, urban, minority segments may be declining.
§ Affluent Segments may be showing more interest in career colleges.
617.401.7662 www.GrayAssociates.com 52
GRAY For more information please contact Bob Atkins. Email: [email protected]
How do I get Information for My Locations and Programs?
Gray Reports is offered as an annual subscription. § Customized for your locations § Customized for your programs § Monthly PDF overview of inquiry, application, and pricing tends in your markets § On-line access to your market data by program, campus, veteran’s status, years since
high school and other factors
617.401.7662 www.GrayAssociates.com 53
GRAY For more information please contact Bob Atkins. Email: [email protected]
Questions and Contacts
Please feel free to contact me: Bob Atkins
CEO Gray Associates, Inc.
617-401-7662
For the presentation or a recording of the session, please visit: GrayAssociates.com
617.401.7662 www.GrayAssociates.com 54
GRAY For more information please contact Bob Atkins. Email: [email protected]
Aspiring Contemporaries
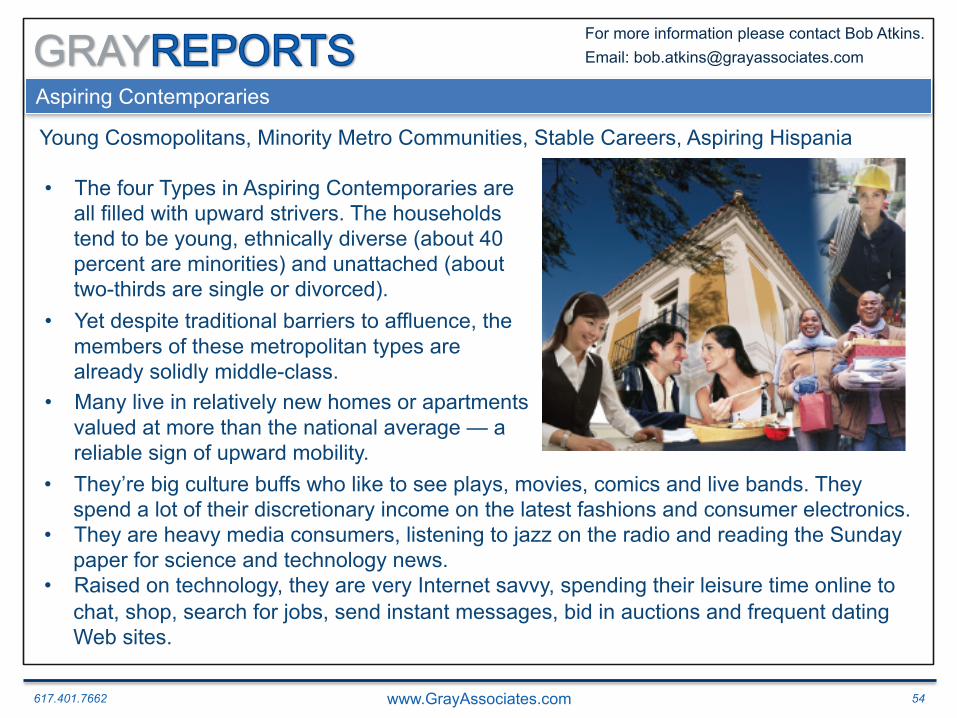
Young Cosmopolitans, Minority Metro Communities, Stable Careers, Aspiring Hispania
• The four Types in Aspiring Contemporaries are all filled with upward strivers. The households tend to be young, ethnically diverse (about 40 percent are minorities) and unattached (about two-thirds are single or divorced).
• Yet despite traditional barriers to affluence, the members of these metropolitan types are already solidly middle-class.
• Many live in relatively new homes or apartments valued at more than the national average — a reliable sign of upward mobility.
• They’re big culture buffs who like to see plays, movies, comics and live bands. They spend a lot of their discretionary income on the latest fashions and consumer electronics.
• They are heavy media consumers, listening to jazz on the radio and reading the Sunday paper for science and technology news.
• Raised on technology, they are very Internet savvy, spending their leisure time online to chat, shop, search for jobs, send instant messages, bid in auctions and frequent dating Web sites.