2017 february grayreports - demand trends in higher education
TRANSCRIPT

GRAYREPORTS Demand for Higher Education Programs
www.GrayAssociates.com
Results through February 2017

617.366.2838 www.GrayAssociates.com 2
GRAY For more information please contact Gray Associates. Email: [email protected]
Who Is Gray?
Program and Market Evaluation Data
Employment
Placement Rates
Student Inquiries
Demographics
Job Postings
Programs Price Projects Place § Program Evaluation
System § Program profiles § Program development
§ City targeting § Location selection § Campus consolidation
§ Price elasticity § Price positioning § Price optimization
§ Business strategy § Strategy implementation § Acquisition analysis § Complex analytics
Advanced Analytics Predictive Models
Geo-Analytics
Clients: Higher Education Institutions and Stakeholders
Competition
Enhanced Crosswalks
617.366.2838 www.GrayAssociates.com 3
GRAY For more information please contact Gray Associates. Email: [email protected]
Agenda
1. Demand Trends: Inquiries, Conversions, and Google Searches
1. National
2. Online and On-Campus
3. Degree and Channel
4. City and Program
2. Job Postings
3. NHE: Benchmarking Institute
4. Summary
617.366.2838 www.GrayAssociates.com 4
GRAY For more information please contact Gray Associates. Email: [email protected]
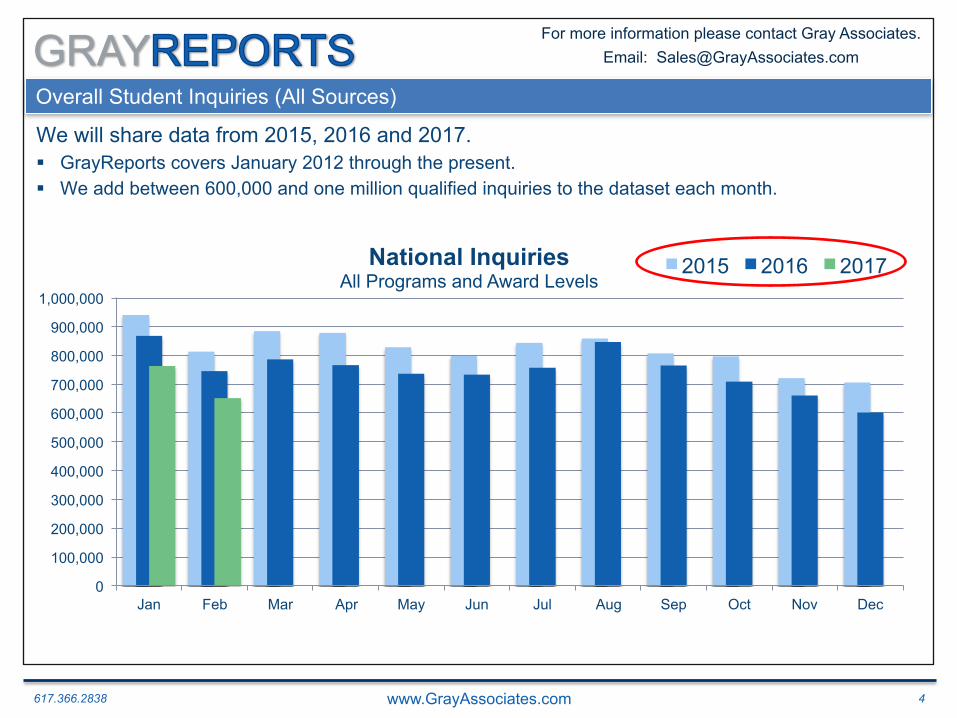
Overall Student Inquiries (All Sources)
We will share data from 2015, 2016 and 2017. § GrayReports covers January 2012 through the present. § We add between 600,000 and one million qualified inquiries to the dataset each month. Introduce how to read
chart: years and colors Report Monthly to account for seasonality
0
100,000
200,000
300,000
400,000
500,000
600,000
700,000
800,000
900,000
1,000,000
Jan Feb Mar Apr May Jun Jul Aug Sep Oct Nov Dec
National Inquiries All Programs and Award Levels
2015 2016 2017
617.366.2838 www.GrayAssociates.com 5
GRAY For more information please contact Gray Associates. Email: [email protected]
0
100,000
200,000
300,000
400,000
500,000
600,000
700,000
800,000
900,000
1,000,000
Jan Feb Mar Apr May Jun Jul Aug Sep Oct Nov Dec
National Inquiries All Programs and Award Levels
2015 2016 2017
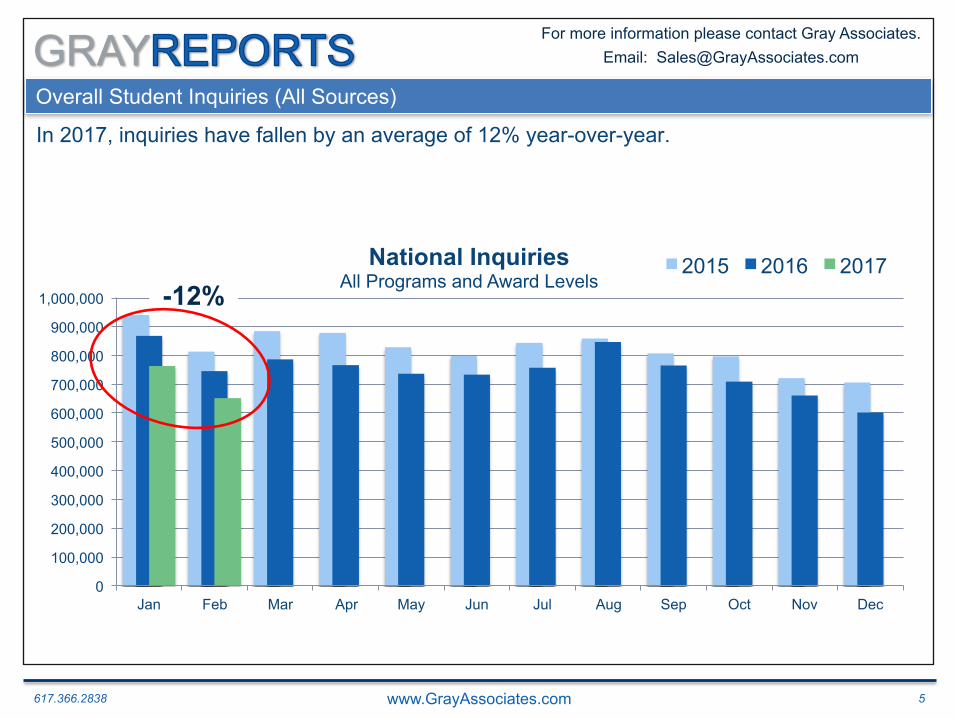
Overall Student Inquiries (All Sources)
In 2017, inquiries have fallen by an average of 12% year-over-year.
-12%

617.366.2838 www.GrayAssociates.com 6
GRAY For more information please contact Gray Associates. Email: [email protected]
0
100,000
200,000
300,000
400,000
500,000
600,000
700,000
800,000
900,000
1,000,000
Jan Feb Mar Apr May Jun Jul Aug Sep Oct Nov Dec
National Inquiries All Programs and Award Levels
2015 2016 2017
Overall Student Inquiries (All Sources)
In February, inquiry volumes dropped another 12%.
5% is a little worse than last month’s 1% decline, but better than this year’s average 8% decline.
-12% YoY

617.366.2838 www.GrayAssociates.com 7
GRAY For more information please contact Gray Associates. Email: [email protected]
External Inquiries: Definition
Third party web sites attract students, who fill out inquiry forms. This inquiry data is sold to colleges.
617.366.2838 www.GrayAssociates.com 8
GRAY For more information please contact Gray Associates. Email: [email protected]
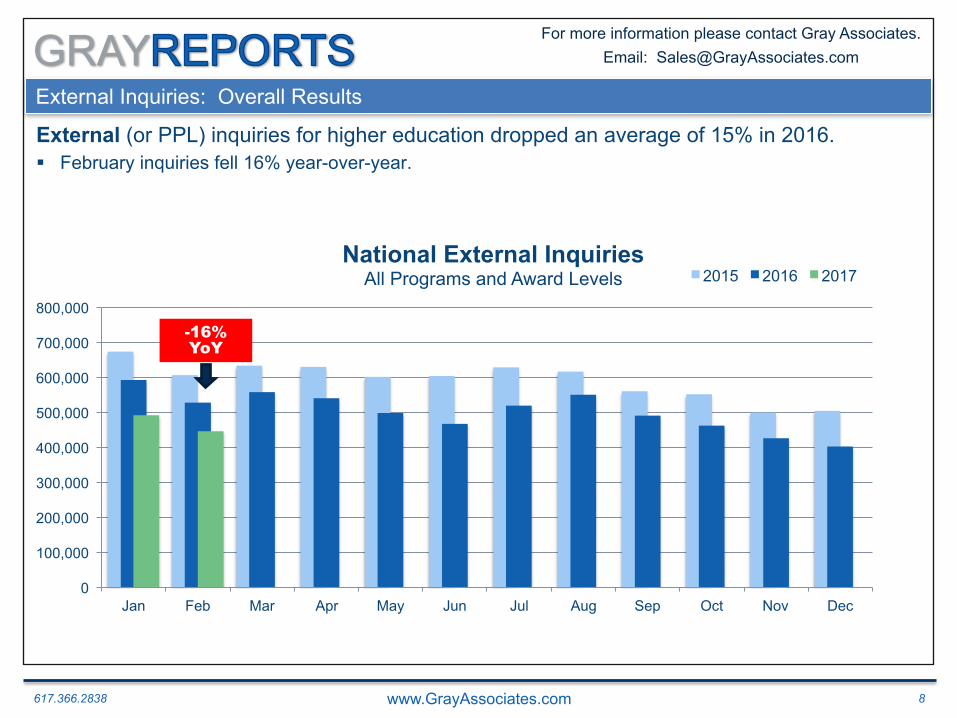
External Inquiries: Overall Results
External (or PPL) inquiries for higher education dropped an average of 15% in 2016. § February inquiries fell 16% year-over-year.
0
100,000
200,000
300,000
400,000
500,000
600,000
700,000
800,000
Jan Feb Mar Apr May Jun Jul Aug Sep Oct Nov Dec
National External Inquiries All Programs and Award Levels 2015 2016 2017
Define External Inquiries: Inquiries from a third-party site that generates inquiries for higher education.
-16% YoY
617.366.2838 www.GrayAssociates.com 9
GRAY For more information please contact Gray Associates. Email: [email protected]
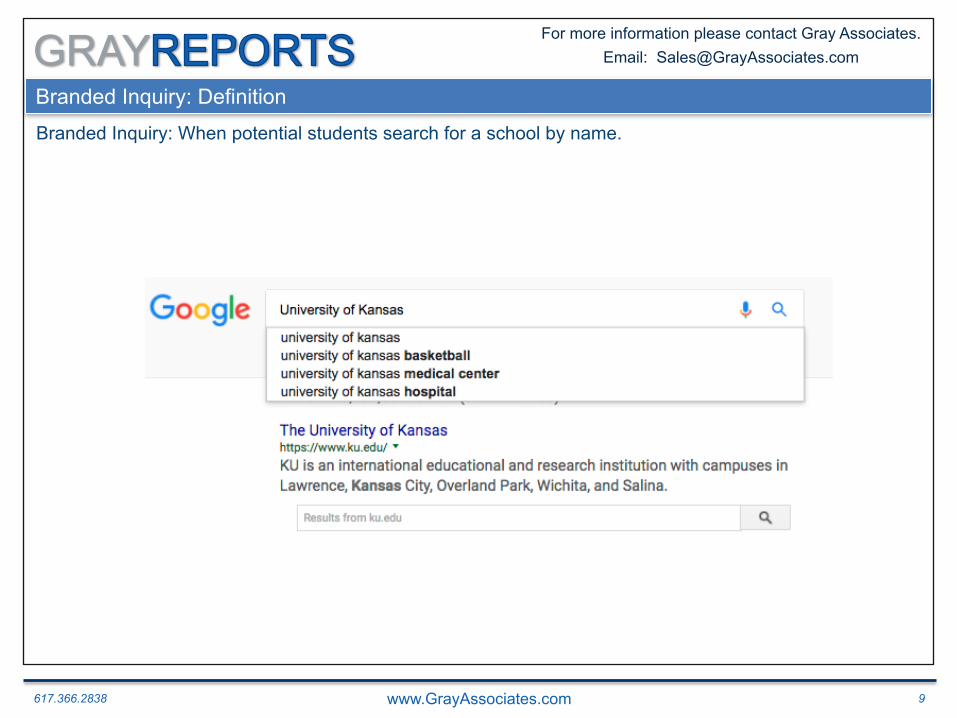
Branded Inquiry: Definition
Branded Inquiry: When potential students search for a school by name.
617.366.2838 www.GrayAssociates.com 10
GRAY For more information please contact Gray Associates. Email: [email protected]
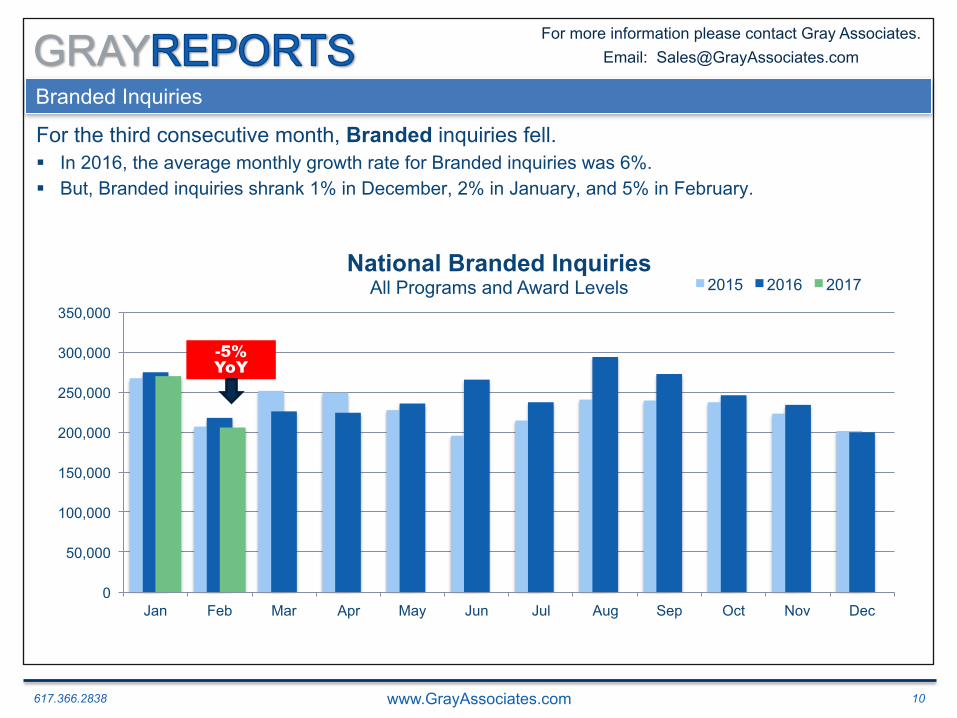
Branded Inquiries
For the third consecutive month, Branded inquiries fell. § In 2016, the average monthly growth rate for Branded inquiries was 6%. § But, Branded inquiries shrank 1% in December, 2% in January, and 5% in February.
0
50,000
100,000
150,000
200,000
250,000
300,000
350,000
Jan Feb Mar Apr May Jun Jul Aug Sep Oct Nov Dec
National Branded Inquiries All Programs and Award Levels 2015 2016 2017
-5% YoY
617.366.2838 www.GrayAssociates.com 11
GRAY For more information please contact Gray Associates. Email: [email protected]
80 85 90 95
100 105 110 115 120 125 130
Q1 2014 Q2 2014 Q3 2014 Q4 2014 Q1 2015 Q2 2015 Q3 2015 Q4 2015 Q1 2016 Q2 2016 Q3 2016 Q4 2016
Overall Inquiry Conversion Rates: Trends (Indexed to Q1 2014)
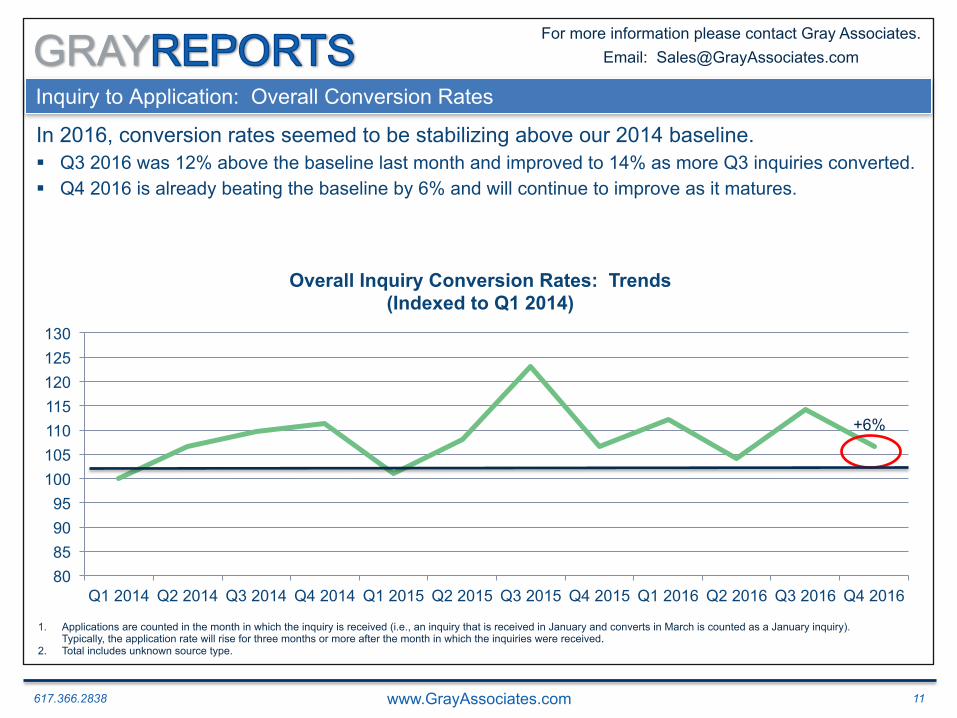
Inquiry to Application: Overall Conversion Rates
In 2016, conversion rates seemed to be stabilizing above our 2014 baseline. § Q3 2016 was 12% above the baseline last month and improved to 14% as more Q3 inquiries converted. § Q4 2016 is already beating the baseline by 6% and will continue to improve as it matures.
1. Applications are counted in the month in which the inquiry is received (i.e., an inquiry that is received in January and converts in March is counted as a January inquiry). Typically, the application rate will rise for three months or more after the month in which the inquiries were received.
2. Total includes unknown source type.
+6%

617.366.2838 www.GrayAssociates.com 12
GRAY For more information please contact Gray Associates. Email: [email protected]
Overall Student Inquiry Conversions (All Sources)
For November 2016 inquiries, total conversions fell 8% year-over-year. § It now takes six months for conversions to fully mature. § November’s 8% decline is a considerable improvement on the 16% drop in October 2016.
1. Applications are counted in the month in which the inquiry was received (i.e., an inquiry that is received in January and converts in March will be counted as a January inquiry). Typically, the application rate will rise for at least three months after the month in which the inquiries were received.
0 5,000
10,000 15,000 20,000 25,000 30,000 35,000 40,000
Jan Feb Mar Apr May Jun Jul Aug Sep Oct Nov Dec
Total Inquiry Conversions All Programs and Award Levels
2015 2016 2017
Explain Conversion Timing: Conversions are counted in the month in which the original inquiry is received. If a June inquiry converts I August, it is counted as a June Conversion. Typically, inquires take 13 months to mature (or reach their maximum conversion rate. More recently, conversions are taking longer, sometimes 5-6 months after the inquiry.
-8% YoY Immature Months1

617.366.2838 www.GrayAssociates.com 13
GRAY For more information please contact Gray Associates. Email: [email protected]
Jan Feb Mar Apr May Jun Jul Aug Sep Oct Nov Dec 2015 $43.10 $43.50 $43.70 $43.61 $43.80 $43.63 $45.07 $44.75 $45.24 $44.92 $44.67 $44.75 2016 $45.11 $45.91 $44.79 $44.85 $42.47 $44.97 $44.39 $44.53 $45.13 $44.77 $44.89 $45.55 2017 $45.41 $45.42 $- $- $- $- $- $- $- $- $- $-
$30 $32 $34 $36 $38 $40 $42 $44 $46 $48
Average Price per Inquiry for PPI All Programs and Award Levels
Average Price for Pay-per-Inquiry
Since December, the average price of an External inquiry has been over $45. § For the first time in four months, the average price is down year-over-year; § But, February 2016 was the highest average price in four years.
Note: PPI means “Pay per Inquiry.” Inquiry price is the average price per inquiry from PPI.
-1%
617.366.2838 www.GrayAssociates.com 14
GRAY For more information please contact Gray Associates. Email: [email protected]
Agenda
1. Demand Trends: Inquiries, Conversions, and Google Searches
1. National
2. Online and On-Campus
3. Degree and Channel
4. City and Program
2. Job Postings
3. NHE: Benchmarking Institute
4. Summary

617.366.2838 www.GrayAssociates.com 15
GRAY For more information please contact Gray Associates. Email: [email protected]
0
50,000
100,000
150,000
200,000
250,000
300,000
Jan Feb Mar Apr May Jun Jul Aug Sep Oct Nov Dec
Inquiries
Inquiries for Online Programs All Programs and Award Levels 2015 2016 2017
Inquiries for Online Programs Education Industry Inquiries: YOY Percent Change Year-over-year, inquiries for online programs were flat in 2016.
+0.5%
617.366.2838 www.GrayAssociates.com 16
GRAY For more information please contact Gray Associates. Email: [email protected]
0
50,000
100,000
150,000
200,000
250,000
300,000
Jan Feb Mar Apr May Jun Jul Aug Sep Oct Nov Dec
Inquiries
Inquiries for Online Programs All Programs and Award Levels 2015 2016 2017
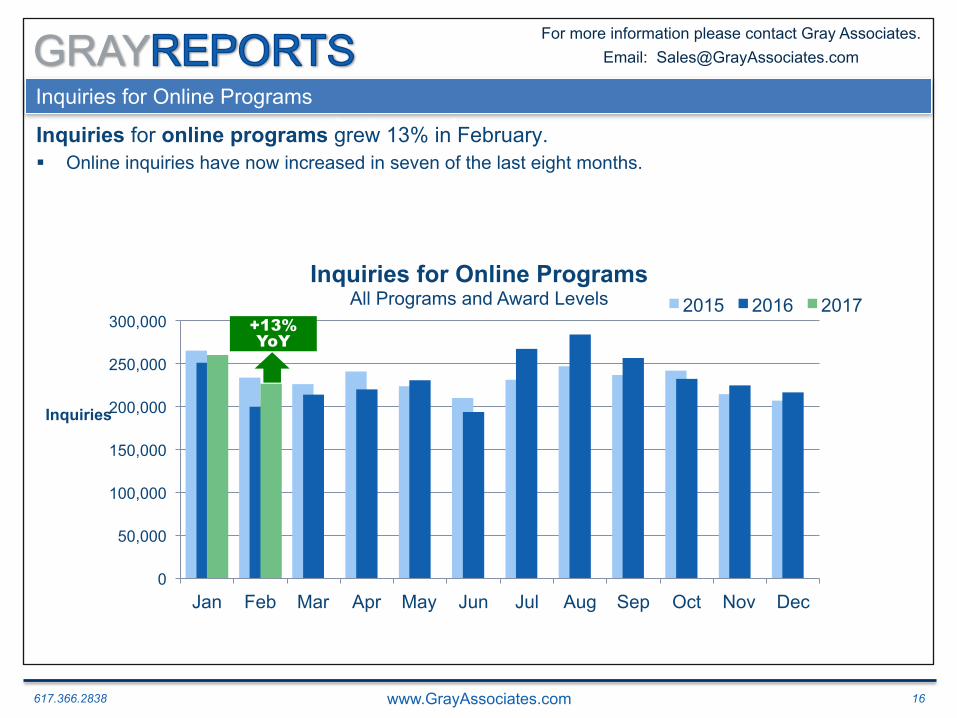
Inquiries for Online Programs Education Industry Inquiries: YOY Percent Change Inquiries for online programs grew 13% in February. § Online inquiries have now increased in seven of the last eight months.
+13% YoY

617.366.2838 www.GrayAssociates.com 17
GRAY For more information please contact Gray Associates. Email: [email protected]
Student Inquiry Conversions for Online Programs
Conversions for online higher education programs increased 36% in November. § This is the fourth consecutive increase in conversions.
0
2,000
4,000
6,000
8,000
10,000
12,000
Jan Feb Mar Apr May Jun Jul Aug Sep Oct Nov Dec
Inquiry Conversions for Online Programs All Programs and Award Levels
2015 2016 2017
1. Conversions are counted in the month in which the inquiry was received (i.e., an inquiry that is received in January and converts in March will be counted as a January conversion). Typically, conversion rates will rise for at least three months after the inquiries were received.
+36% YoY
Immature Months1

617.366.2838 www.GrayAssociates.com 18
GRAY For more information please contact Gray Associates. Email: [email protected]
Student Inquiry Conversions for Online Programs
Conversions for online higher education programs increased 36% in November. § December and January have already passed last year’s levels and February should also.
0
2,000
4,000
6,000
8,000
10,000
12,000
Jan Feb Mar Apr May Jun Jul Aug Sep Oct Nov Dec
Inquiry Conversions for Online Programs All Programs and Award Levels
2015 2016 2017
1. Conversions are counted in the month in which the inquiry was received (i.e., an inquiry that is received in January and converts in March will be counted as a January conversion). Typically, conversion rates will rise for at least three months after the inquiries were received.
Immature Months1
617.366.2838 www.GrayAssociates.com 19
GRAY For more information please contact Gray Associates. Email: [email protected]
Inquiries for On-Campus Programs
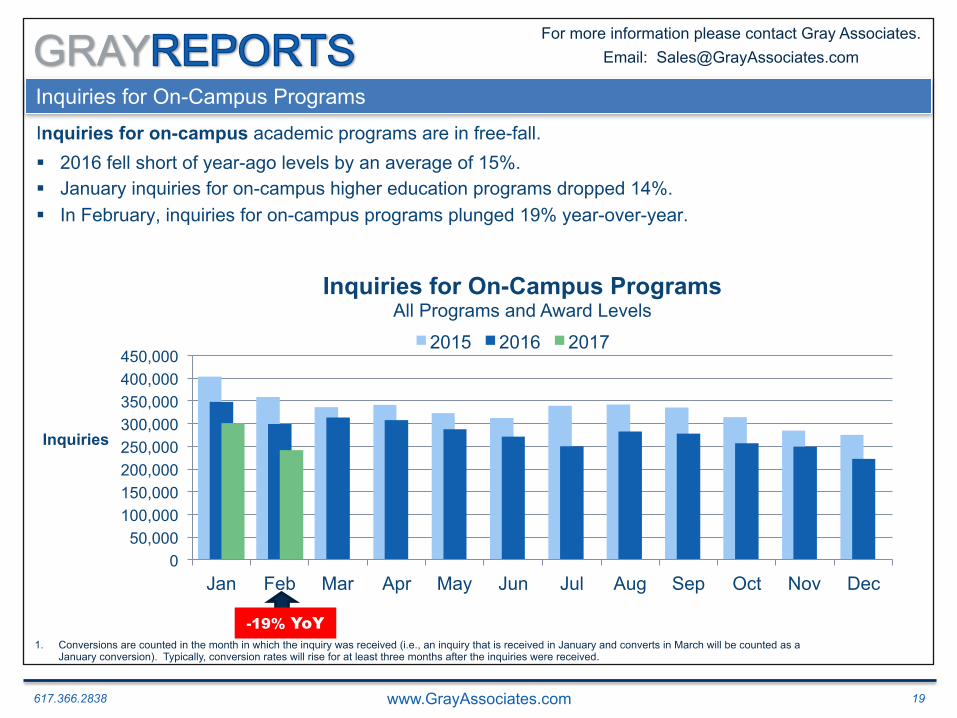
Inquiries for on-campus academic programs are in free-fall. § 2016 fell short of year-ago levels by an average of 15%. § January inquiries for on-campus higher education programs dropped 14%. § In February, inquiries for on-campus programs plunged 19% year-over-year.
2012
0 50,000
100,000 150,000 200,000 250,000 300,000 350,000 400,000 450,000
Jan Feb Mar Apr May Jun Jul Aug Sep Oct Nov Dec
Inquiries
Inquiries for On-Campus Programs All Programs and Award Levels
2015 2016 2017
-19% YoY 1. Conversions are counted in the month in which the inquiry was received (i.e., an inquiry that is received in January and converts in March will be counted as a
January conversion). Typically, conversion rates will rise for at least three months after the inquiries were received.
617.366.2838 www.GrayAssociates.com 20
GRAY For more information please contact Gray Associates. Email: [email protected]
Student Inquiry Conversions for On-Campus Programs
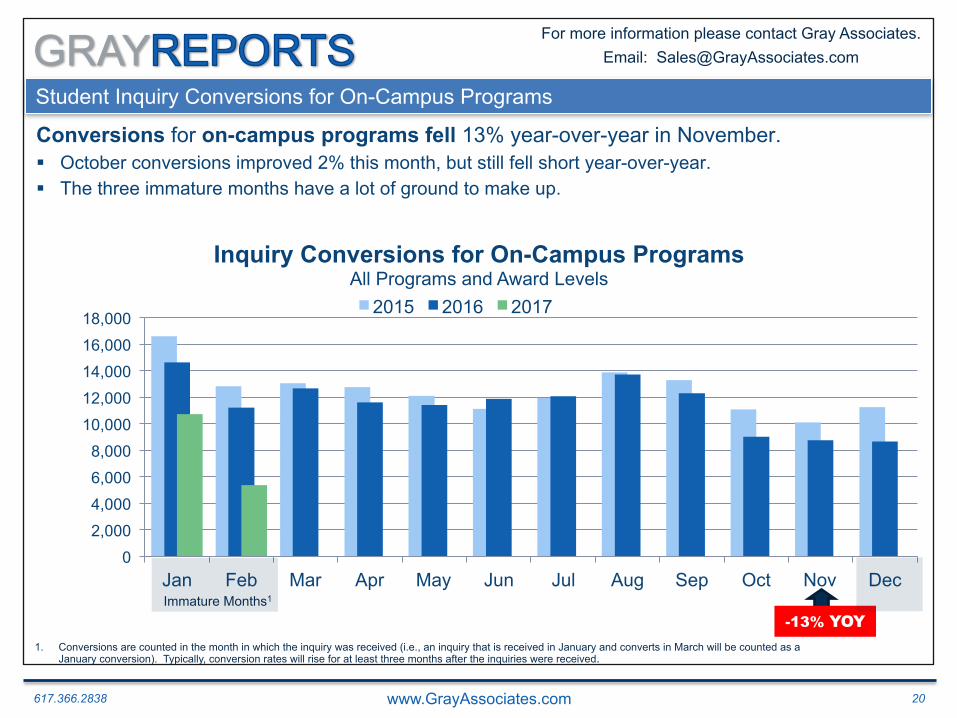
Conversions for on-campus programs fell 13% year-over-year in November. § October conversions improved 2% this month, but still fell short year-over-year. § The three immature months have a lot of ground to make up.
0 2,000 4,000 6,000 8,000
10,000 12,000 14,000 16,000 18,000
Jan Feb Mar Apr May Jun Jul Aug Sep Oct Nov Dec
Inquiry Conversions for On-Campus Programs All Programs and Award Levels
2015 2016 2017
-13% YOY 1. Conversions are counted in the month in which the inquiry was received (i.e., an inquiry that is received in January and converts in March will be counted as a
January conversion). Typically, conversion rates will rise for at least three months after the inquiries were received.
Immature Months1
617.366.2838 www.GrayAssociates.com 21
GRAY For more information please contact Gray Associates. Email: [email protected]
Agenda
1. Demand Trends: Inquiries, Conversions, and Google Searches
1. National
2. Online and On-Campus
3. Degree and Channel
4. City and Program
2. Job Postings
3. NHE: Benchmarking Institute
4. Summary
617.366.2838 www.GrayAssociates.com 22
GRAY For more information please contact Gray Associates. Email: [email protected]
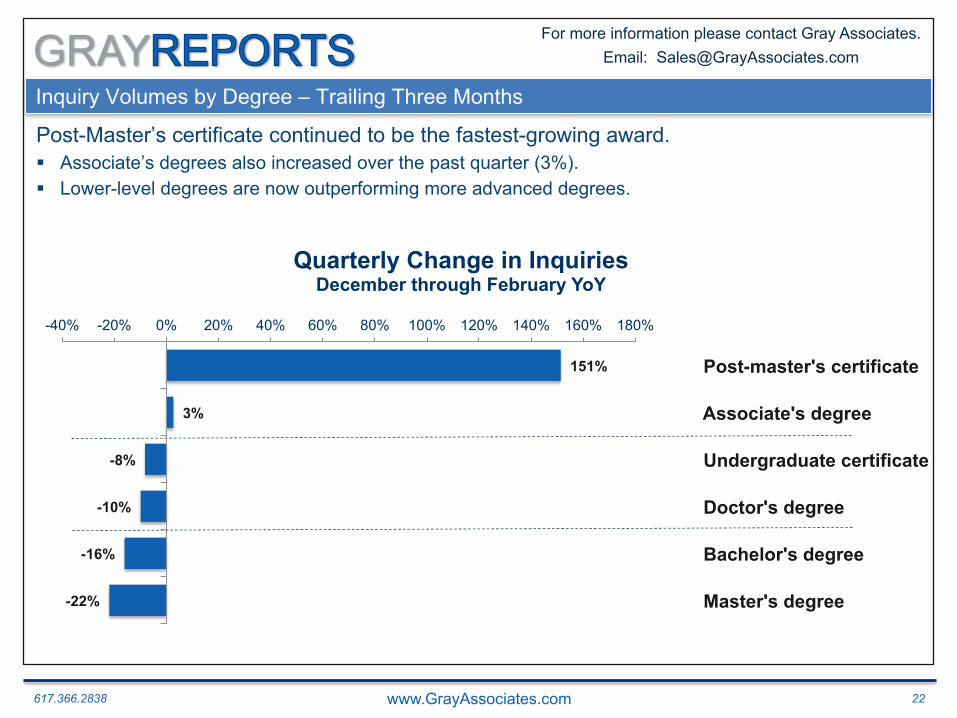
Inquiry Volumes by Degree – Trailing Three Months
Post-Master’s certificate continued to be the fastest-growing award. § Associate’s degrees also increased over the past quarter (3%). § Lower-level degrees are now outperforming more advanced degrees.
-22%
-16%
-10%
-8%
3%
151%
-40% -20% 0% 20% 40% 60% 80% 100% 120% 140% 160% 180%
Master's degree
Bachelor's degree
Doctor's degree
Undergraduate certificate
Associate's degree
Post-master's certificate
Quarterly Change in Inquiries December through February YoY

617.366.2838 www.GrayAssociates.com 23
GRAY For more information please contact Gray Associates. Email: [email protected]
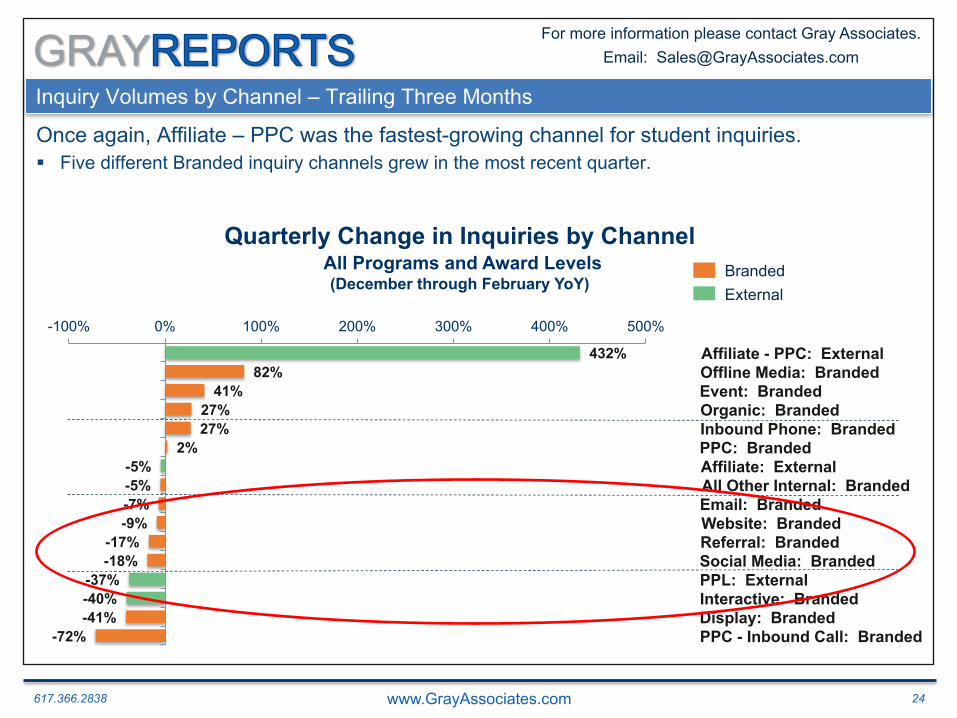
Inquiry Volumes by Channel – Trailing Three Months
Once again, Affiliate – PPC was the fastest-growing channel for student inquiries. § Five different Branded inquiry channels grew in the most recent quarter.
-72% -41% -40% -37%
-18% -17%
-9% -7% -5% -5%
2% 27% 27%
41% 82%
432%
-100% 0% 100% 200% 300% 400% 500%
PPC - Inbound Call: Branded Display: Branded Interactive: Branded PPL: External Social Media: Branded Referral: Branded Website: Branded Email: Branded All Other Internal: Branded Affiliate: External PPC: Branded Inbound Phone: Branded Organic: Branded Event: Branded Offline Media: Branded Affiliate - PPC: External
Quarterly Change in Inquiries by Channel All Programs and Award Levels
(December through February YoY) Branded External
617.366.2838 www.GrayAssociates.com 24
GRAY For more information please contact Gray Associates. Email: [email protected]
Inquiry Volumes by Channel – Trailing Three Months
Once again, Affiliate – PPC was the fastest-growing channel for student inquiries. § Five different Branded inquiry channels grew in the most recent quarter.
-72% -41% -40% -37%
-18% -17%
-9% -7% -5% -5%
2% 27% 27%
41% 82%
432%
-100% 0% 100% 200% 300% 400% 500%
PPC - Inbound Call: Branded Display: Branded Interactive: Branded PPL: External Social Media: Branded Referral: Branded Website: Branded Email: Branded All Other Internal: Branded Affiliate: External PPC: Branded Inbound Phone: Branded Organic: Branded Event: Branded Offline Media: Branded Affiliate - PPC: External
Quarterly Change in Inquiries by Channel All Programs and Award Levels
(December through February YoY) Branded External

617.366.2838 www.GrayAssociates.com 25
GRAY For more information please contact Gray Associates. Email: [email protected]
Agenda
1. Demand Trends: Inquiries, Conversions, and Google Searches
1. National
2. Online and On-Campus
3. Degree and Channel
4. City and Program
2. Job Postings
3. NHE: Benchmarking Institute
4. Summary
617.366.2838 www.GrayAssociates.com 26
GRAY For more information please contact Gray Associates. Email: [email protected]
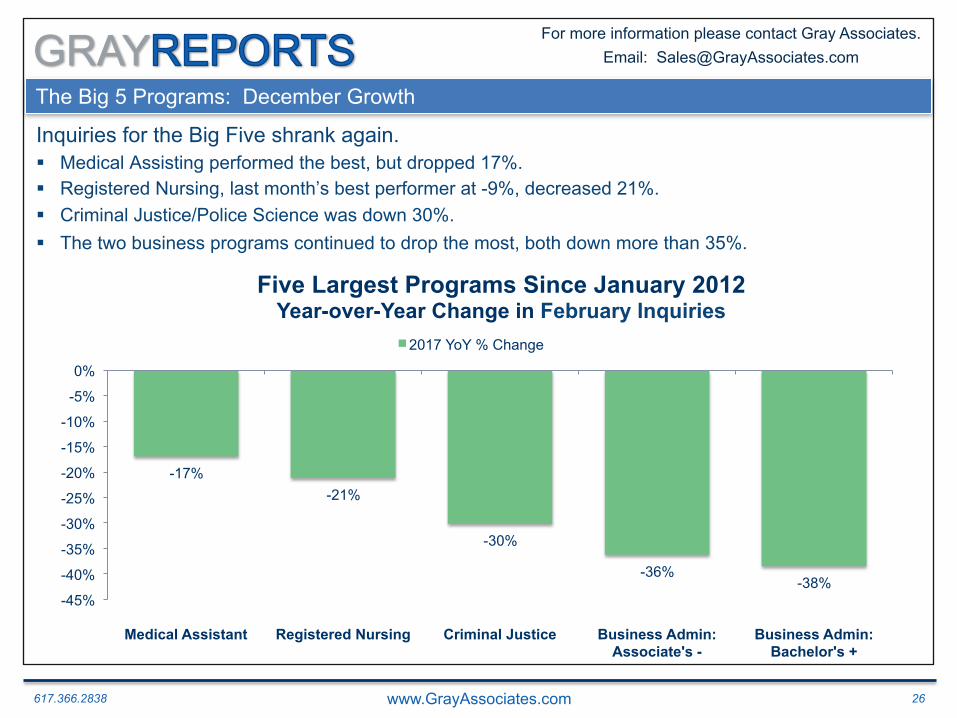
The Big 5 Programs: December Growth
Inquiries for the Big Five shrank again. § Medical Assisting performed the best, but dropped 17%. § Registered Nursing, last month’s best performer at -9%, decreased 21%. § Criminal Justice/Police Science was down 30%. § The two business programs continued to drop the most, both down more than 35%.
-17% -21%
-30%
-36% -38%
-45%
-40%
-35%
-30%
-25%
-20%
-15%
-10%
-5%
0%
Medical Assistant Registered Nursing Criminal Justice Business Admin: Associate's -
Business Admin: Bachelor's +
Five Largest Programs Since January 2012 Year-over-Year Change in February Inquiries
2017 YoY % Change
617.366.2838 www.GrayAssociates.com 27
GRAY For more information please contact Gray Associates. Email: [email protected]
280%
129% 119% 114% 91%
-50%
0%
50%
100%
150%
200%
250%
300%
Human Services Accounting and Business
Counseling Psychology Medical Insurance Coding
Electrical and Electronics Engineering
The Fast 5 Programs Year-over-Year Change in February Inquiries
2017 YoY % Change
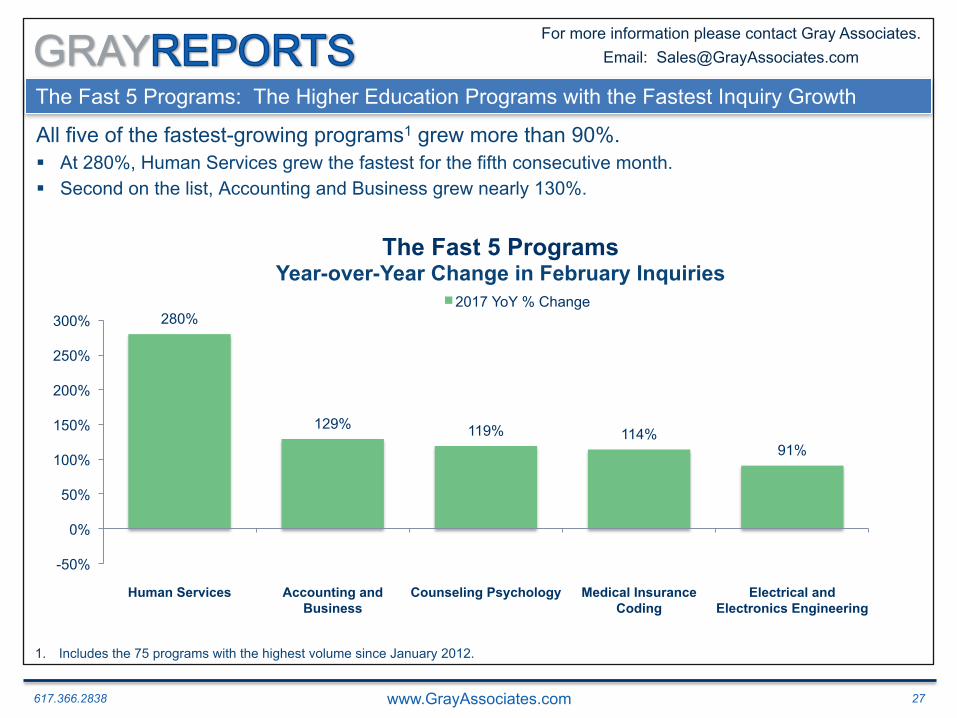
The Fast 5 Programs: The Higher Education Programs with the Fastest Inquiry Growth
All five of the fastest-growing programs1 grew more than 90%. § At 280%, Human Services grew the fastest for the fifth consecutive month. § Second on the list, Accounting and Business grew nearly 130%.
1. Includes the 75 programs with the highest volume since January 2012.

617.366.2838 www.GrayAssociates.com 28
GRAY For more information please contact Gray Associates. Email: [email protected]
-88%
-70% -70% -68% -60%
-100%
-50%
0%
Electrical, Electronic and Comm. Eng. Tech.
Radiologic Technology Accounting and Finance
Computer and Information Sciences,
General.
Criminal Justice/Safety Studies.
The Slow 5 Programs Year-over-Year Change in February Inquiries
2017 YoY % Change
The Slow 5 Programs: The Higher Education Programs with the Slowest Inquiry Growth
All five of the slowest-growing big programs1 shrank more than 60%. § Electronics Engineering was a fast-growing program, but the the Technician program is shrinking. § Criminal Justice/Safety Studies is the only new program in the “Slow 5” this month.
1. Includes the 75 programs with the highest volume since January 2012.
Reference fast growing engineering on previous slide
617.366.2838 www.GrayAssociates.com 29
GRAY For more information please contact Gray Associates. Email: [email protected]
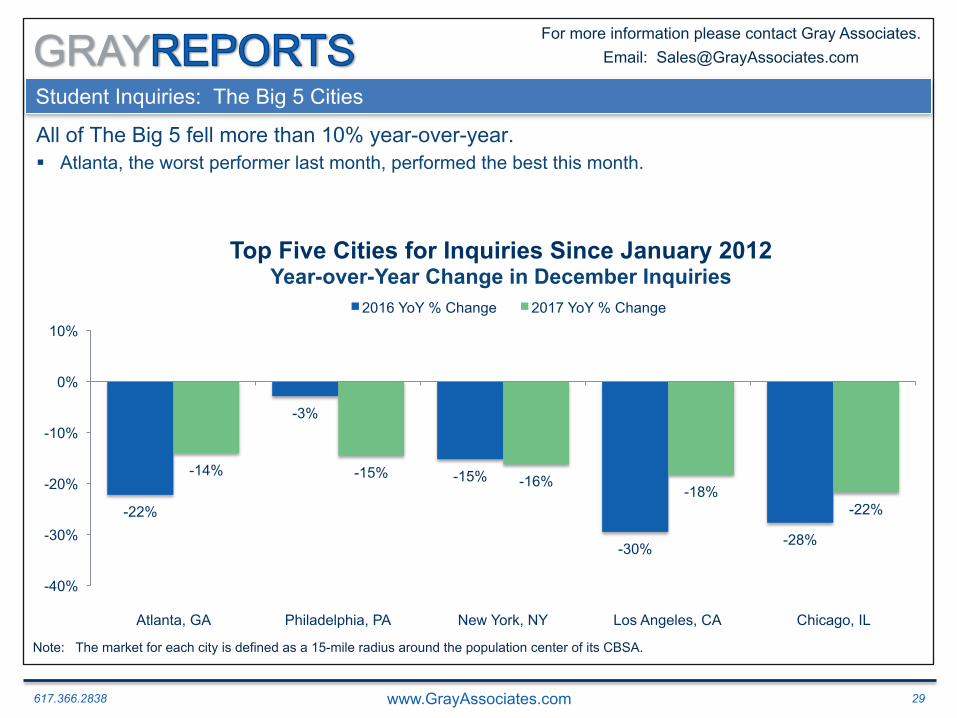
Student Inquiries: The Big 5 Cities
All of The Big 5 fell more than 10% year-over-year. § Atlanta, the worst performer last month, performed the best this month.
-22%
-3%
-15%
-30% -28%
-14% -15% -16% -18%
-22%
-40%
-30%
-20%
-10%
0%
10%
Atlanta, GA Philadelphia, PA New York, NY Los Angeles, CA Chicago, IL
Top Five Cities for Inquiries Since January 2012 Year-over-Year Change in December Inquiries
2016 YoY % Change 2017 YoY % Change
Note: The market for each city is defined as a 15-mile radius around the population center of its CBSA.

617.366.2838 www.GrayAssociates.com 30
GRAY For more information please contact Gray Associates. Email: [email protected]
Agenda
1. Demand Trends: Inquiries, Conversions, and Google Searches
1. National
2. Online and On-Campus
3. Degree and Channel
4. City and Program
2. Job Postings
3. NHE: Benchmarking Institute
4. Summary
617.366.2838 www.GrayAssociates.com 31
GRAY For more information please contact Gray Associates. Email: [email protected]
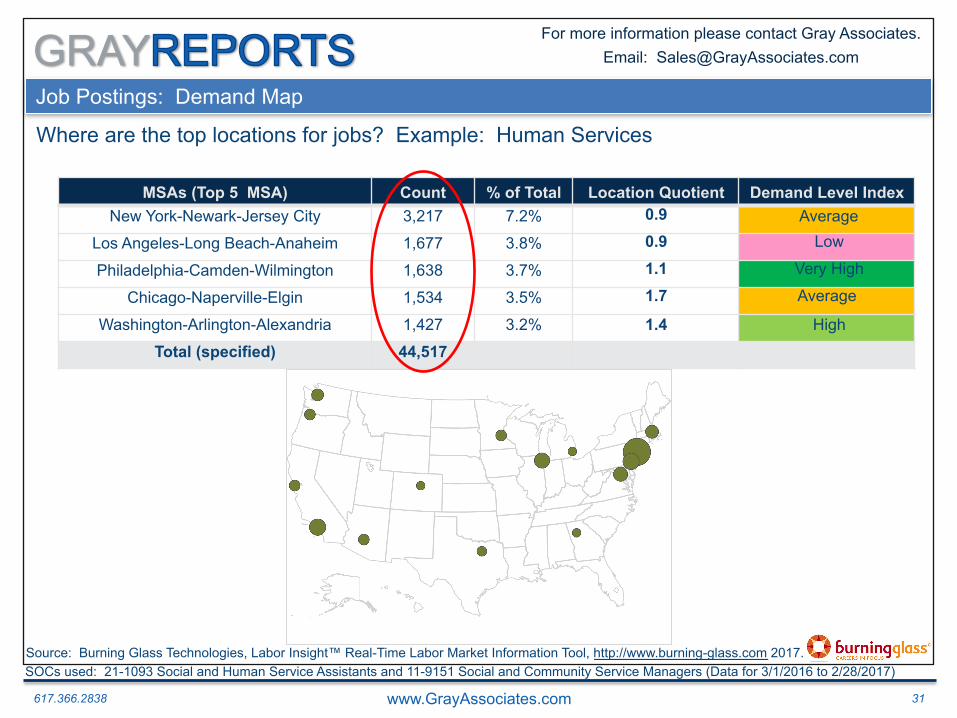
Job Postings: Demand Map
Where are the top locations for jobs? Example: Human Services
MSAs (Top 5 MSA) Count % of Total Location Quotient Demand Level Index New York-Newark-Jersey City 3,217 7.2% 0.9 Average
Los Angeles-Long Beach-Anaheim 1,677 3.8% 0.9 Low
Philadelphia-Camden-Wilmington 1,638 3.7% 1.1 Very High
Chicago-Naperville-Elgin 1,534 3.5% 1.7 Average
Washington-Arlington-Alexandria 1,427 3.2% 1.4 High
Total (specified) 44,517
Source: Burning Glass Technologies, Labor Insight™ Real-Time Labor Market Information Tool, http://www.burning-glass.com 2017. SOCs used: 21-1093 Social and Human Service Assistants and 11-9151 Social and Community Service Managers (Data for 3/1/2016 to 2/28/2017)
617.366.2838 www.GrayAssociates.com 32
GRAY For more information please contact Gray Associates. Email: [email protected]
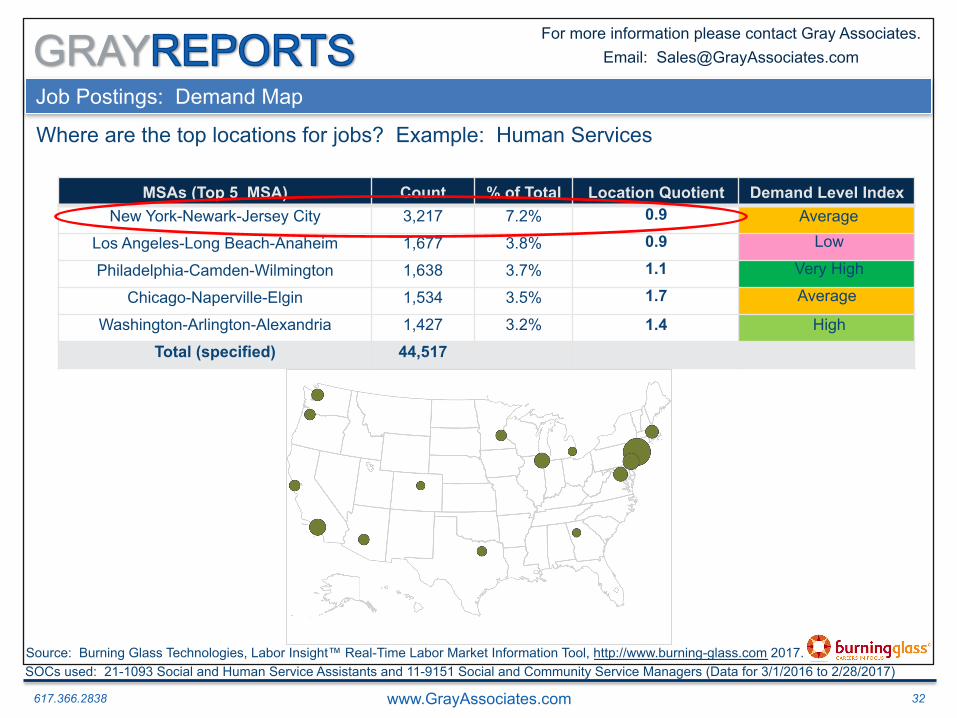
MSAs (Top 5 MSA) Count % of Total Location Quotient Demand Level Index New York-Newark-Jersey City 3,217 7.2% 0.9 Average
Los Angeles-Long Beach-Anaheim 1,677 3.8% 0.9 Low
Philadelphia-Camden-Wilmington 1,638 3.7% 1.1 Very High
Chicago-Naperville-Elgin 1,534 3.5% 1.7 Average
Washington-Arlington-Alexandria 1,427 3.2% 1.4 High
Total (specified) 44,517
Job Postings: Demand Map
Where are the top locations for jobs? Example: Human Services
Source: Burning Glass Technologies, Labor Insight™ Real-Time Labor Market Information Tool, http://www.burning-glass.com 2017. SOCs used: 21-1093 Social and Human Service Assistants and 11-9151 Social and Community Service Managers (Data for 3/1/2016 to 2/28/2017)
617.366.2838 www.GrayAssociates.com 33
GRAY For more information please contact Gray Associates. Email: [email protected]
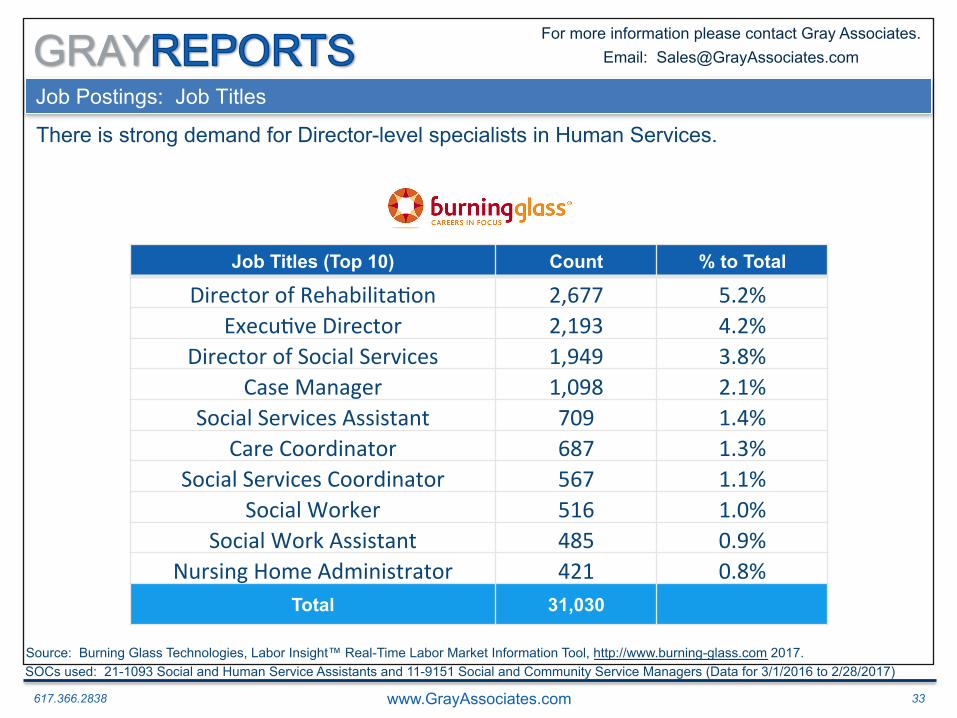
Job Postings: Job Titles
There is strong demand for Director-level specialists in Human Services.
Job Titles (Top 10) Count % to Total
Director of Rehabilita/on 2,677 5.2% Execu/ve Director 2,193 4.2%
Director of Social Services 1,949 3.8% Case Manager 1,098 2.1%
Social Services Assistant 709 1.4% Care Coordinator 687 1.3%
Social Services Coordinator 567 1.1% Social Worker 516 1.0%
Social Work Assistant 485 0.9% Nursing Home Administrator 421 0.8%
Total 31,030
Source: Burning Glass Technologies, Labor Insight™ Real-Time Labor Market Information Tool, http://www.burning-glass.com 2017. SOCs used: 21-1093 Social and Human Service Assistants and 11-9151 Social and Community Service Managers (Data for 3/1/2016 to 2/28/2017)
617.366.2838 www.GrayAssociates.com 34
GRAY For more information please contact Gray Associates. Email: [email protected]
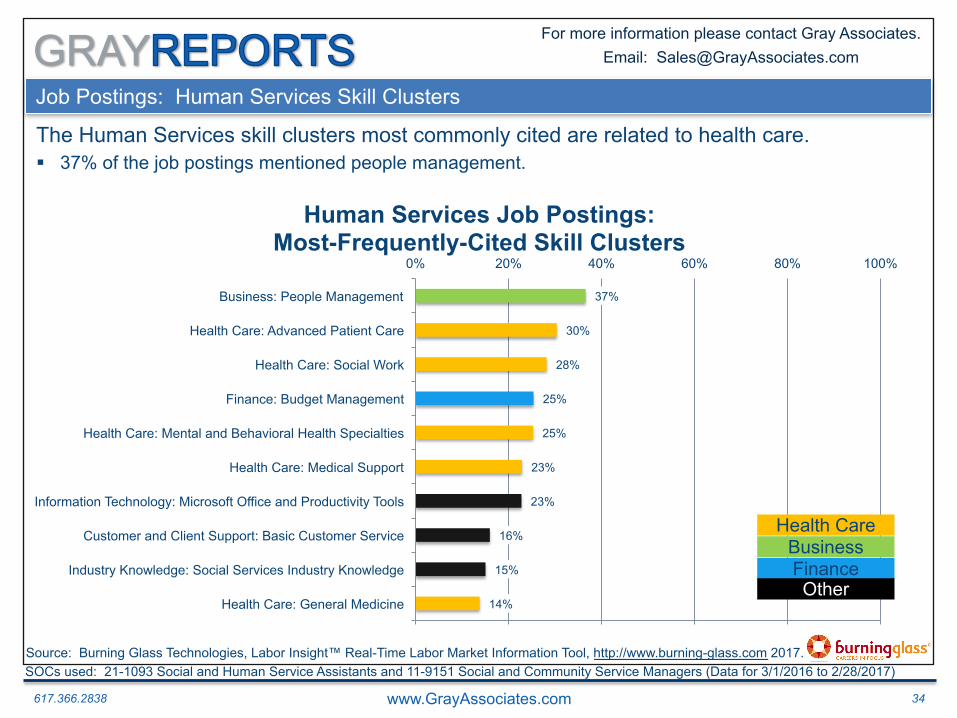
Job Postings: Human Services Skill Clusters
The Human Services skill clusters most commonly cited are related to health care. § 37% of the job postings mentioned people management.
14%
15%
16%
23%
23%
25%
25%
28%
30%
37%
0% 20% 40% 60% 80% 100%
Health Care: General Medicine
Industry Knowledge: Social Services Industry Knowledge
Customer and Client Support: Basic Customer Service
Information Technology: Microsoft Office and Productivity Tools
Health Care: Medical Support
Health Care: Mental and Behavioral Health Specialties
Finance: Budget Management
Health Care: Social Work
Health Care: Advanced Patient Care
Business: People Management
Human Services Job Postings: Most-Frequently-Cited Skill Clusters
Health Care Business Finance Other
Source: Burning Glass Technologies, Labor Insight™ Real-Time Labor Market Information Tool, http://www.burning-glass.com 2017. SOCs used: 21-1093 Social and Human Service Assistants and 11-9151 Social and Community Service Managers (Data for 3/1/2016 to 2/28/2017)
617.366.2838 www.GrayAssociates.com 35
GRAY For more information please contact Gray Associates. Email: [email protected]
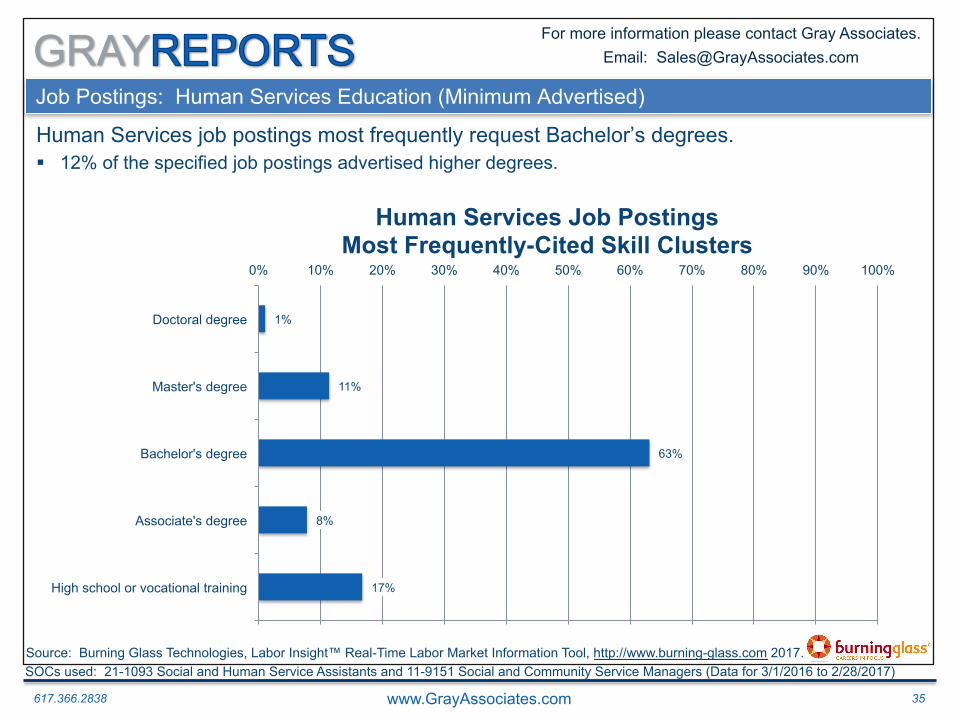
Job Postings: Human Services Education (Minimum Advertised)
Human Services job postings most frequently request Bachelor’s degrees. § 12% of the specified job postings advertised higher degrees.
17%
8%
63%
11%
1%
0% 10% 20% 30% 40% 50% 60% 70% 80% 90% 100%
High school or vocational training
Associate's degree
Bachelor's degree
Master's degree
Doctoral degree
Human Services Job Postings Most Frequently-Cited Skill Clusters
Source: Burning Glass Technologies, Labor Insight™ Real-Time Labor Market Information Tool, http://www.burning-glass.com 2017. SOCs used: 21-1093 Social and Human Service Assistants and 11-9151 Social and Community Service Managers (Data for 3/1/2016 to 2/28/2017)

617.366.2838 www.GrayAssociates.com 36
GRAY For more information please contact Gray Associates. Email: [email protected]
Human Services Job Postings: Employers
During the past 12 months, The Mentor Network had over 1,000 job postings.
1,116
873
468
369
345
337
310
296
280
278
0 200 400 600 800 1,000 1,200
The Mentor Network
Employer 2
Employer 3
Brookdale Senior Living
Employer 5
Golden Living Centers
Employer 7
Consulate Health Care
HCR ManorCare
Employer 10
Employers by Volume in Job Postings
Source: Burning Glass Technologies, Labor Insight™ Real-Time Labor Market Information Tool, http://www.burning-glass.com 2017. SOCs used: 21-1093 Social and Human Service Assistants and 11-9151 Social and Community Service Managers (Data for 3/1/2016 to 2/28/2017)
617.366.2838 www.GrayAssociates.com 37
GRAY For more information please contact Gray Associates. Email: [email protected]
Agenda
1. Demand Trends: Inquiries, Conversions, and Google Searches
1. National
2. Online and On-Campus
3. Degree and Channel
4. City and Program
2. Job Postings
3. NHE: Benchmarking Institute
4. Summary
Case Studies
Lou Guthrie National Benchmarking Institute
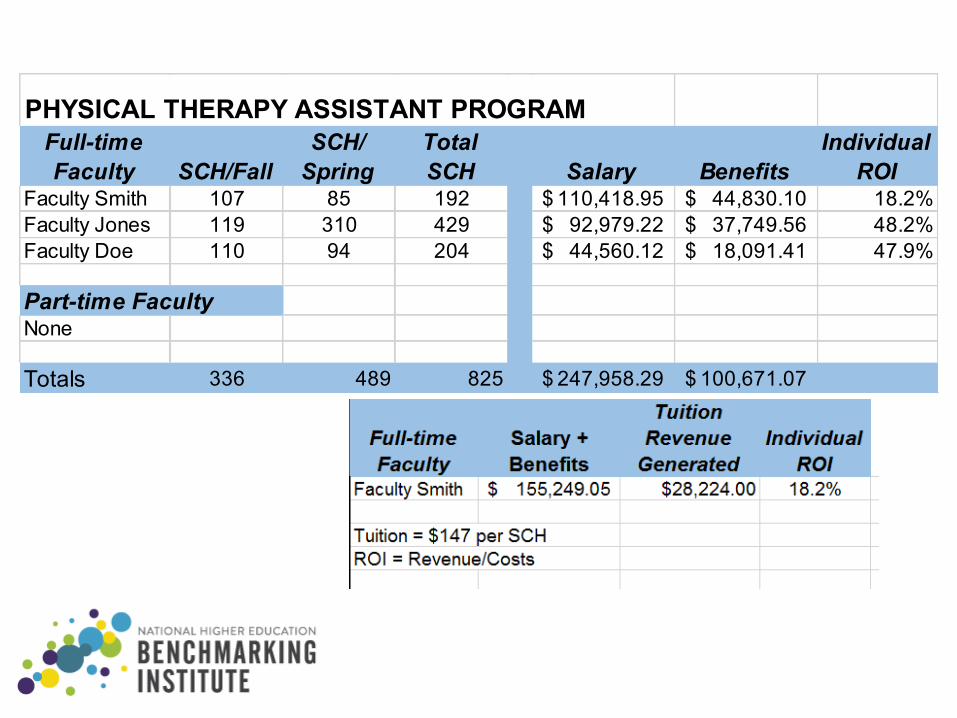
PHYSICAL THERAPY ASSISTANT PROGRAMFull-time Faculty SCH/Fall
SCH/ Spring
Total SCH Salary Benefits
Individual ROI
Faculty Smith 107 85 192 110,418.95$ 44,830.10$ 18.2%Faculty Jones 119 310 429 92,979.22$ 37,749.56$ 48.2%Faculty Doe 110 94 204 44,560.12$ 18,091.41$ 47.9%
Part-time FacultyNone
Totals 336 489 825 247,958.29$ 100,671.07$
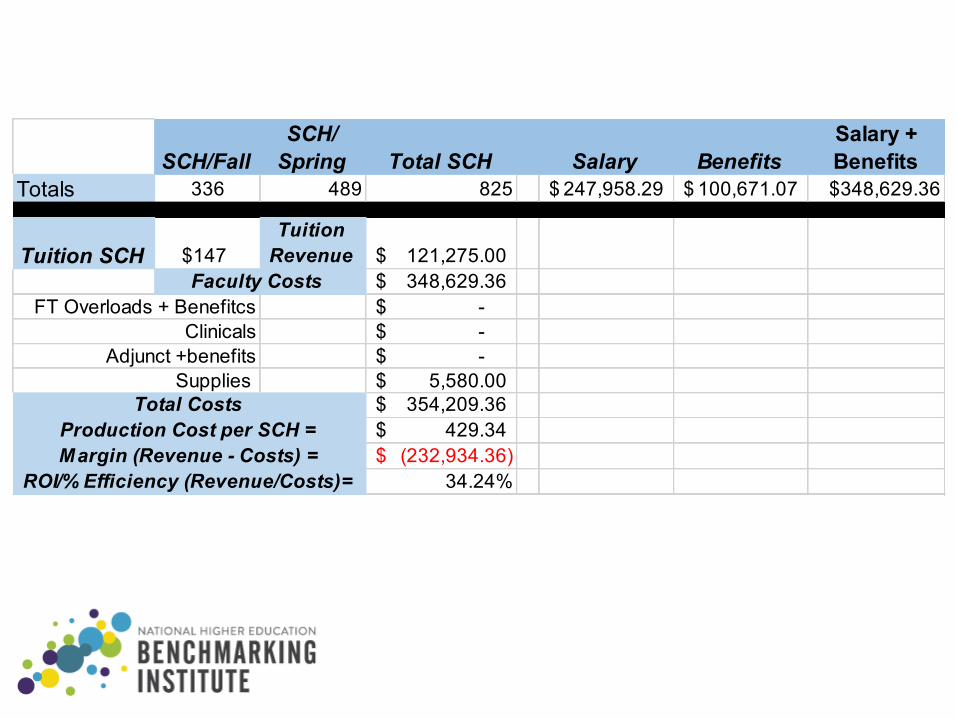
SCH/FallSCH/
Spring Total SCH Salary BenefitsSalary + Benefits
Totals 336 489 825 247,958.29$ 100,671.07$ $348,629.36
Tuition SCH $147Tuition
Revenue 121,275.00$ 348,629.36$
-$ -$ -$
5,580.00$ 354,209.36$
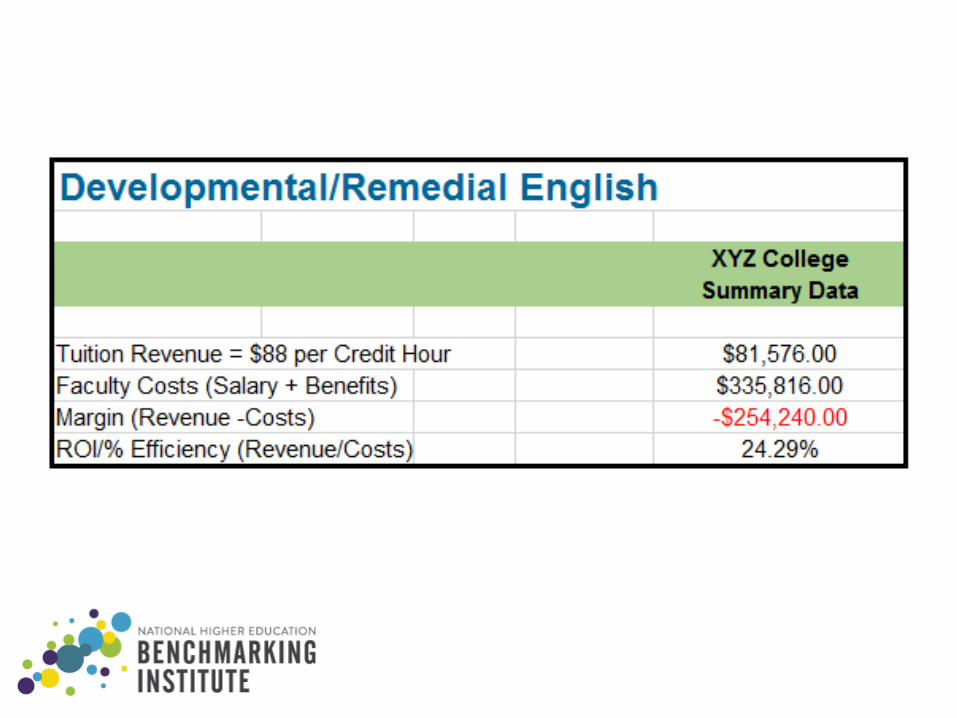
429.34$ (232,934.36)$
34.24%Margin (Revenue - Costs) =
ROI/% Efficiency (Revenue/Costs)=
Faculty Costs
Total Costs
FT Overloads + BenefitcsClinicals
Adjunct +benefitsSupplies
Production Cost per SCH =

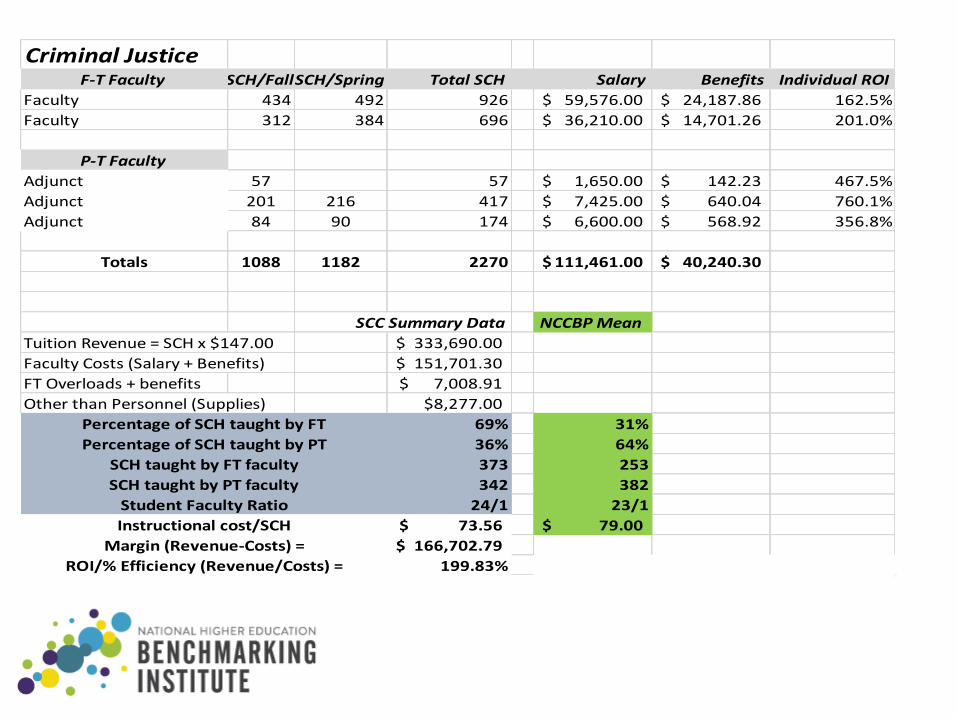
Criminal JusticeF-‐T Faculty SCH/FallSCH/Spring Total SCH Salary Benefits Individual ROI
Faculty 434 492 926 59,576.00$ 24,187.86$ 162.5%Faculty 312 384 696 36,210.00$ 14,701.26$ 201.0%
P-‐T Faculty Adjunct 57 57 1,650.00$ 142.23$ 467.5%Adjunct 201 216 417 7,425.00$ 640.04$ 760.1%Adjunct 84 90 174 6,600.00$ 568.92$ 356.8%
Totals 1088 1182 2270 111,461.00$ 40,240.30$
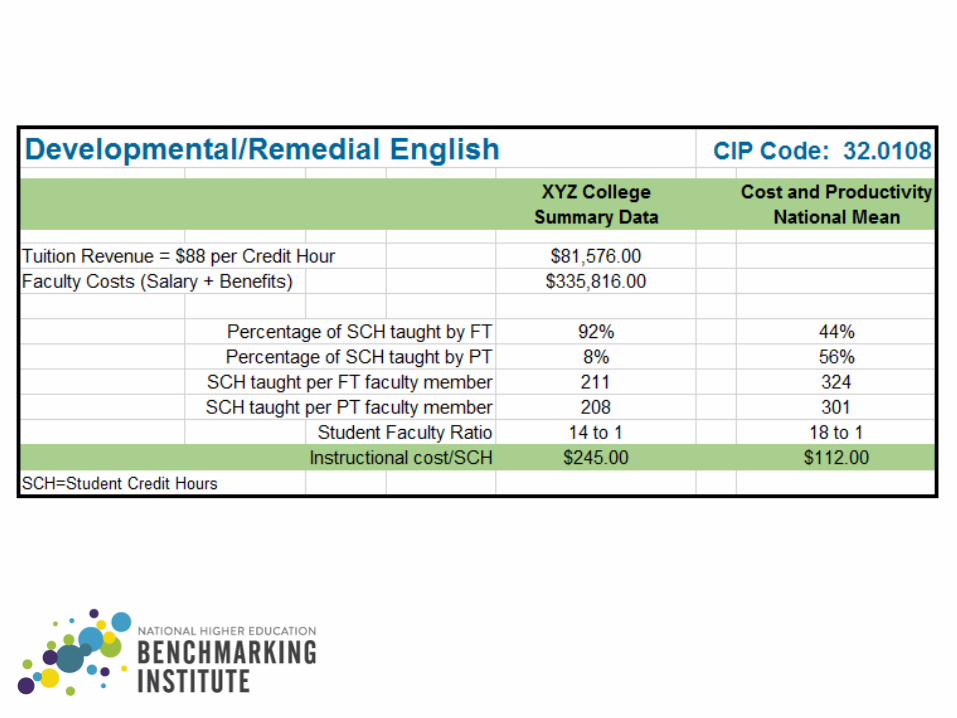
SCC Summary Data NCCBP Mean Tuition Revenue = SCH x $147.00 333,690.00$ Faculty Costs (Salary + Benefits) 151,701.30$ FT Overloads + benefits 7,008.91$ Other than Personnel (Supplies) $8,277.00
69% 31%36% 64%373 253342 38224/1 23/1
73.56$ 79.00$ 166,702.79$
199.83%
Percentage of SCH taught by FTPercentage of SCH taught by PT
SCH taught by FT facultySCH taught by PT facultyStudent Faculty RatioInstructional cost/SCH
Margin (Revenue-‐Costs) =ROI/% Efficiency (Revenue/Costs) =
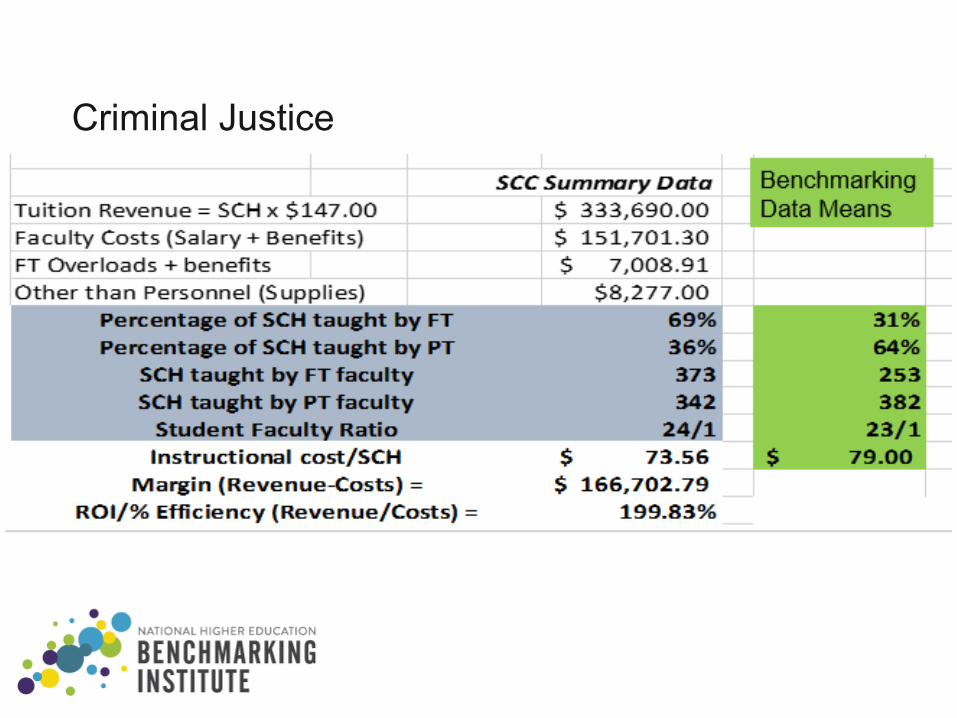
Criminal Justice
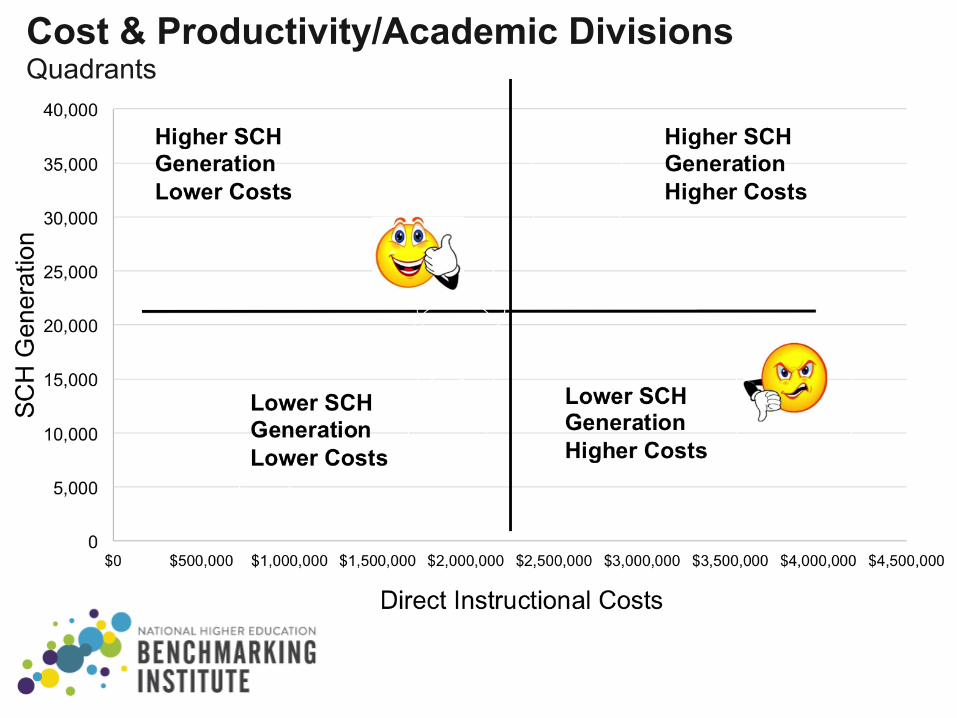
Cost & Productivity/Academic Divisions Quadrants
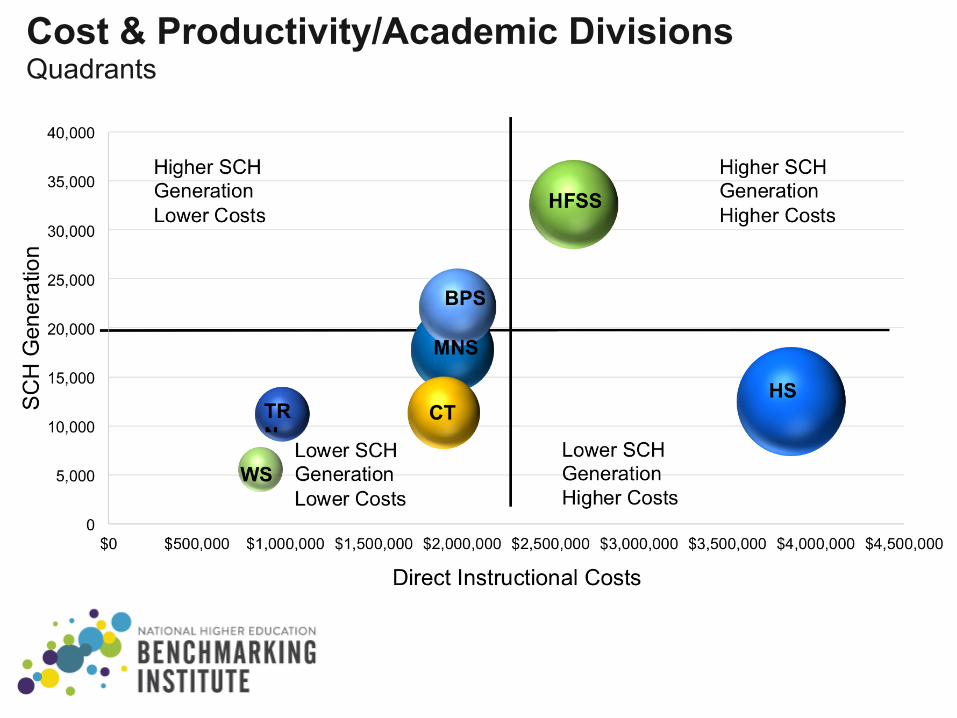
Cost & Productivity/Academic Divisions Quadrants
Conclusions
§ Cost & Productivity measures are a key part of a program review
§ Cost per SCH and Student/Faculty Ratios are the measures used to examine the efficiency of programs
§ Benchmarking enhances the analysis by adding context
§ Decisions should not be made based on cost alone
§ Use analysis to balance programs/divisions, adjust teaching loads and class sizes, and make strategic decisions
Learn More about Benchmarking and Best Practices BenchmarkingInstitute.org
Maria Harper-Marinick
Michelle Asha Cooper
Randy Swing
Keep up with the Benchmarking Institute and all of our projects by joining us on LinkedIn and following us on Twitter
@EdBenchmark
Join the National Higher Education Benchmarking Institute Group

617.366.2838 www.GrayAssociates.com 52
GRAY For more information please contact Gray Associates. Email: [email protected]
Agenda
1. Demand Trends: Inquiries, Conversions, and Google Searches
1. National
2. Online and On-Campus
3. Degree and Channel
4. City and Program
2. Job Postings
3. NHE: Benchmarking Institute
4. Summary
617.366.2838 www.GrayAssociates.com 53
GRAY For more information please contact Gray Associates. Email: [email protected]
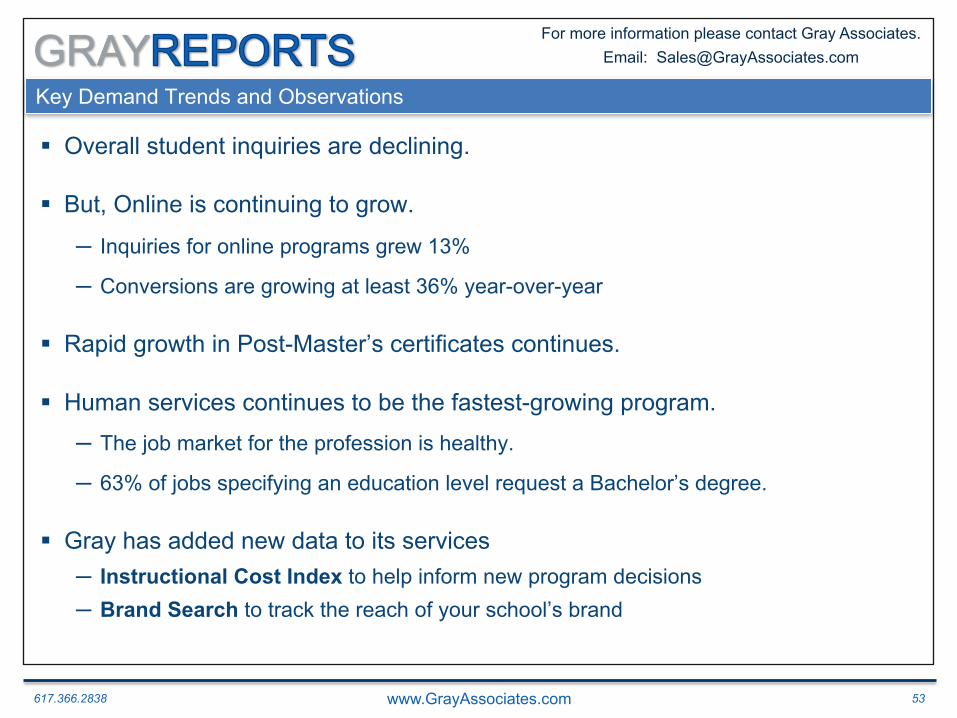
Key Demand Trends and Observations
§ Overall student inquiries are declining.
§ But, Online is continuing to grow.
─ Inquiries for online programs grew 13%
─ Conversions are growing at least 36% year-over-year
§ Rapid growth in Post-Master’s certificates continues.
§ Human services continues to be the fastest-growing program.
─ The job market for the profession is healthy.
─ 63% of jobs specifying an education level request a Bachelor’s degree.
§ Gray has added new data to its services ─ Instructional Cost Index to help inform new program decisions ─ Brand Search to track the reach of your school’s brand
617.366.2838 www.GrayAssociates.com 54
GRAY For more information please contact Gray Associates. Email: [email protected]
Questions and Contacts
Please feel free to contact:
Bob Atkins CEO
Gray Associates, Inc.
[email protected] @Gray_Associates
617.366.2836
617.366.2838 www.GrayAssociates.com 55
GRAY For more information please contact Gray Associates. Email: [email protected]
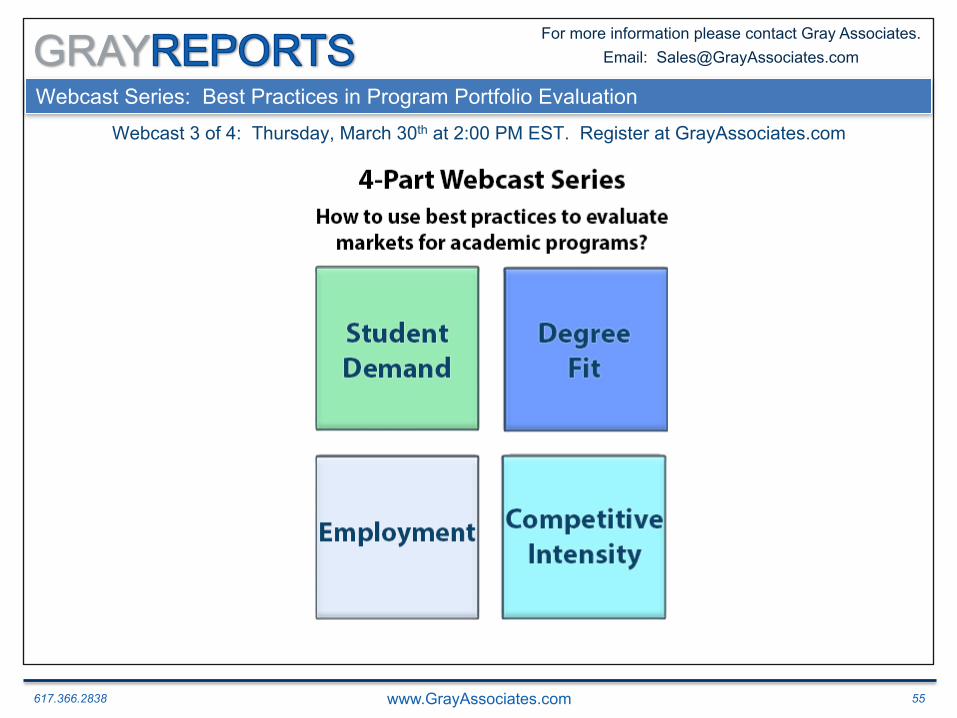
Webcast 3 of 4: Thursday, March 30th at 2:00 PM EST. Register at GrayAssociates.com
Webcast Series: Best Practices in Program Portfolio Evaluation

617.366.2838 www.GrayAssociates.com 56
GRAY For more information please contact Gray Associates. Email: [email protected]
Upcoming Gray Associates’ Webcast
Please join us next month!
April Webcast (March Results)
Thursday, April 20th at 2:00 PM EDT