2016 may grayreports - demand trends in higher education
TRANSCRIPT

GRAYREPORTS Demand for Higher Education Programs
www.GrayAssociates.com
Results through May 2016
617.366.2838 www.GrayAssociates.com 2
GRAY For more information please contact Gray Associates. Email: [email protected]
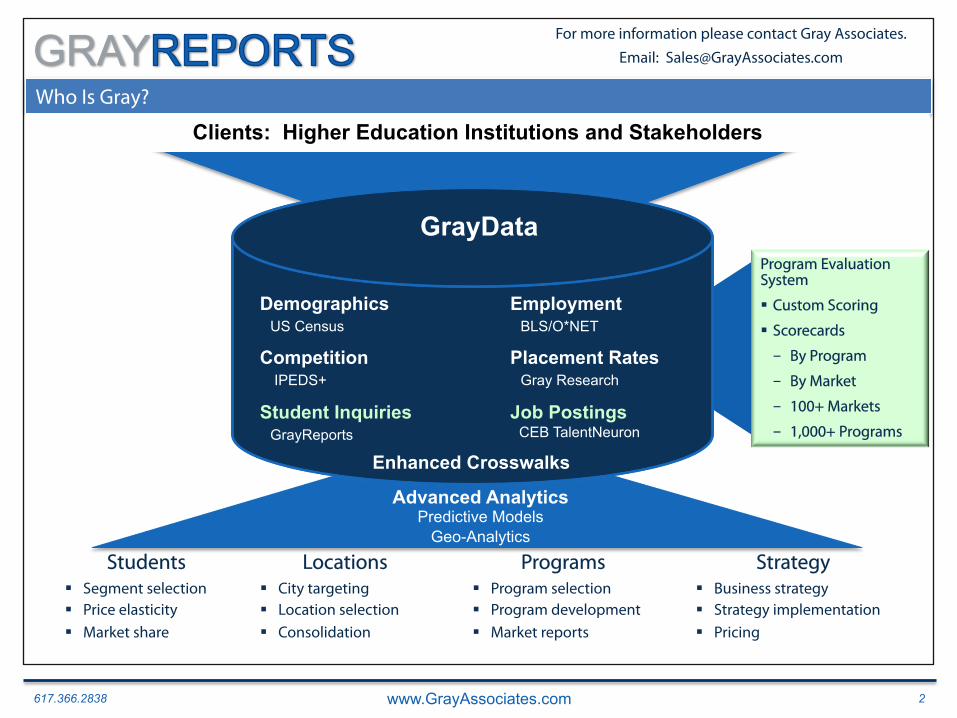
Who Is Gray?
GrayData
Employment BLS/O*NET
Placement Rates Gray Research
Student Inquiries GrayReports
Demographics US Census
Job Postings CEB TalentNeuron
Students Programs Strategy Locations § Segment selection § Price elasticity § Market share
§ City targeting § Location selection § Consolidation
§ Program selection § Program development § Market reports
§ Business strategy § Strategy implementation § Pricing
Advanced Analytics Predictive Models
Geo-Analytics
Clients: Higher Education Institutions and Stakeholders
Competition IPEDS+
Program Evaluation System
§ Custom Scoring
§ Scorecards
- By Program
- By Market
- 100+ Markets
- 1,000+ Programs
Enhanced Crosswalks
617.366.2838 www.GrayAssociates.com 3
GRAY For more information please contact Gray Associates. Email: [email protected]
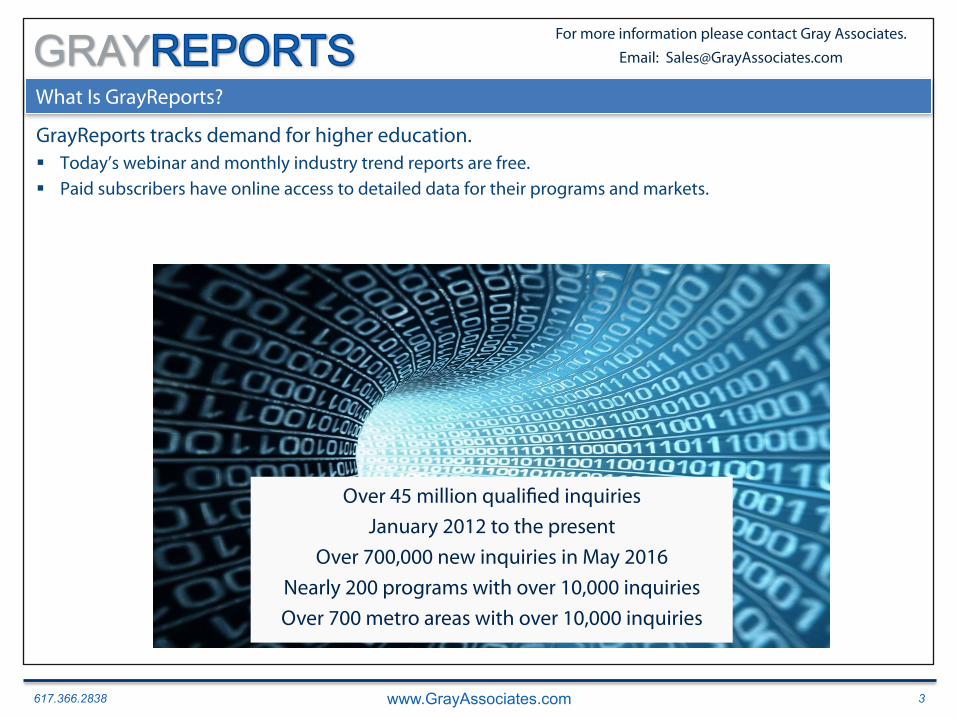
What Is GrayReports?
GrayReports tracks demand for higher education. § Today’s webinar and monthly industry trend reports are free. § Paid subscribers have online access to detailed data for their programs and markets.
Over 45 million qualified inquiries January 2012 to the present
Over 700,000 new inquiries in May 2016 Nearly 200 programs with over 10,000 inquiries Over 700 metro areas with over 10,000 inquiries
617.366.2838 www.GrayAssociates.com 4
GRAY For more information please contact Gray Associates. Email: [email protected]
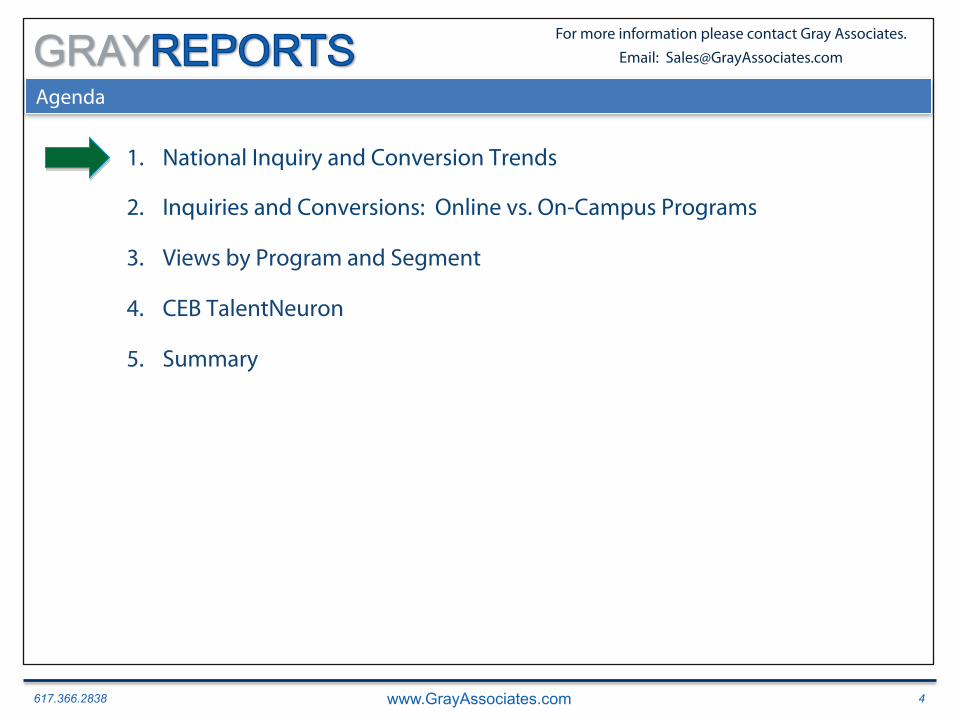
Agenda
1. National Inquiry and Conversion Trends
2. Inquiries and Conversions: Online vs. On-Campus Programs
3. Views by Program and Segment
4. CEB TalentNeuron
5. Summary
617.366.2838 www.GrayAssociates.com 5
GRAY For more information please contact Gray Associates. Email: [email protected]
-
200,000
400,000
600,000
800,000
1,000,000
1,200,000
Jan Feb Mar Apr May Jun Jul Aug Sep Oct Nov Dec
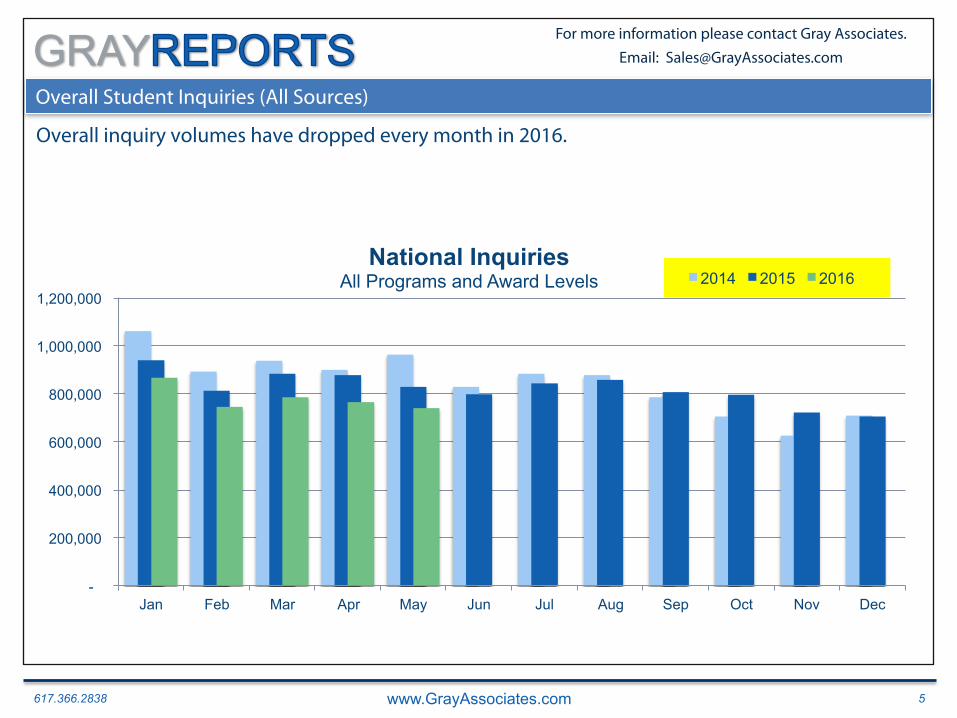
National Inquiries All Programs and Award Levels 2014 2015 2016
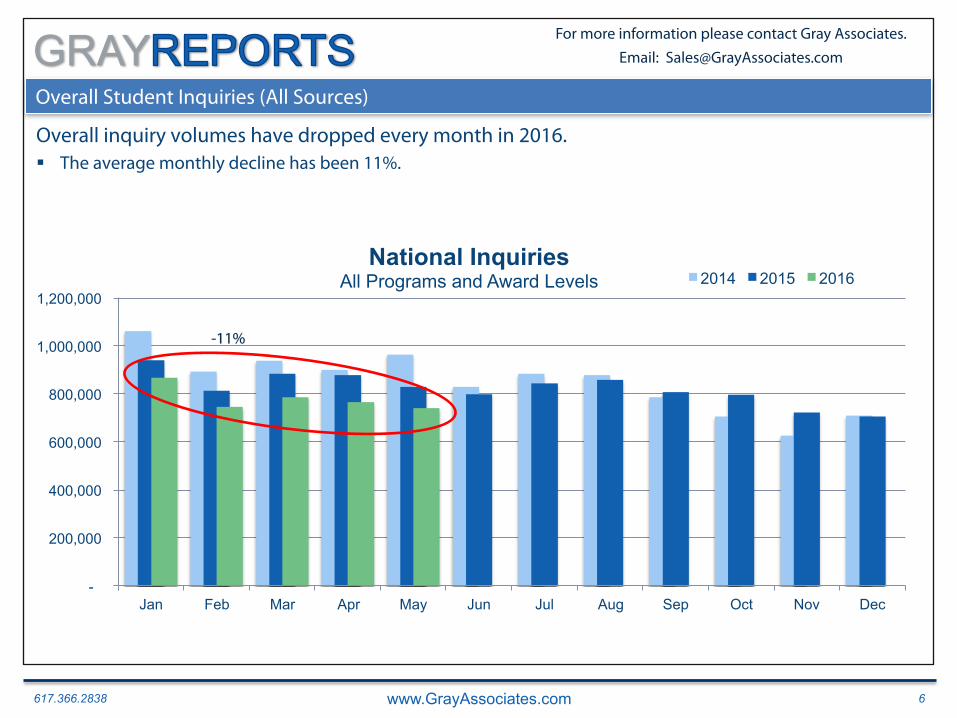
Overall Student Inquiries (All Sources)
Overall inquiry volumes have dropped every month in 2016.
617.366.2838 www.GrayAssociates.com 6
GRAY For more information please contact Gray Associates. Email: [email protected]
-
200,000
400,000
600,000
800,000
1,000,000
1,200,000
Jan Feb Mar Apr May Jun Jul Aug Sep Oct Nov Dec
National Inquiries All Programs and Award Levels 2014 2015 2016
Overall Student Inquiries (All Sources)
Overall inquiry volumes have dropped every month in 2016. § The average monthly decline has been 11%.
-11%
617.366.2838 www.GrayAssociates.com 7
GRAY For more information please contact Gray Associates. Email: [email protected]
-
200,000
400,000
600,000
800,000
1,000,000
1,200,000
Jan Feb Mar Apr May Jun Jul Aug Sep Oct Nov Dec
National Inquiries All Programs and Award Levels 2014 2015 2016
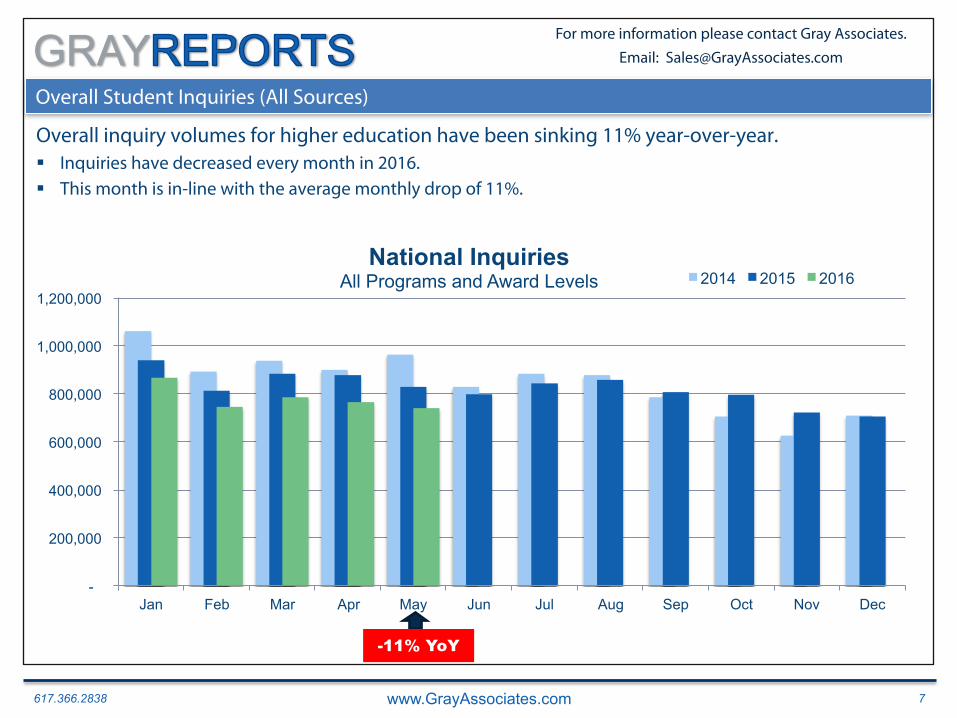
Overall Student Inquiries (All Sources)
Overall inquiry volumes for higher education have been sinking 11% year-over-year. § Inquiries have decreased every month in 2016. § This month is in-line with the average monthly drop of 11%.
-11% YoY
617.366.2838 www.GrayAssociates.com 8
GRAY For more information please contact Gray Associates. Email: [email protected]
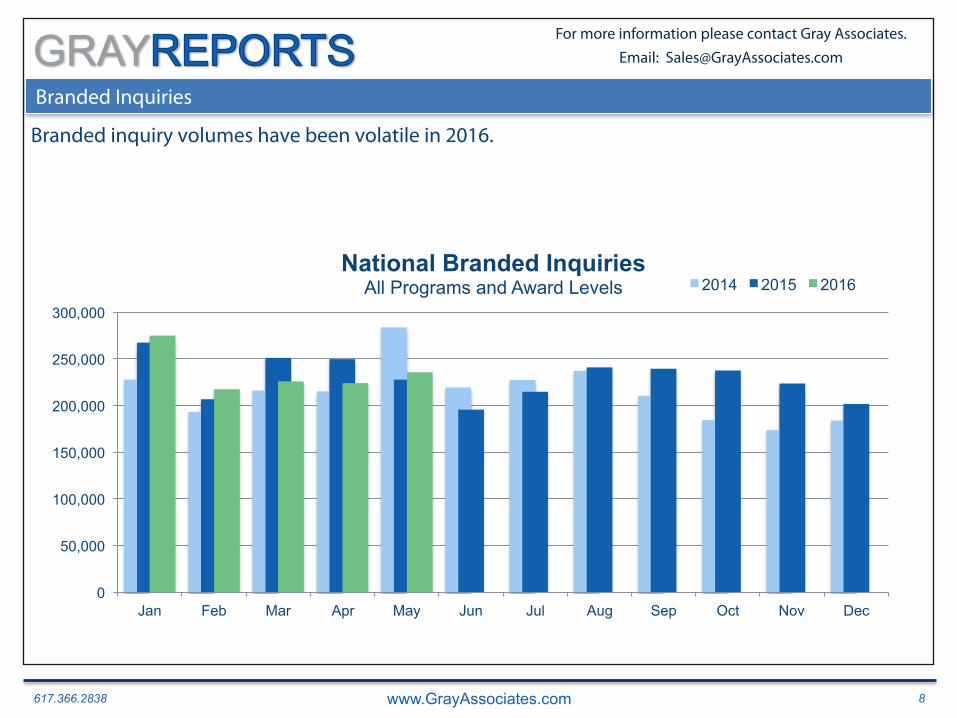
Branded Inquiries
Branded inquiry volumes have been volatile in 2016.
0
50,000
100,000
150,000
200,000
250,000
300,000
Jan Feb Mar Apr May Jun Jul Aug Sep Oct Nov Dec
National Branded Inquiries All Programs and Award Levels 2014 2015 2016
617.366.2838 www.GrayAssociates.com 9
GRAY For more information please contact Gray Associates. Email: [email protected]
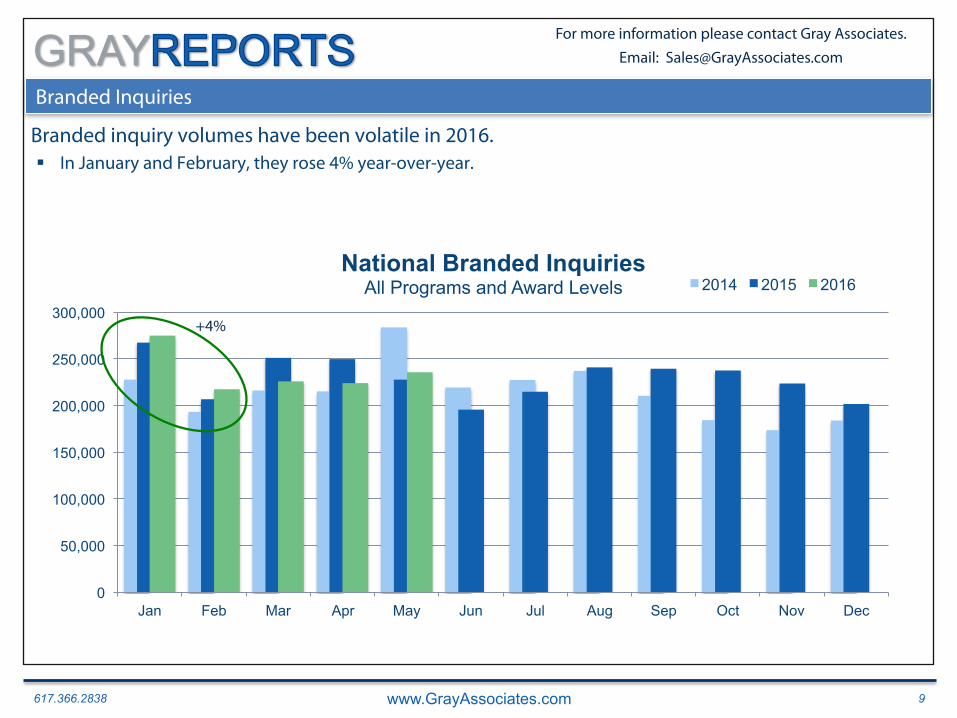
Branded Inquiries
Branded inquiry volumes have been volatile in 2016. § In January and February, they rose 4% year-over-year.
0
50,000
100,000
150,000
200,000
250,000
300,000
Jan Feb Mar Apr May Jun Jul Aug Sep Oct Nov Dec
National Branded Inquiries All Programs and Award Levels 2014 2015 2016
+4%
617.366.2838 www.GrayAssociates.com 10
GRAY For more information please contact Gray Associates. Email: [email protected]
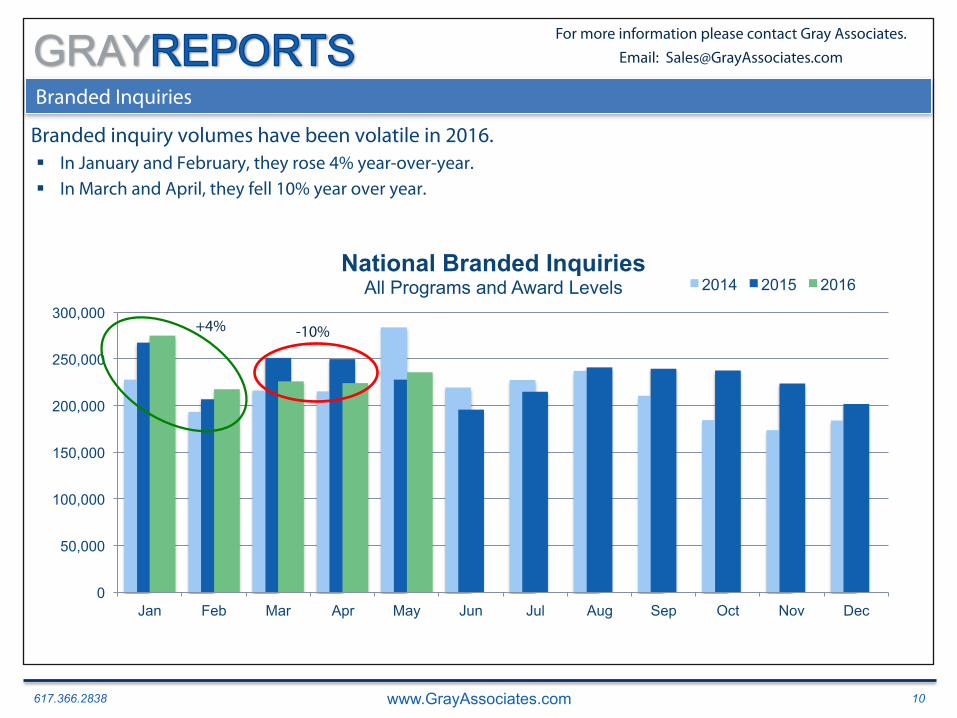
Branded Inquiries
Branded inquiry volumes have been volatile in 2016. § In January and February, they rose 4% year-over-year. § In March and April, they fell 10% year over year.
0
50,000
100,000
150,000
200,000
250,000
300,000
Jan Feb Mar Apr May Jun Jul Aug Sep Oct Nov Dec
National Branded Inquiries All Programs and Award Levels 2014 2015 2016
+4% -10%
617.366.2838 www.GrayAssociates.com 11
GRAY For more information please contact Gray Associates. Email: [email protected]
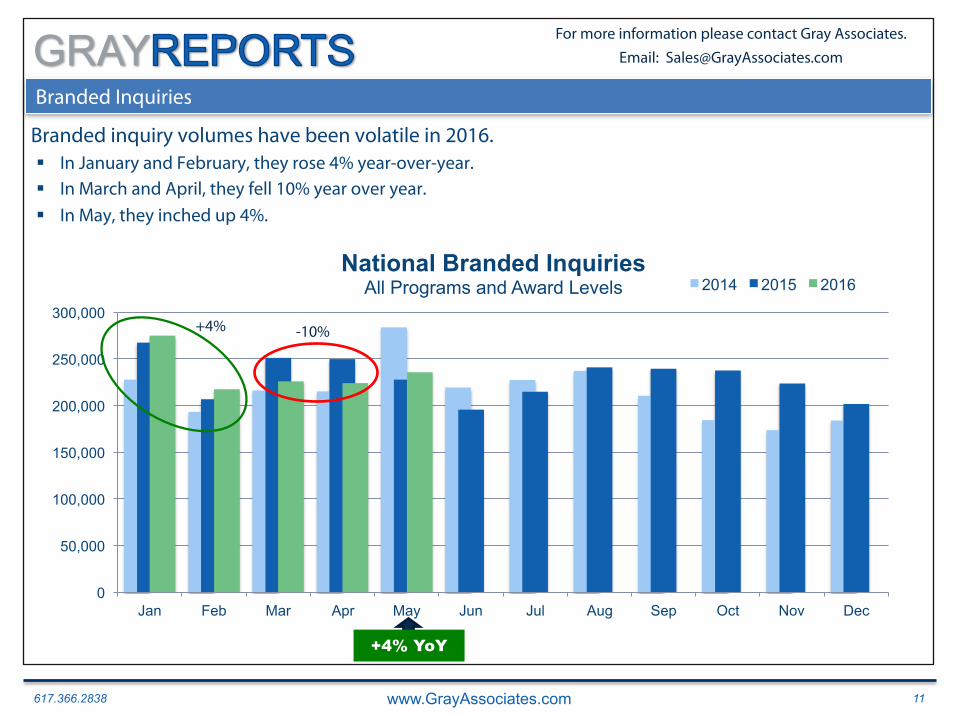
Branded Inquiries
Branded inquiry volumes have been volatile in 2016. § In January and February, they rose 4% year-over-year. § In March and April, they fell 10% year over year. § In May, they inched up 4%.
0
50,000
100,000
150,000
200,000
250,000
300,000
Jan Feb Mar Apr May Jun Jul Aug Sep Oct Nov Dec
National Branded Inquiries All Programs and Award Levels 2014 2015 2016
+4% YoY
+4% -10%

617.366.2838 www.GrayAssociates.com 12
GRAY For more information please contact Gray Associates. Email: [email protected]
External Inquiries: Overall Results
External inquiries have fallen every month this year, by an average of 13% year-over-year.
0
100,000
200,000
300,000
400,000
500,000
600,000
700,000
800,000
900,000
Jan Feb Mar Apr May Jun Jul Aug Sep Oct Nov Dec
National External Inquiries All Programs and Award Levels 2014 2015 2016
-13%
617.366.2838 www.GrayAssociates.com 13
GRAY For more information please contact Gray Associates. Email: [email protected]
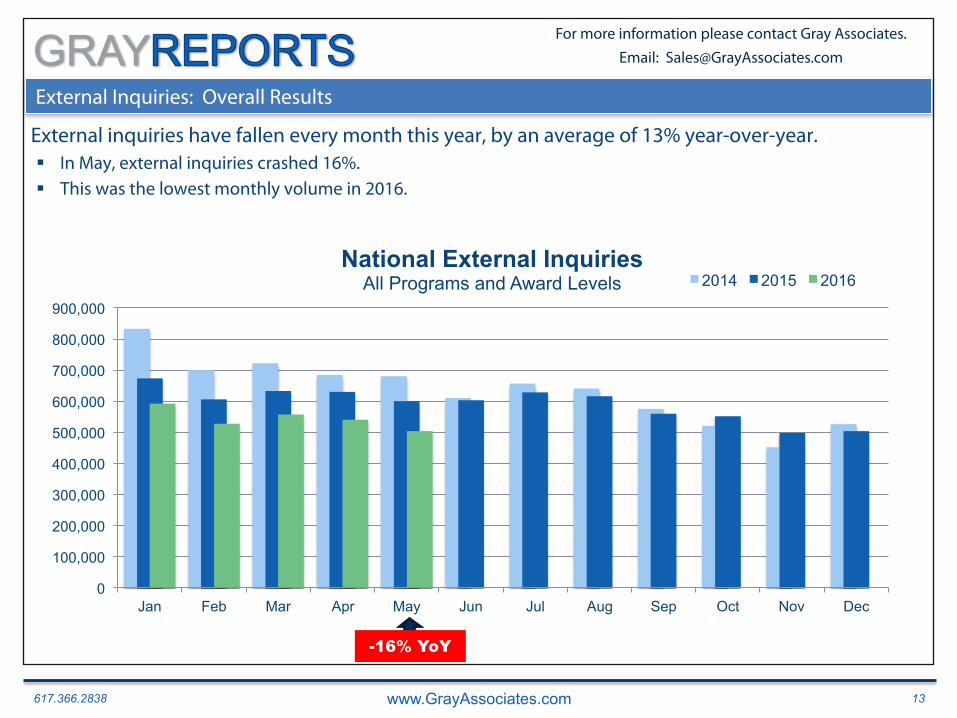
External Inquiries: Overall Results
External inquiries have fallen every month this year, by an average of 13% year-over-year. § In May, external inquiries crashed 16%. § This was the lowest monthly volume in 2016.
0
100,000
200,000
300,000
400,000
500,000
600,000
700,000
800,000
900,000
Jan Feb Mar Apr May Jun Jul Aug Sep Oct Nov Dec
National External Inquiries All Programs and Award Levels 2014 2015 2016
-16% YoY
617.366.2838 www.GrayAssociates.com 14
GRAY For more information please contact Gray Associates. Email: [email protected]
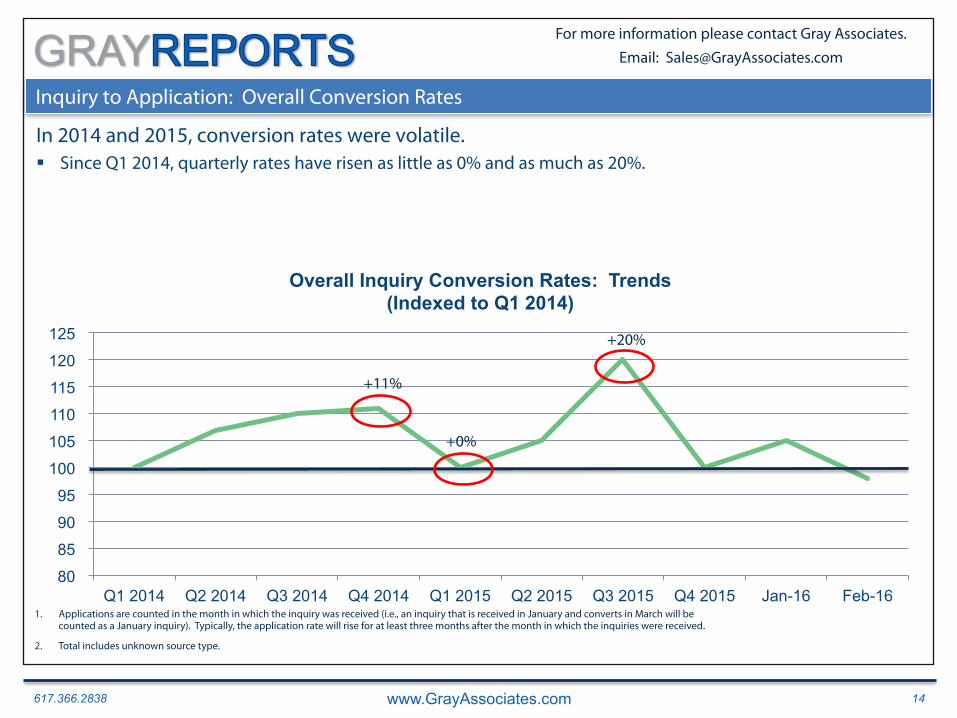
Inquiry to Application: Overall Conversion Rates
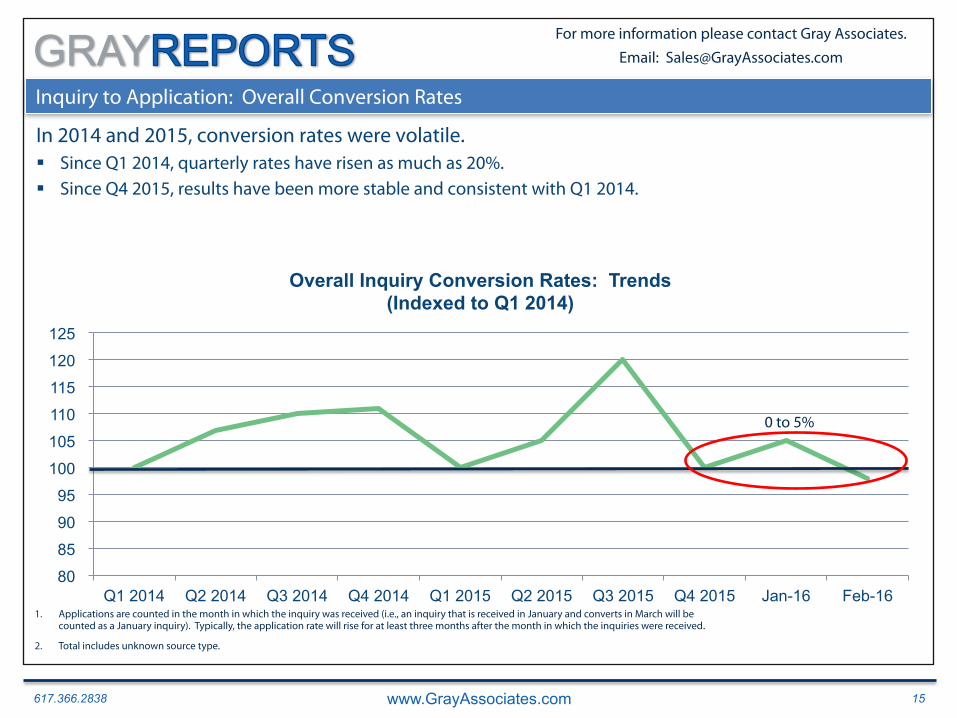
In 2014 and 2015, conversion rates were volatile. § Since Q1 2014, quarterly rates have risen as little as 0% and as much as 20%.
80
85
90
95
100
105
110
115
120
125
Q1 2014 Q2 2014 Q3 2014 Q4 2014 Q1 2015 Q2 2015 Q3 2015 Q4 2015 Jan-16 Feb-16
Overall Inquiry Conversion Rates: Trends (Indexed to Q1 2014)
1. Applications are counted in the month in which the inquiry was received (i.e., an inquiry that is received in January and converts in March will be counted as a January inquiry). Typically, the application rate will rise for at least three months after the month in which the inquiries were received.
2. Total includes unknown source type.
+11%
+20%
+0%
617.366.2838 www.GrayAssociates.com 15
GRAY For more information please contact Gray Associates. Email: [email protected]
Inquiry to Application: Overall Conversion Rates
In 2014 and 2015, conversion rates were volatile. § Since Q1 2014, quarterly rates have risen as much as 20%. § Since Q4 2015, results have been more stable and consistent with Q1 2014.
80
85
90
95
100
105
110
115
120
125
Q1 2014 Q2 2014 Q3 2014 Q4 2014 Q1 2015 Q2 2015 Q3 2015 Q4 2015 Jan-16 Feb-16
Overall Inquiry Conversion Rates: Trends (Indexed to Q1 2014)
1. Applications are counted in the month in which the inquiry was received (i.e., an inquiry that is received in January and converts in March will be counted as a January inquiry). Typically, the application rate will rise for at least three months after the month in which the inquiries were received.
2. Total includes unknown source type.
0 to 5%
617.366.2838 www.GrayAssociates.com 16
GRAY For more information please contact Gray Associates. Email: [email protected]
Overall Student Inquiry Conversions (All Sources)
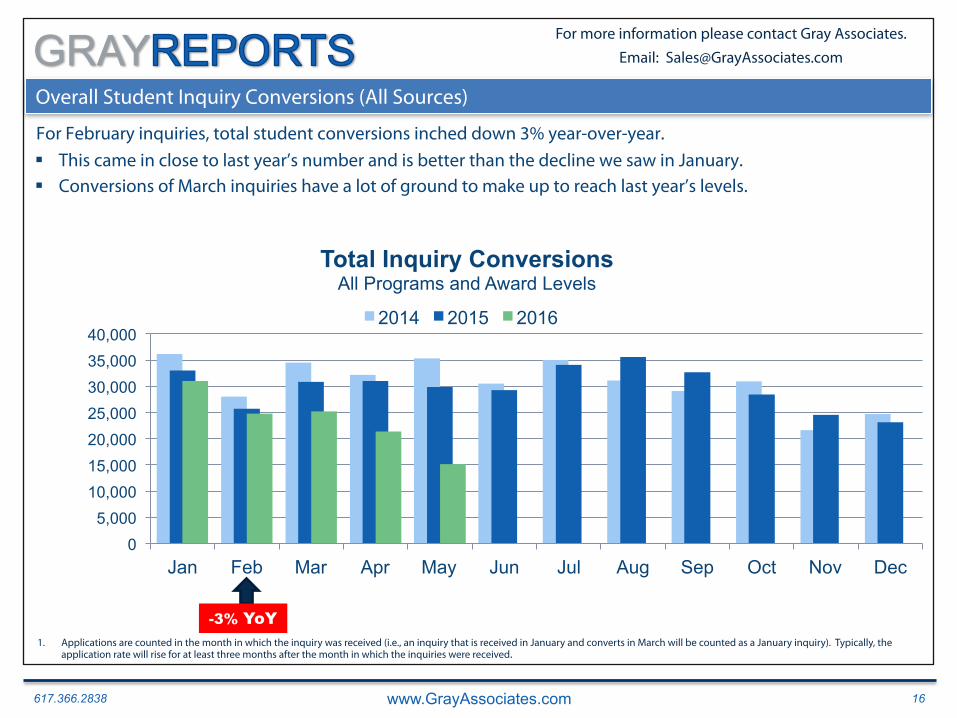
For February inquiries, total student conversions inched down 3% year-over-year. § This came in close to last year’s number and is better than the decline we saw in January. § Conversions of March inquiries have a lot of ground to make up to reach last year’s levels.
1. Applications are counted in the month in which the inquiry was received (i.e., an inquiry that is received in January and converts in March will be counted as a January inquiry). Typically, the application rate will rise for at least three months after the month in which the inquiries were received.
0 5,000
10,000 15,000 20,000 25,000 30,000 35,000 40,000
Jan Feb Mar Apr May Jun Jul Aug Sep Oct Nov Dec
Total Inquiry Conversions All Programs and Award Levels
2014 2015 2016
-3% YoY
617.366.2838 www.GrayAssociates.com 17
GRAY For more information please contact Gray Associates. Email: [email protected]
Overall Student Inquiry Conversions (All Sources)
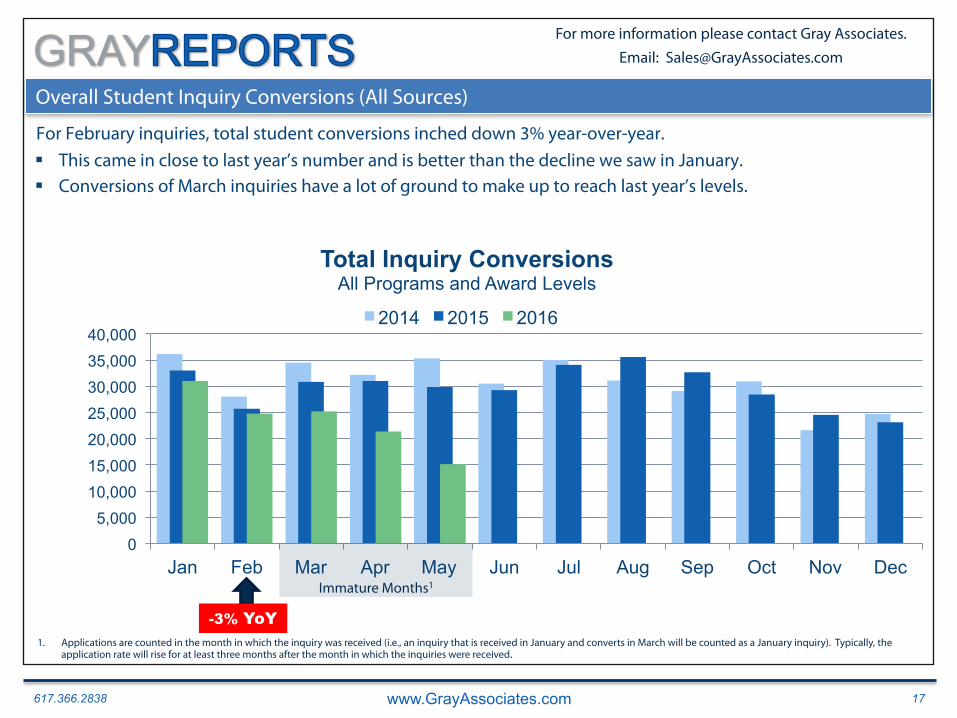
For February inquiries, total student conversions inched down 3% year-over-year. § This came in close to last year’s number and is better than the decline we saw in January. § Conversions of March inquiries have a lot of ground to make up to reach last year’s levels.
1. Applications are counted in the month in which the inquiry was received (i.e., an inquiry that is received in January and converts in March will be counted as a January inquiry). Typically, the application rate will rise for at least three months after the month in which the inquiries were received.
0 5,000
10,000 15,000 20,000 25,000 30,000 35,000 40,000
Jan Feb Mar Apr May Jun Jul Aug Sep Oct Nov Dec
Total Inquiry Conversions All Programs and Award Levels
2014 2015 2016
-3% YoY
Immature Months1
617.366.2838 www.GrayAssociates.com 18
GRAY For more information please contact Gray Associates. Email: [email protected]
Average Price for Pay-per-Inquiry
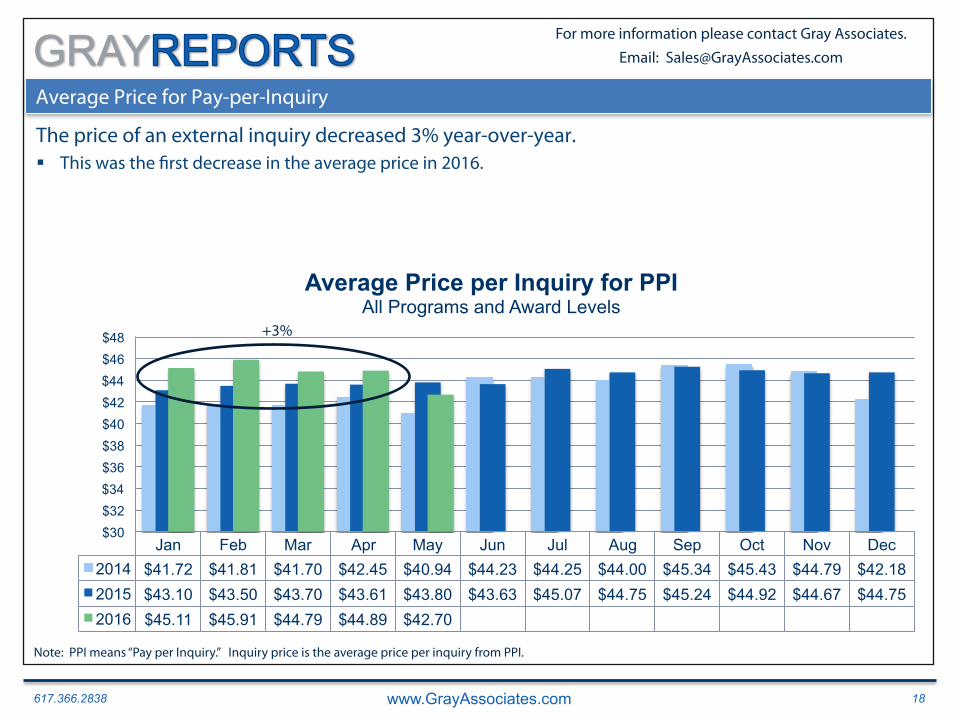
The price of an external inquiry decreased 3% year-over-year. § This was the first decrease in the average price in 2016.
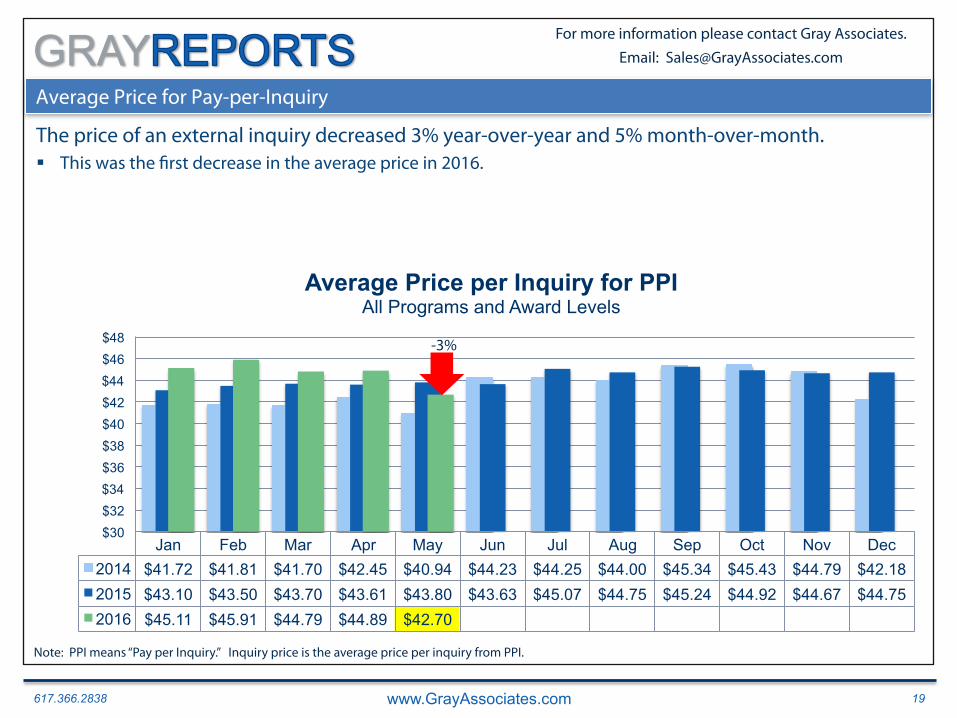
Jan Feb Mar Apr May Jun Jul Aug Sep Oct Nov Dec 2014 $41.72 $41.81 $41.70 $42.45 $40.94 $44.23 $44.25 $44.00 $45.34 $45.43 $44.79 $42.18 2015 $43.10 $43.50 $43.70 $43.61 $43.80 $43.63 $45.07 $44.75 $45.24 $44.92 $44.67 $44.75 2016 $45.11 $45.91 $44.79 $44.89 $42.70
$30 $32 $34 $36 $38 $40 $42 $44 $46 $48
Average Price per Inquiry for PPI All Programs and Award Levels
+3%
Note: PPI means “Pay per Inquiry.” Inquiry price is the average price per inquiry from PPI.
617.366.2838 www.GrayAssociates.com 19
GRAY For more information please contact Gray Associates. Email: [email protected]
Jan Feb Mar Apr May Jun Jul Aug Sep Oct Nov Dec 2014 $41.72 $41.81 $41.70 $42.45 $40.94 $44.23 $44.25 $44.00 $45.34 $45.43 $44.79 $42.18 2015 $43.10 $43.50 $43.70 $43.61 $43.80 $43.63 $45.07 $44.75 $45.24 $44.92 $44.67 $44.75 2016 $45.11 $45.91 $44.79 $44.89 $42.70
$30 $32 $34 $36 $38 $40 $42 $44 $46 $48
Average Price per Inquiry for PPI All Programs and Award Levels
Average Price for Pay-per-Inquiry
The price of an external inquiry decreased 3% year-over-year and 5% month-over-month. § This was the first decrease in the average price in 2016.
Note: PPI means “Pay per Inquiry.” Inquiry price is the average price per inquiry from PPI.
-3%
617.366.2838 www.GrayAssociates.com 20
GRAY For more information please contact Gray Associates. Email: [email protected]
Agenda
1. National Inquiry and Conversion Trends
2. Inquiries and Conversions: Online vs. On-Campus Programs
3. Views by Program and Segment
4. CEB TalentNeuron
5. Summary
617.366.2838 www.GrayAssociates.com 21
GRAY For more information please contact Gray Associates. Email: [email protected]
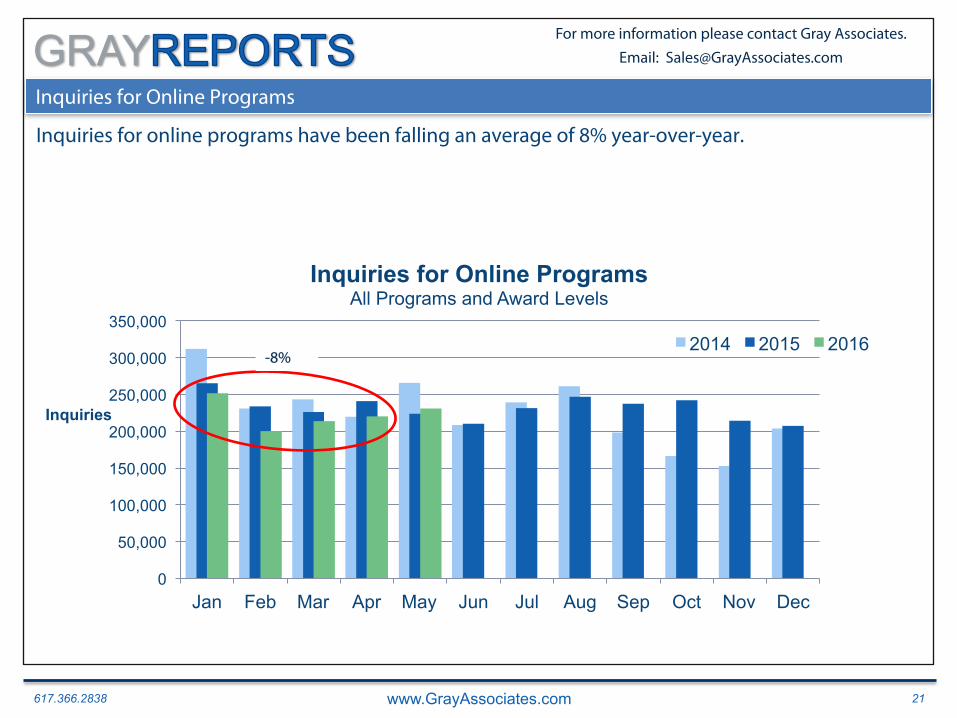
Inquiries for Online Programs Education Industry Inquiries: YOY Percent Change Inquiries for online programs have been falling an average of 8% year-over-year.
0
50,000
100,000
150,000
200,000
250,000
300,000
350,000
Jan Feb Mar Apr May Jun Jul Aug Sep Oct Nov Dec
Inquiries
Inquiries for Online Programs All Programs and Award Levels
2014 2015 2016 -8%
617.366.2838 www.GrayAssociates.com 22
GRAY For more information please contact Gray Associates. Email: [email protected]
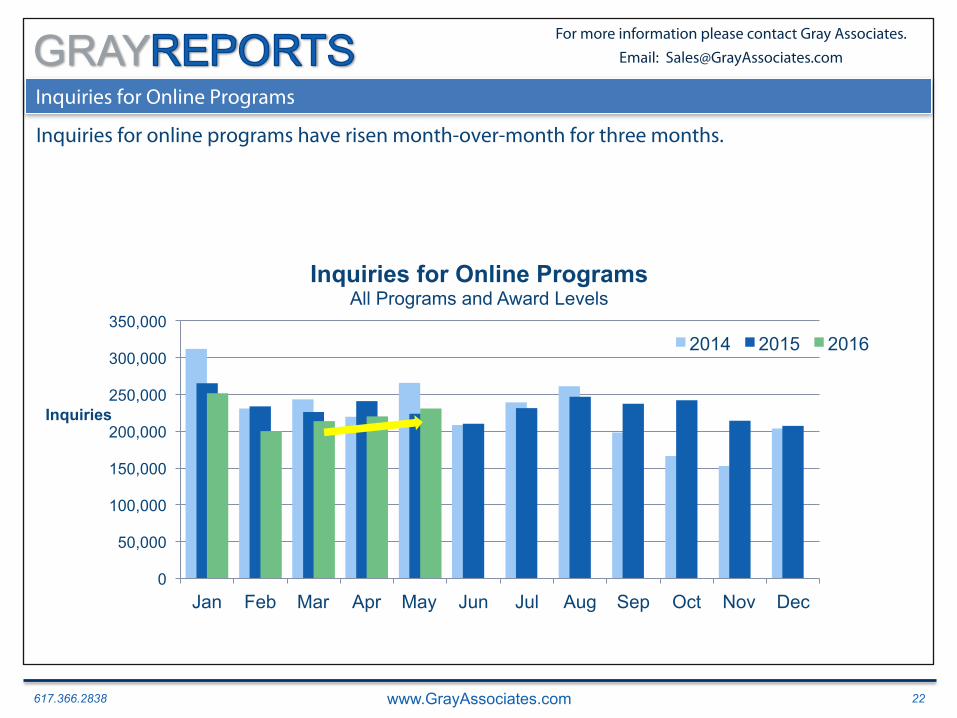
Inquiries for Online Programs Education Industry Inquiries: YOY Percent Change Inquiries for online programs have risen month-over-month for three months.
0
50,000
100,000
150,000
200,000
250,000
300,000
350,000
Jan Feb Mar Apr May Jun Jul Aug Sep Oct Nov Dec
Inquiries
Inquiries for Online Programs All Programs and Award Levels
2014 2015 2016
617.366.2838 www.GrayAssociates.com 23
GRAY For more information please contact Gray Associates. Email: [email protected]
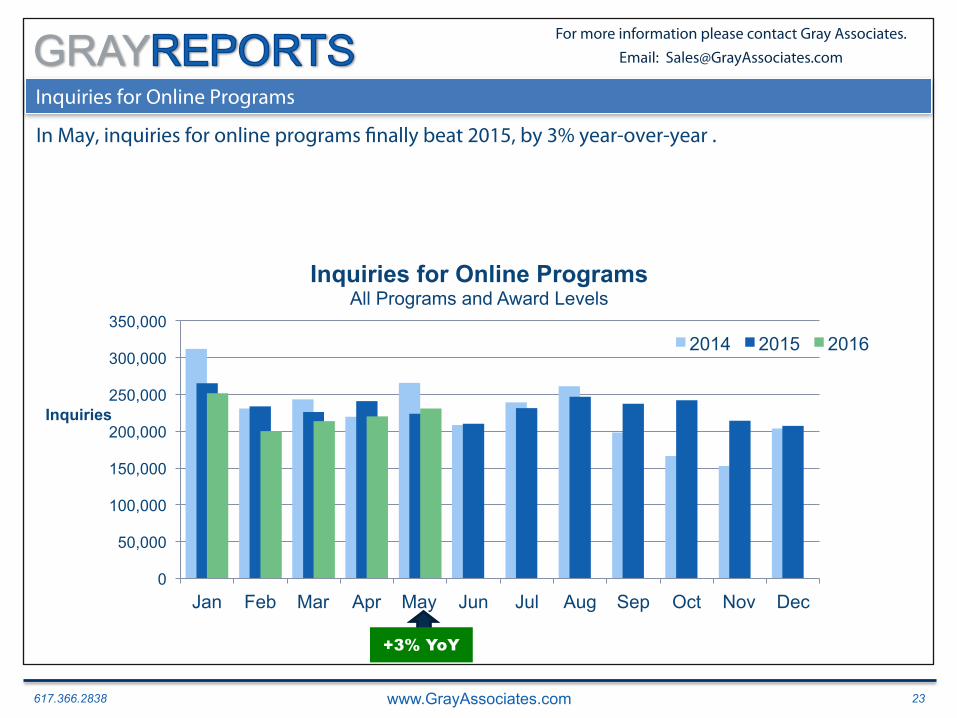
Inquiries for Online Programs Education Industry Inquiries: YOY Percent Change In May, inquiries for online programs finally beat 2015, by 3% year-over-year .
0
50,000
100,000
150,000
200,000
250,000
300,000
350,000
Jan Feb Mar Apr May Jun Jul Aug Sep Oct Nov Dec
Inquiries
Inquiries for Online Programs All Programs and Award Levels
2014 2015 2016
+3% YoY
617.366.2838 www.GrayAssociates.com 24
GRAY For more information please contact Gray Associates. Email: [email protected]
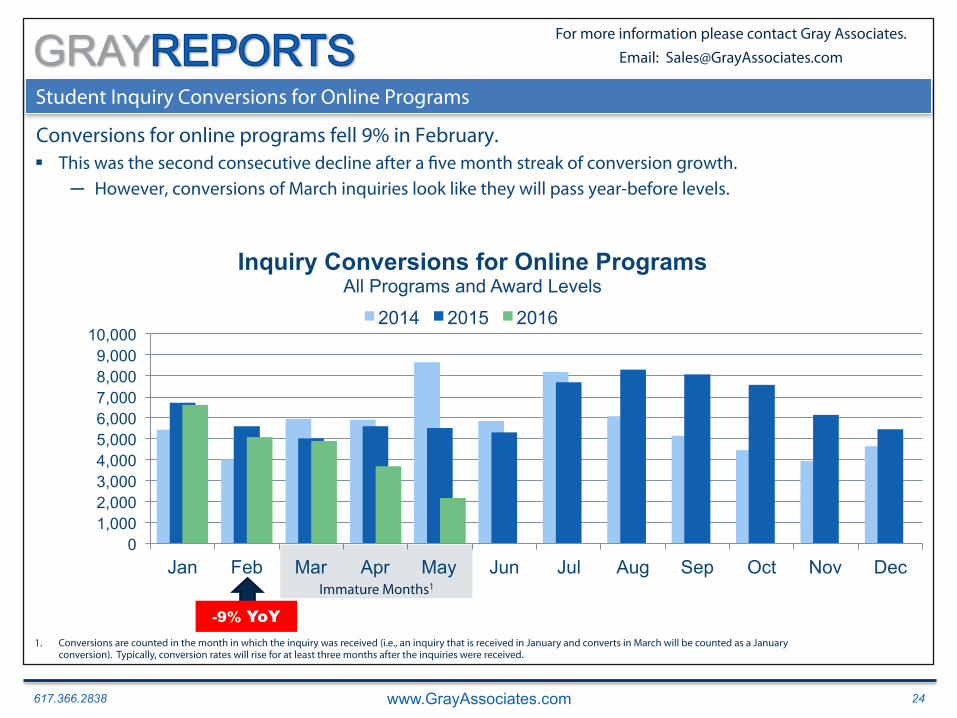
Student Inquiry Conversions for Online Programs
Conversions for online programs fell 9% in February. § This was the second consecutive decline after a five month streak of conversion growth.
─ However, conversions of March inquiries look like they will pass year-before levels.
0 1,000 2,000 3,000 4,000 5,000 6,000 7,000 8,000 9,000
10,000
Jan Feb Mar Apr May Jun Jul Aug Sep Oct Nov Dec
Inquiry Conversions for Online Programs All Programs and Award Levels
2014 2015 2016
Immature Months1
-9% YoY 1. Conversions are counted in the month in which the inquiry was received (i.e., an inquiry that is received in January and converts in March will be counted as a January
conversion). Typically, conversion rates will rise for at least three months after the inquiries were received.
617.366.2838 www.GrayAssociates.com 25
GRAY For more information please contact Gray Associates. Email: [email protected]
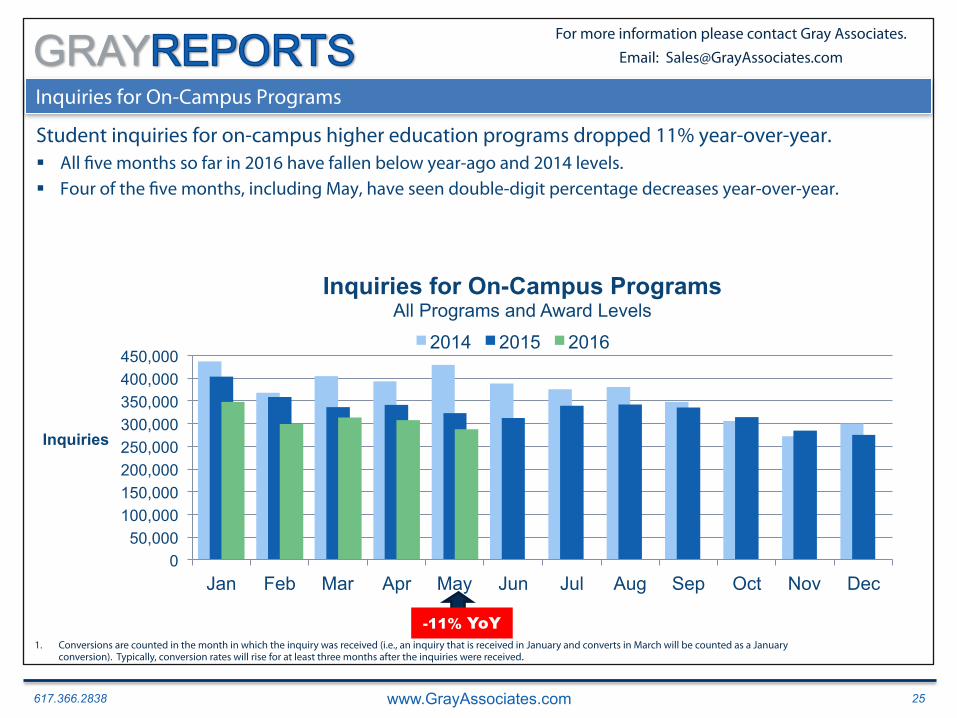
Inquiries for On-Campus Programs
Student inquiries for on-campus higher education programs dropped 11% year-over-year. § All five months so far in 2016 have fallen below year-ago and 2014 levels. § Four of the five months, including May, have seen double-digit percentage decreases year-over-year.
2012
0 50,000
100,000 150,000 200,000 250,000 300,000 350,000 400,000 450,000
Jan Feb Mar Apr May Jun Jul Aug Sep Oct Nov Dec
Inquiries
Inquiries for On-Campus Programs All Programs and Award Levels
2014 2015 2016
-11% YoY 1. Conversions are counted in the month in which the inquiry was received (i.e., an inquiry that is received in January and converts in March will be counted as a January
conversion). Typically, conversion rates will rise for at least three months after the inquiries were received.

617.366.2838 www.GrayAssociates.com 26
GRAY For more information please contact Gray Associates. Email: [email protected]
Student Inquiry Conversions for On-Campus Programs
Conversions for on-campus programs continued to decline—down 22% YoY in February. § Inquiries from the past three months look more promising to reach last year’s conversion levels.
0 2,000 4,000 6,000 8,000
10,000 12,000 14,000 16,000 18,000 20,000
Jan Feb Mar Apr May Jun Jul Aug Sep Oct Nov Dec
Inquiry Conversions for On-Campus Programs All Programs and Award Levels
2014 2015 2016
-22% YOY Immature Months1
1. Conversions are counted in the month in which the inquiry was received (i.e., an inquiry that is received in January and converts in March will be counted as a January conversion). Typically, conversion rates will rise for at least three months after the inquiries were received.

617.366.2838 www.GrayAssociates.com 27
GRAY For more information please contact Gray Associates. Email: [email protected]
Agenda
1. National Inquiry and Conversion Trends
2. Inquiries and Conversions: Online vs. On-Campus Programs
3. Views by Program and Segment
4. CEB TalentNeuron
5. Summary
617.366.2838 www.GrayAssociates.com 28
GRAY For more information please contact Gray Associates. Email: [email protected]
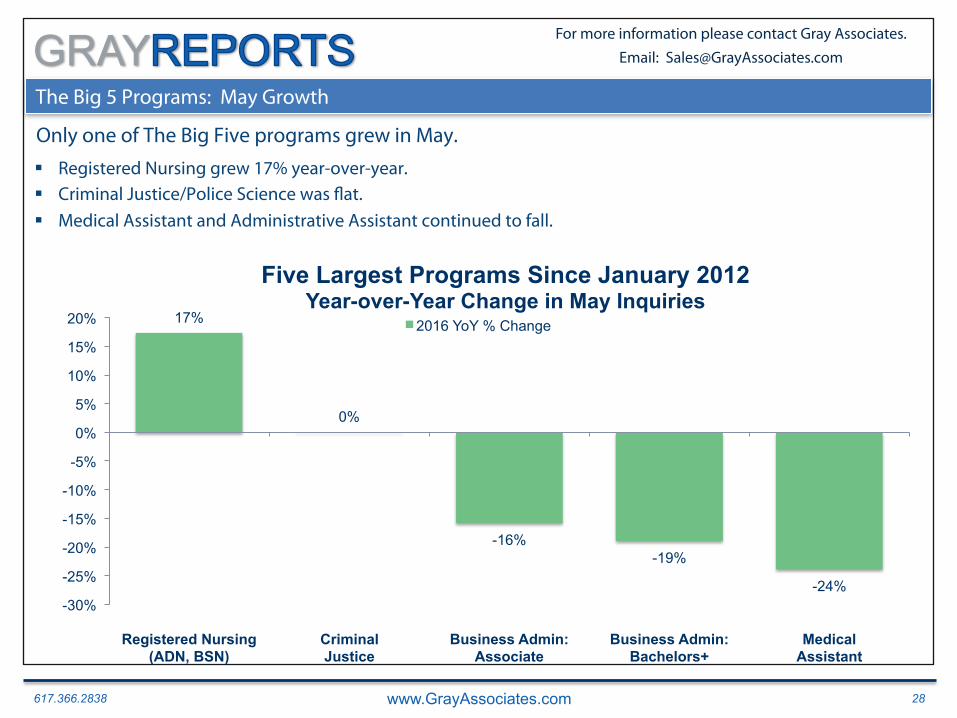
The Big 5 Programs: May Growth
Only one of The Big Five programs grew in May. § Registered Nursing grew 17% year-over-year. § Criminal Justice/Police Science was flat. § Medical Assistant and Administrative Assistant continued to fall.
17%
0%
-16% -19%
-24% -30%
-25%
-20%
-15%
-10%
-5%
0%
5%
10%
15%
20%
Registered Nursing (ADN, BSN)
Criminal Justice
Business Admin: Associate
Business Admin: Bachelors+
Medical Assistant
Five Largest Programs Since January 2012 Year-over-Year Change in May Inquiries
2016 YoY % Change
617.366.2838 www.GrayAssociates.com 29
GRAY For more information please contact Gray Associates. Email: [email protected]
0%
52% 63%
484%
100% 86% 84% 65%
-50%
50%
150%
250%
350%
450%
550%
Psychology Counseling
Welding Computer Programming
Music General
Health Information/ Medical Records
The Fast 5 Year-over-Year Change in May Inquiries
2015 YoY % Change 2016 YoY % Change
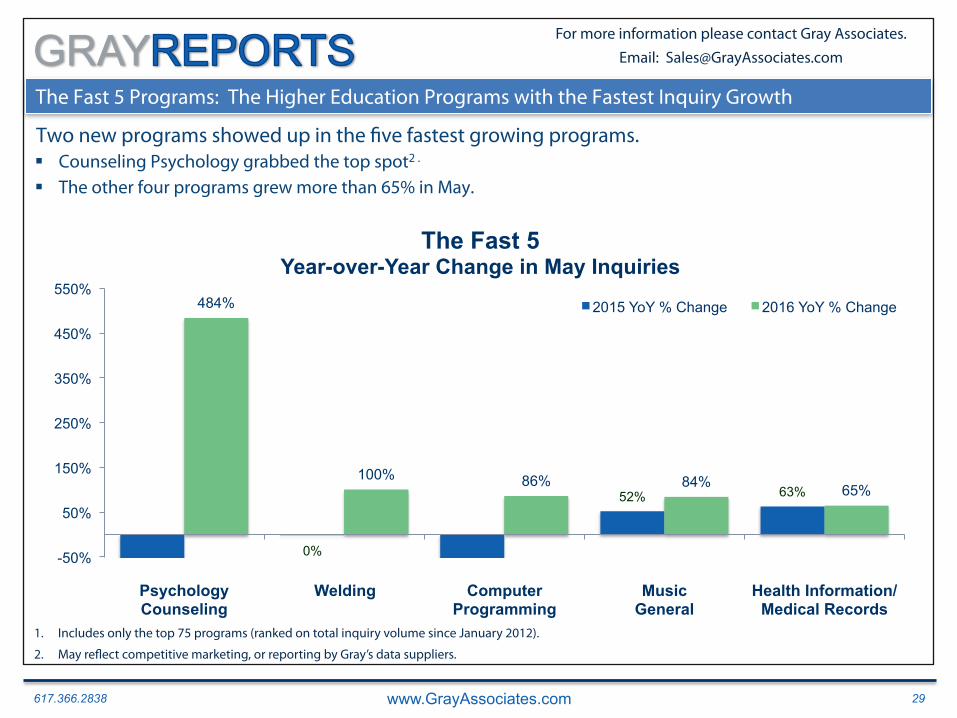
The Fast 5 Programs: The Higher Education Programs with the Fastest Inquiry Growth
Two new programs showed up in the five fastest growing programs. § Counseling Psychology grabbed the top spot2 .
§ The other four programs grew more than 65% in May.
1. Includes only the top 75 programs (ranked on total inquiry volume since January 2012).
2. May reflect competitive marketing, or reporting by Gray’s data suppliers.
617.366.2838 www.GrayAssociates.com 30
GRAY For more information please contact Gray Associates. Email: [email protected]
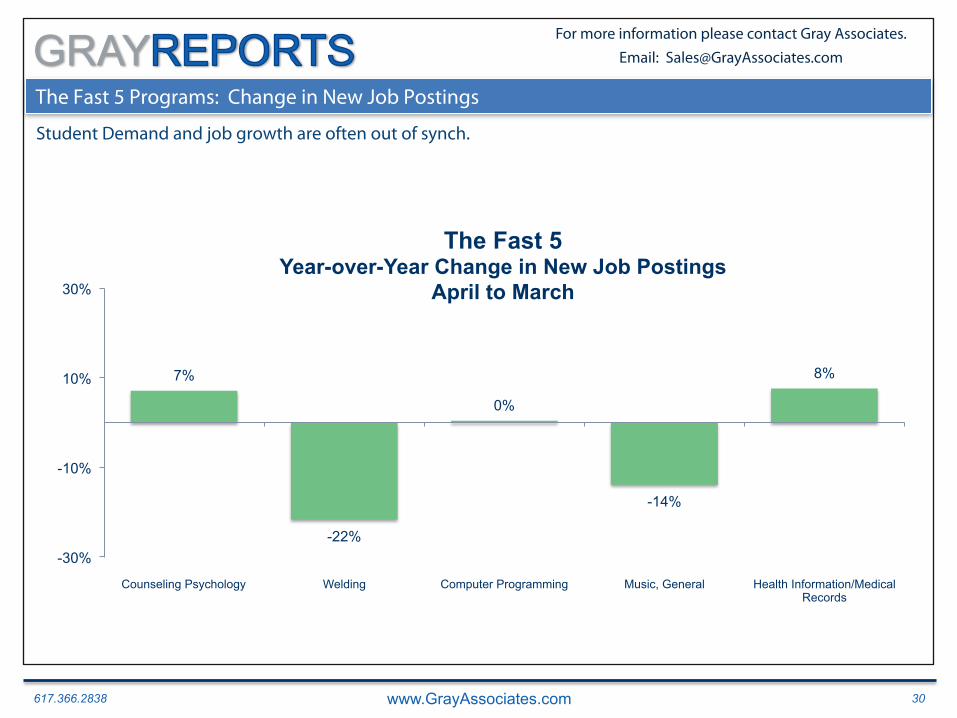
The Fast 5 Programs: Change in New Job Postings
Student Demand and job growth are often out of synch.
7%
-22%
0%
-14%
8%
-30%
-10%
10%
30%
Counseling Psychology Welding Computer Programming Music, General Health Information/Medical Records
The Fast 5 Year-over-Year Change in New Job Postings
April to March
617.366.2838 www.GrayAssociates.com 31
GRAY For more information please contact Gray Associates. Email: [email protected]
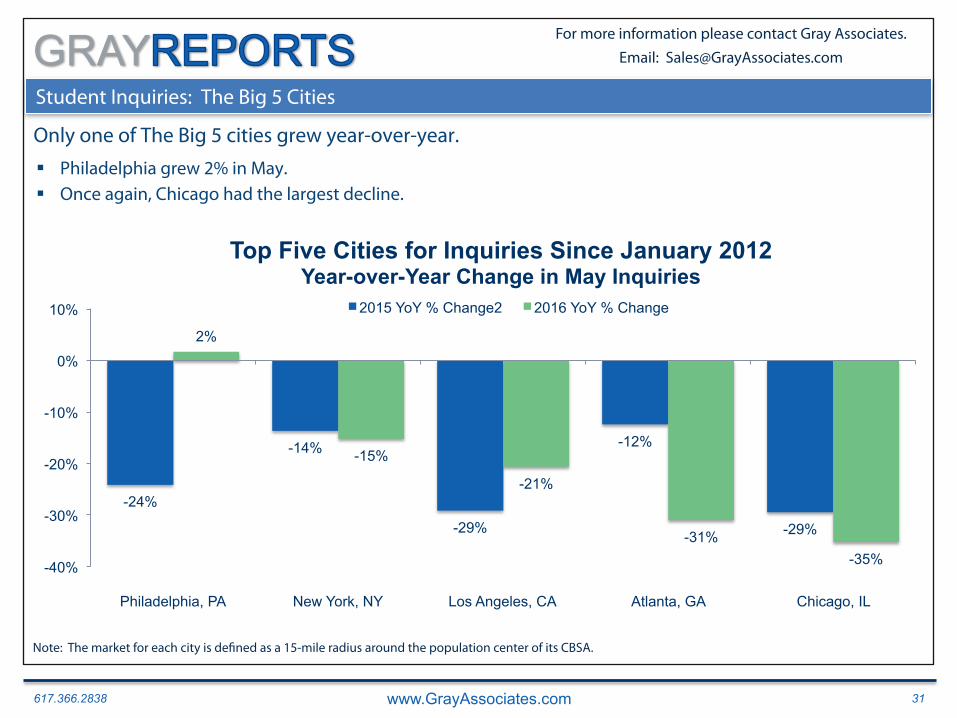
Student Inquiries: The Big 5 Cities
Only one of The Big 5 cities grew year-over-year. § Philadelphia grew 2% in May. § Once again, Chicago had the largest decline.
-24%
-14%
-29%
-12%
-29%
2%
-15%
-21%
-31% -35% -40%
-30%
-20%
-10%
0%
10%
Philadelphia, PA New York, NY Los Angeles, CA Atlanta, GA Chicago, IL
Top Five Cities for Inquiries Since January 2012 Year-over-Year Change in May Inquiries
2015 YoY % Change2 2016 YoY % Change
Note: The market for each city is defined as a 15-mile radius around the population center of its CBSA.
617.366.2838 www.GrayAssociates.com 32
GRAY For more information please contact Gray Associates. Email: [email protected]
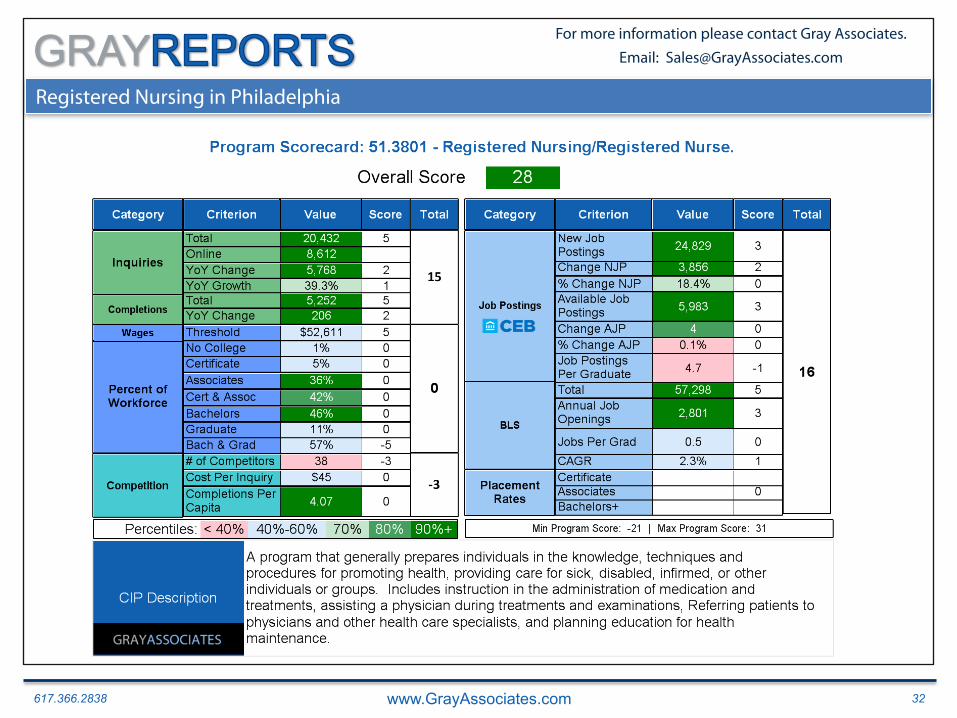
Registered Nursing in Philadelphia
617.366.2838 www.GrayAssociates.com 33
GRAY For more information please contact Gray Associates. Email: [email protected]
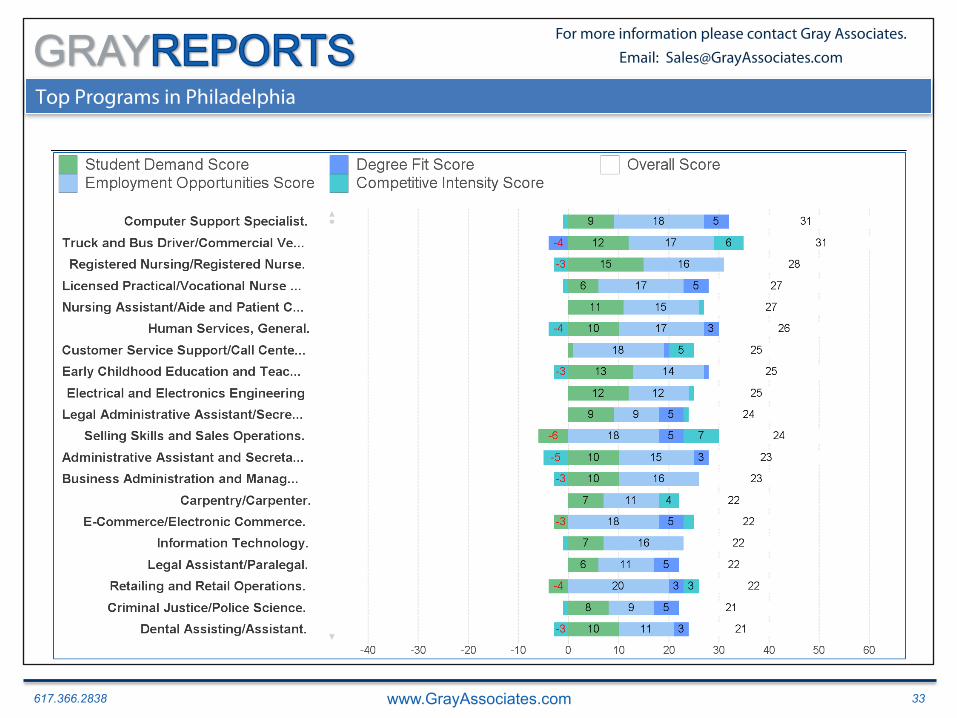
Top Programs in Philadelphia
617.366.2838 www.GrayAssociates.com 34
GRAY For more information please contact Gray Associates. Email: [email protected]
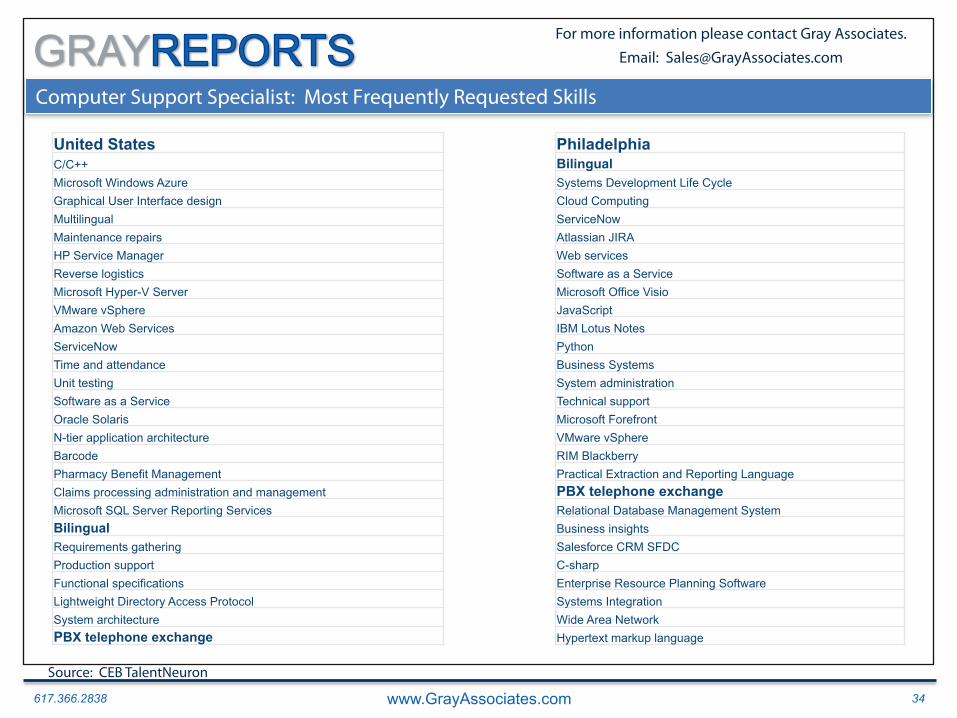
Computer Support Specialist: Most Frequently Requested Skills
United States C/C++ Microsoft Windows Azure Graphical User Interface design Multilingual Maintenance repairs HP Service Manager Reverse logistics Microsoft Hyper-V Server VMware vSphere Amazon Web Services ServiceNow Time and attendance Unit testing Software as a Service Oracle Solaris N-tier application architecture Barcode Pharmacy Benefit Management Claims processing administration and management Microsoft SQL Server Reporting Services Bilingual Requirements gathering Production support Functional specifications Lightweight Directory Access Protocol System architecture PBX telephone exchange
Philadelphia Bilingual Systems Development Life Cycle Cloud Computing ServiceNow Atlassian JIRA Web services Software as a Service Microsoft Office Visio JavaScript IBM Lotus Notes Python Business Systems System administration Technical support Microsoft Forefront VMware vSphere RIM Blackberry Practical Extraction and Reporting Language PBX telephone exchange Relational Database Management System Business insights Salesforce CRM SFDC C-sharp Enterprise Resource Planning Software Systems Integration Wide Area Network Hypertext markup language
Source: CEB TalentNeuron
617.366.2838 www.GrayAssociates.com 35
GRAY For more information please contact Gray Associates. Email: [email protected]
-33%
-25%
-14%
-10%
-9%
-6%
-4%
-3%
1%
6%
-40% -30% -20% -10% 0% 10%
Unknown Degree Associate's External Certificate Campus Branded Online Doctorate Master's Bachelor's
Quarterly Change in Inquiries 2014/2015 vs. 2015/2016 (March – May)
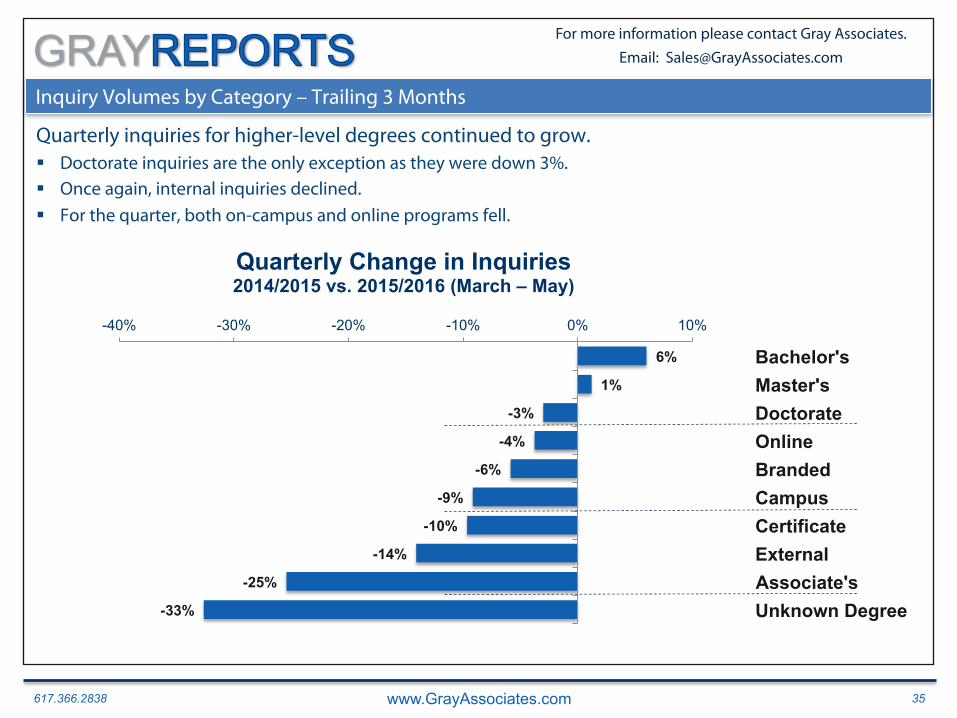
Inquiry Volumes by Category – Trailing 3 Months
Quarterly inquiries for higher-level degrees continued to grow. § Doctorate inquiries are the only exception as they were down 3%. § Once again, internal inquiries declined. § For the quarter, both on-campus and online programs fell.
617.366.2838 www.GrayAssociates.com 36
GRAY For more information please contact Gray Associates. Email: [email protected]
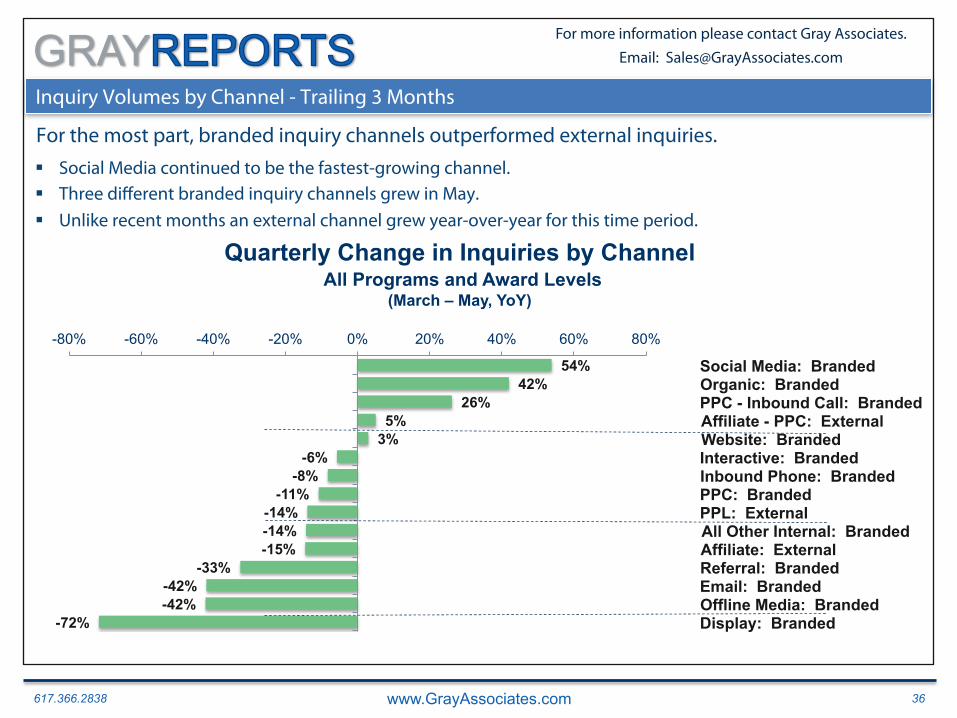
Inquiry Volumes by Channel - Trailing 3 Months
For the most part, branded inquiry channels outperformed external inquiries. § Social Media continued to be the fastest-growing channel. § Three different branded inquiry channels grew in May. § Unlike recent months an external channel grew year-over-year for this time period.
-72% -42% -42%
-33% -15% -14% -14%
-11% -8%
-6% 3% 5%
26% 42%
54%
-80% -60% -40% -20% 0% 20% 40% 60% 80%
Display: Branded Offline Media: Branded Email: Branded Referral: Branded Affiliate: External All Other Internal: Branded PPL: External PPC: Branded Inbound Phone: Branded Interactive: Branded Website: Branded Affiliate - PPC: External PPC - Inbound Call: Branded Organic: Branded Social Media: Branded
Quarterly Change in Inquiries by Channel All Programs and Award Levels
(March – May, YoY)
617.366.2838 www.GrayAssociates.com 37
GRAY For more information please contact Gray Associates. Email: [email protected]
Agenda
1. National Inquiry and Conversion Trends
2. Inquiries and Conversions: Online vs. On-Campus Programs
3. Views by Program and Segment
4. CEB TalentNeuron
5. Summary
CEB TalentNeuron™
39
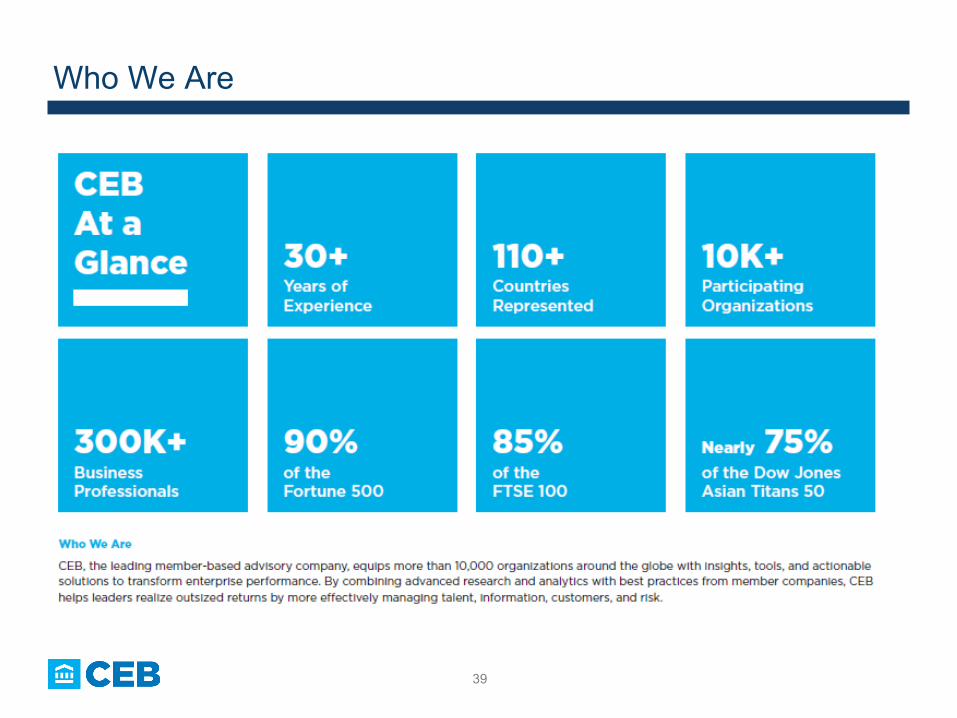
Who We Are
40
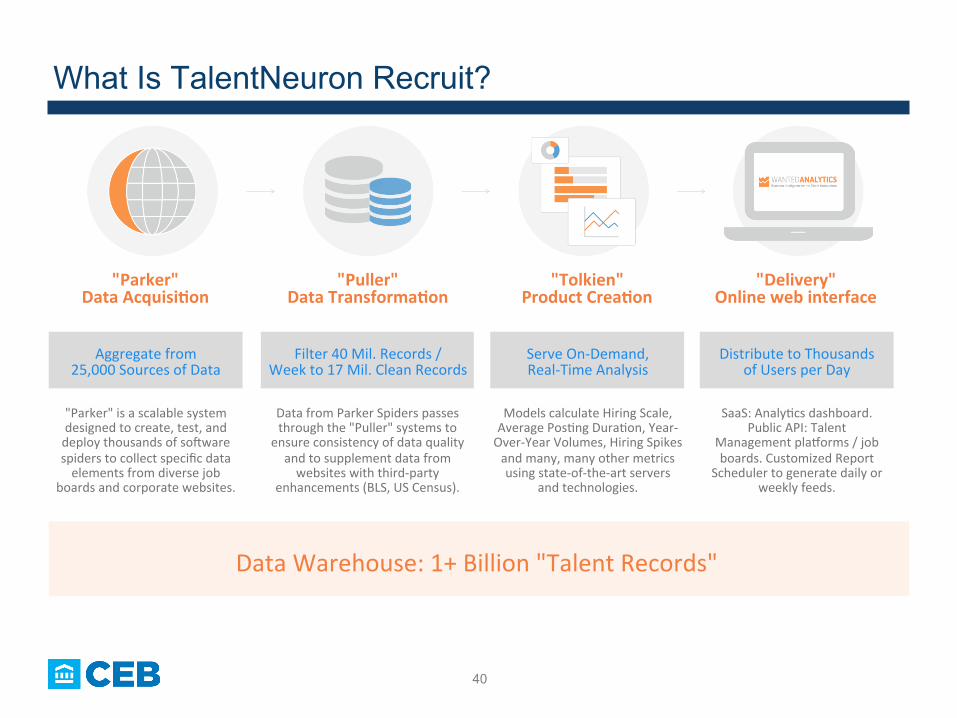
What Is TalentNeuron Recruit?
Data Warehouse: 1+ Billion "Talent Records"
Data from Parker Spiders passes through the "Puller" systems to
ensure consistency of data quality and to supplement data from websites with third-‐party
enhancements (BLS, US Census).
"Parker" is a scalable system designed to create, test, and deploy thousands of soKware spiders to collect specific data elements from diverse job
boards and corporate websites.
Models calculate Hiring Scale, Average PosRng DuraRon, Year-‐Over-‐Year Volumes, Hiring Spikes and many, many other metrics using state-‐of-‐the-‐art servers
and technologies.
SaaS: AnalyRcs dashboard. Public API: Talent
Management plaWorms / job boards. Customized Report
Scheduler to generate daily or weekly feeds.
"Parker" Data Acquisi0on
"Puller" Data Transforma0on
"Delivery" Online web interface
"Tolkien" Product Crea0on
Distribute to Thousands of Users per Day
Serve On-‐Demand, Real-‐Time Analysis
Filter 40 Mil. Records / Week to 17 Mil. Clean Records
Aggregate from 25,000 Sources of Data
41
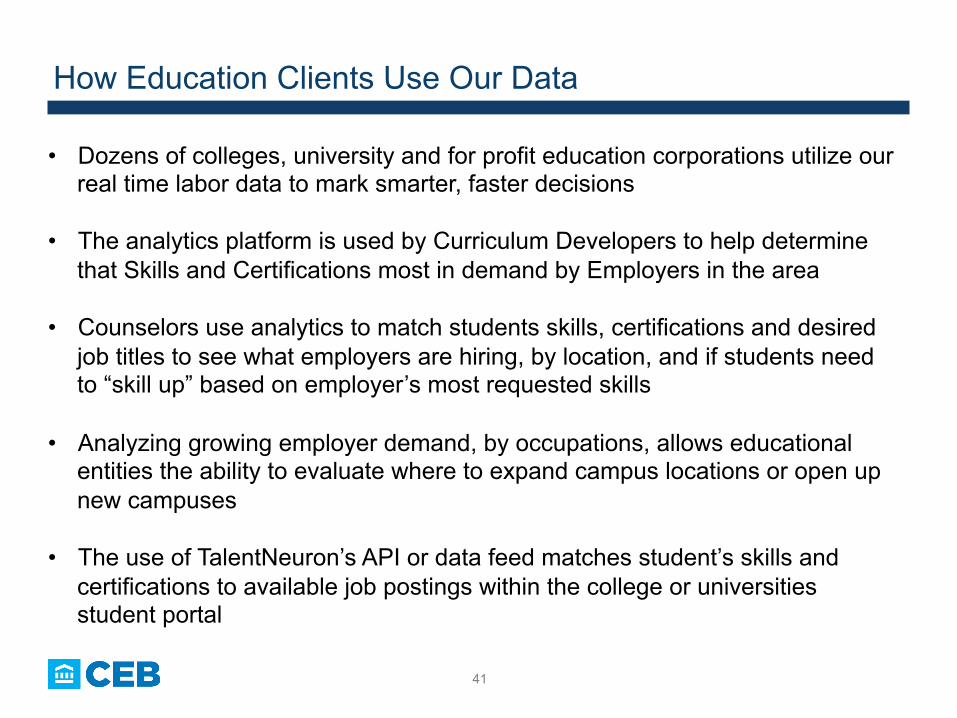
How Education Clients Use Our Data
• Dozens of colleges, university and for profit education corporations utilize our real time labor data to mark smarter, faster decisions
• The analytics platform is used by Curriculum Developers to help determine
that Skills and Certifications most in demand by Employers in the area
• Counselors use analytics to match students skills, certifications and desired job titles to see what employers are hiring, by location, and if students need to “skill up” based on employer’s most requested skills
• Analyzing growing employer demand, by occupations, allows educational entities the ability to evaluate where to expand campus locations or open up new campuses
• The use of TalentNeuron’s API or data feed matches student’s skills and certifications to available job postings within the college or universities student portal
42
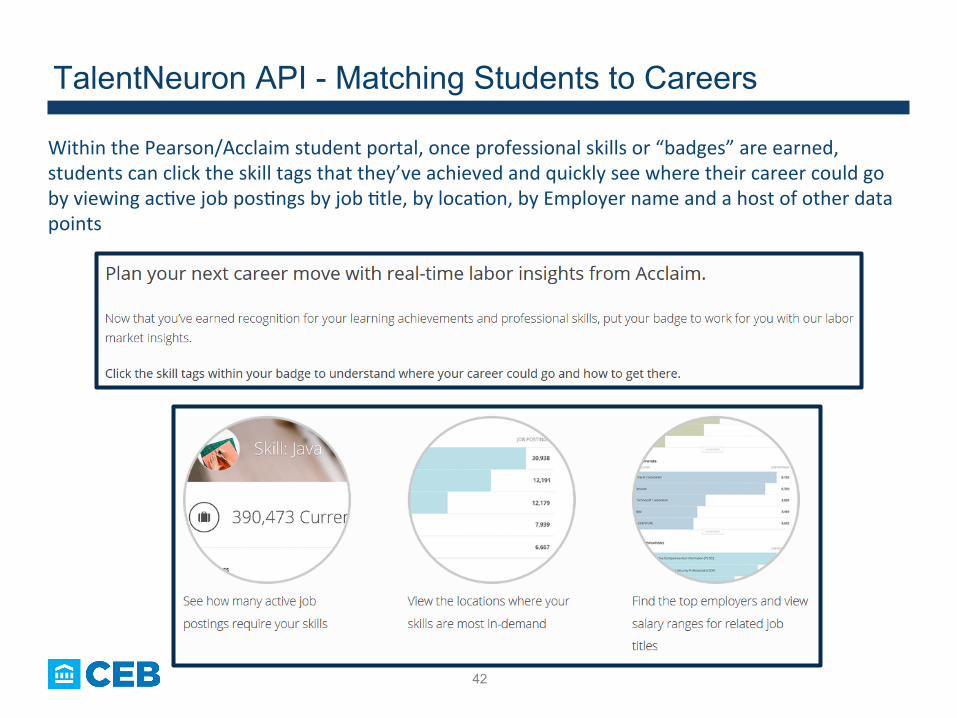
TalentNeuron API - Matching Students to Careers
Within the Pearson/Acclaim student portal, once professional skills or “badges” are earned, students can click the skill tags that they’ve achieved and quickly see where their career could go by viewing acRve job posRngs by job Rtle, by locaRon, by Employer name and a host of other data points
43
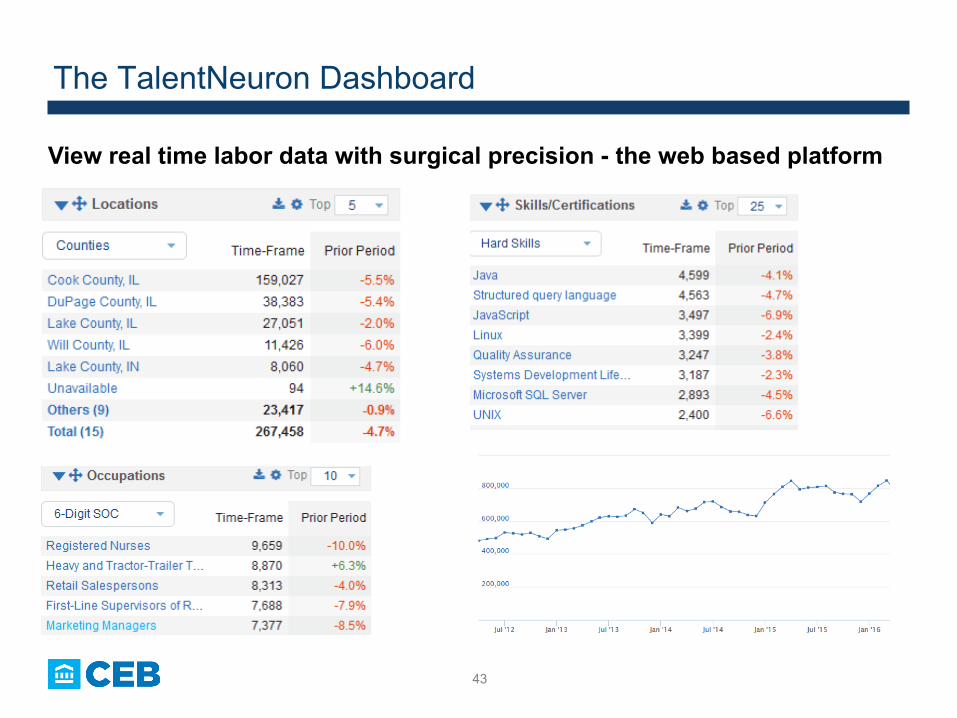
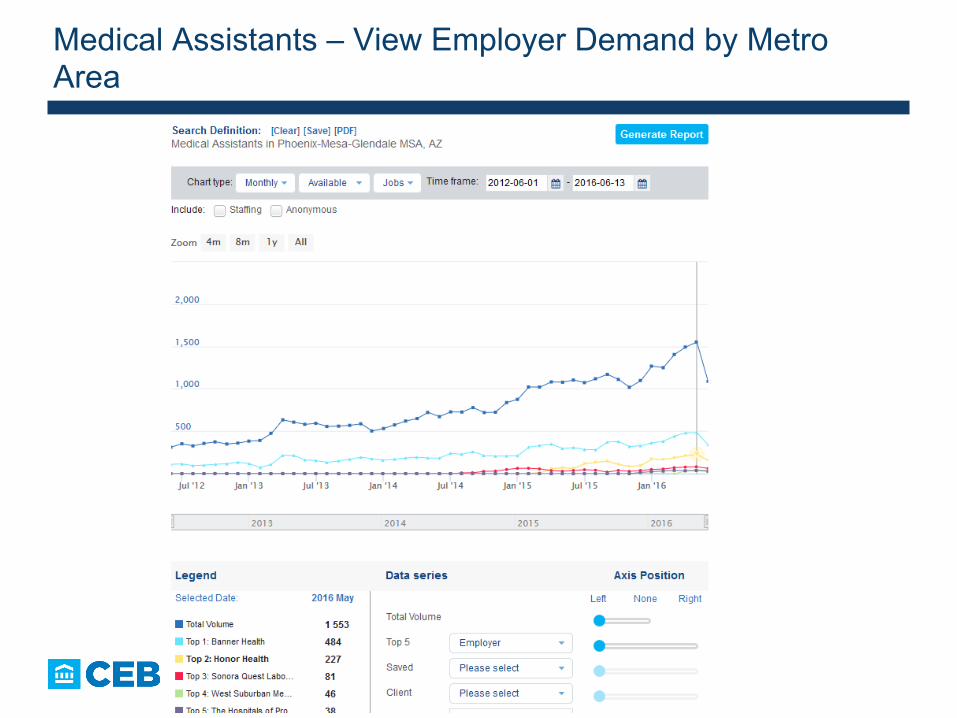
The TalentNeuron Dashboard
View real time labor data with surgical precision - the web based platform
44
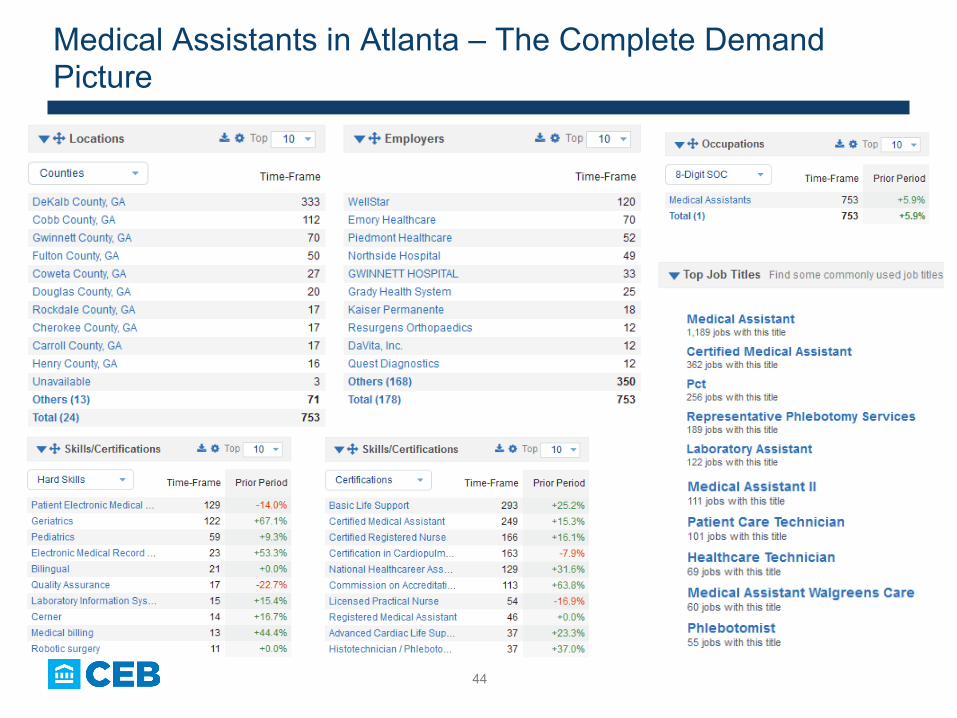
Medical Assistants in Atlanta – The Complete Demand Picture
45
Medical Assistants – View Employer Demand by Metro Area
46
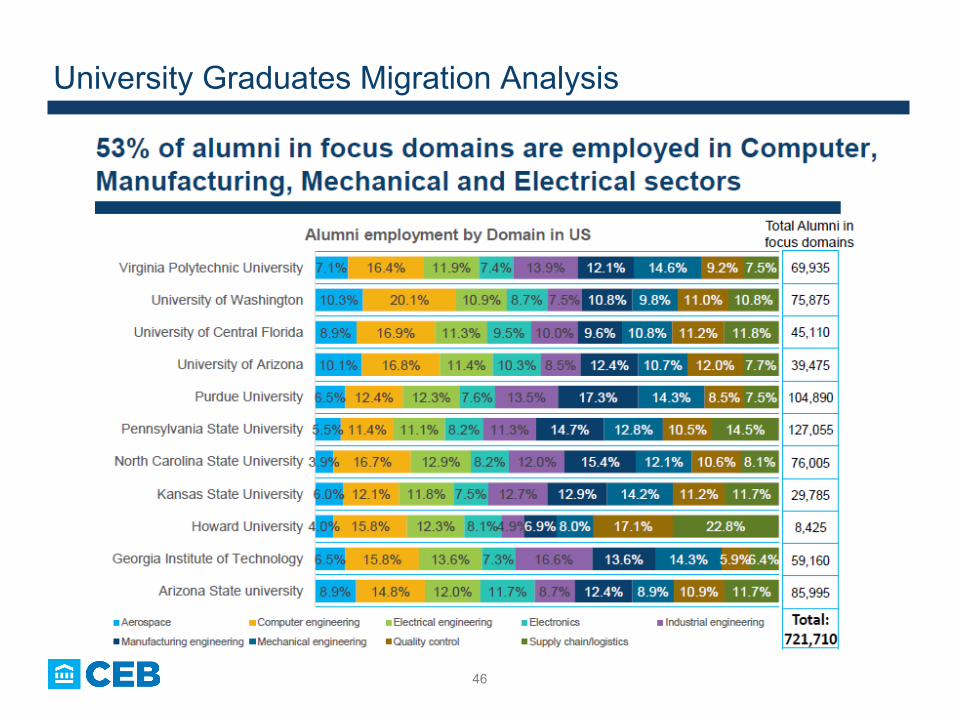
University Graduates Migration Analysis
617.366.2838 www.GrayAssociates.com 47
GRAY For more information please contact Gray Associates. Email: [email protected]
Agenda
1. National Inquiry and Conversion Trends
2. Inquiries and Conversions: Online vs. On-Campus Programs
3. Views by Program and Segment
4. CEB TalentNeuron
5. Summary
617.366.2838 www.GrayAssociates.com 48
GRAY For more information please contact Gray Associates. Email: [email protected]
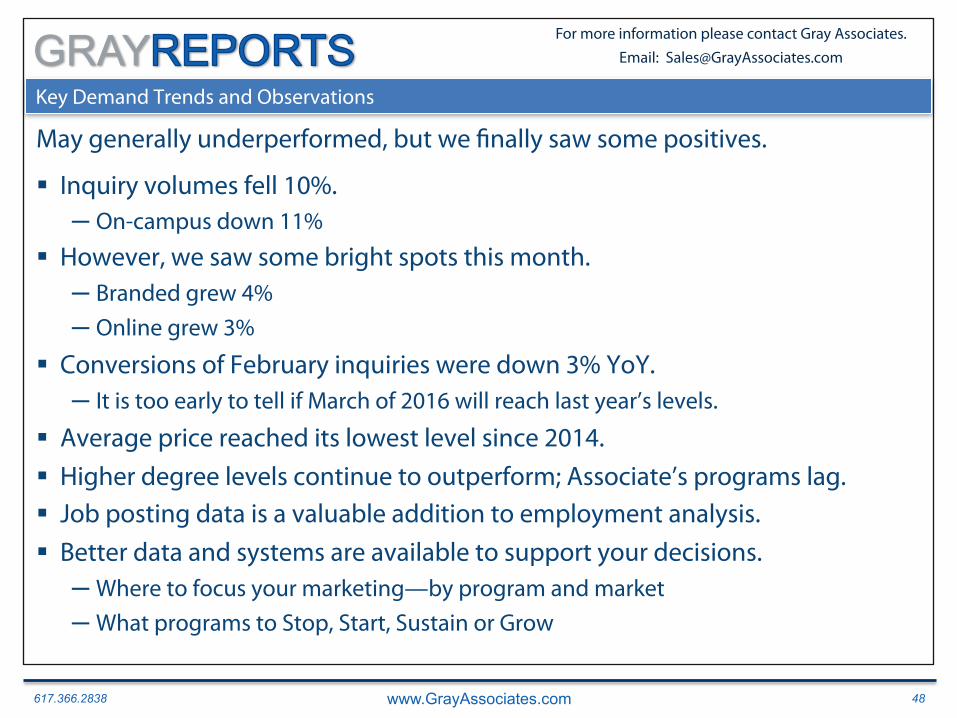
Key Demand Trends and Observations
May generally underperformed, but we finally saw some positives.
§ Inquiry volumes fell 10%. ─ On-campus down 11%
§ However, we saw some bright spots this month. ─ Branded grew 4% ─ Online grew 3%
§ Conversions of February inquiries were down 3% YoY. ─ It is too early to tell if March of 2016 will reach last year’s levels.
§ Average price reached its lowest level since 2014. § Higher degree levels continue to outperform; Associate’s programs lag. § Job posting data is a valuable addition to employment analysis. § Better data and systems are available to support your decisions. ─ Where to focus your marketing—by program and market ─ What programs to Stop, Start, Sustain or Grow
617.366.2838 www.GrayAssociates.com 49
GRAY For more information please contact Gray Associates. Email: [email protected]
Questions and Contacts
Please feel free to contact:
Bob Atkins CEO
Gray Associates, Inc.
[email protected] @Gray_Associates
617.366.2836
617.366.2838 www.GrayAssociates.com 50
GRAY For more information please contact Gray Associates. Email: [email protected]
Upcoming Gray Associates’ Webinars
Please join us next month!
July Webinar (June Results)
Thursday, July 21st at 2:00 PM EDT