2015 october grayreports - student demand trends
TRANSCRIPT

GRAYREPORTS Demand for Educational Programs
www.GrayAssociates.com
Results through October 2015
617.366.2838 www.GrayAssociates.com 2
GRAY For more information please contact Gray Associates. Email: [email protected]
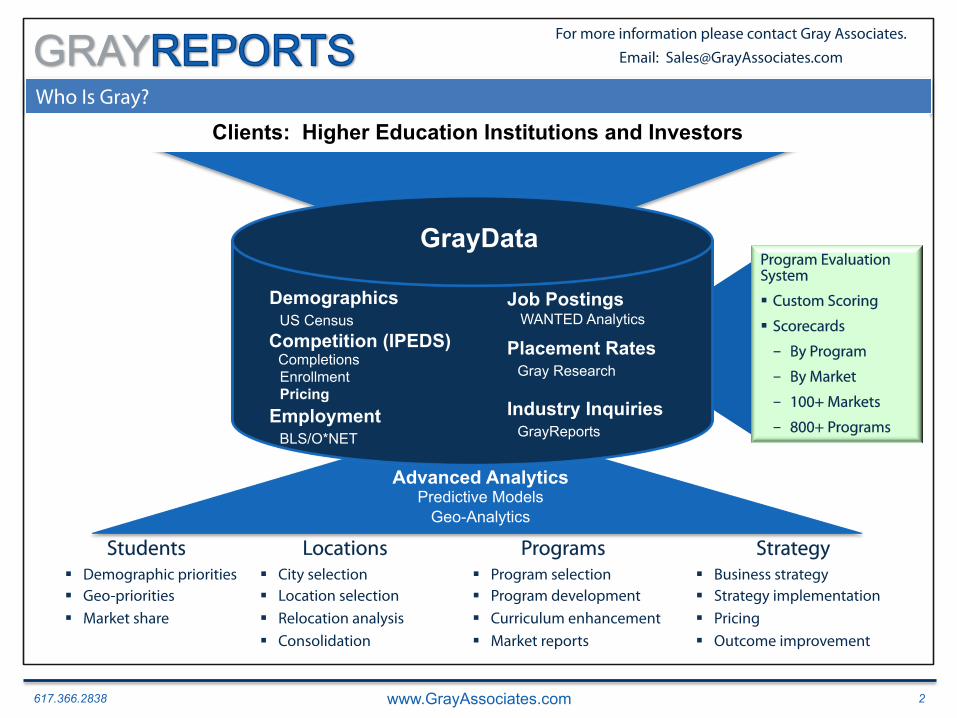
Who Is Gray?
GrayData
Completions
Enrollment Pricing Employment BLS/O*NET
Placement Rates Gray Research
Industry Inquiries GrayReports
Demographics US Census
Job Postings WANTED Analytics
Students Programs Strategy Locations § Demographic priorities § Geo-priorities § Market share
§ City selection § Location selection § Relocation analysis § Consolidation
§ Program selection § Program development § Curriculum enhancement § Market reports
§ Business strategy § Strategy implementation § Pricing § Outcome improvement
Advanced Analytics Predictive Models
Geo-Analytics
Clients: Higher Education Institutions and Investors
Competition (IPEDS)
Program Evaluation System
§ Custom Scoring
§ Scorecards
- By Program
- By Market
- 100+ Markets
- 800+ Programs

617.366.2838 www.GrayAssociates.com 3
GRAY For more information please contact Gray Associates. Email: [email protected]
What is GrayReports?
GrayReports tracks demand for higher education.
§ Today’s webinar and monthly industry trend reports are free. § Paid subscribers receive custom monthly reports for their markets and programs. § Paid subscribers also have on-line access to detailed data for their programs and markets.
Over 40 million qualified inquiries January 2012 to the present
Over 800,000 new inquiries in October 2015 Over 200 programs with over 10,000 inquiries
Over 300 cities with over 10,000 inquiries

617.366.2838 www.GrayAssociates.com 4
GRAY For more information please contact Gray Associates. Email: [email protected]
Key Demand Trends and Observations
Demand is up!
§ In October, overall inquiries are up year over year. ─ First back-to-back increases in a very long time (September was up 3%) ─ Up 14% overall year-over-year ─ Internal/branded inquiries up 29% ─ On-line programs up 46% ─ Even inquiries for on-ground programs rose 2.7% ─ Master’s-degree and Doctoral programs up 79% and 64%, respectively
§ Conversion rates are also up—and will get better.

617.366.2838 www.GrayAssociates.com 5
GRAY For more information please contact Gray Associates. Email: [email protected]
Agenda
1. National Inquiry Trends
2. Inquiries and Conversions: On-Line vs. On-Ground Programs
3. Views by Program and Segment
4. Program Feasibility Study
5. Summary

617.366.2838 www.GrayAssociates.com 6
GRAY For more information please contact Gray Associates. Email: [email protected]
Overall Student Inquiries (All Sources)
For two months in a row, student inquiry volumes for higher education have surpassed 2014 levels.
§ Before September of 2015, May of 2014 was the last time we experienced year-over-year growth. § Year-to-date, 2015 inquiry volumes rest 4% behind 2014 levels. § But, October jumped 14% year-over-year.
-
200,000
400,000
600,000
800,000
1,000,000
1,200,000
Jan Feb Mar Apr May Jun Jul Aug Sep Oct Nov Dec
National Inquiries All Programs and Award Levels 2014 2015
14% YOY

617.366.2838 www.GrayAssociates.com 7
GRAY For more information please contact Gray Associates. Email: [email protected]
Branded Inquiries: Overall Results
Branded student inquiries are booming for higher education institutions.
§ Year-to-date, 2015 branded inquiries were up 5.2% versus 2014. § After a weak summer, October was the third consecutive month with year-over-year growth.
§ Year-over-year, September 2015 was up 14% and October branded inquiries were up almost 30%.
0
50000
100000
150000
200000
250000
300000
Jan Feb Mar Apr May Jun Jul Aug Sep Oct Nov Dec
National Branded Inquiries All Programs and Award Levels 2014 2015
29% YOY

617.366.2838 www.GrayAssociates.com 8
GRAY For more information please contact Gray Associates. Email: [email protected]
1. Applications are counted in the month in which the inquiry was received (i.e., an inquiry that is received in January and converts in March will be counted as a January inquiry). Typically, the application rate will rise for at least three months after the month in which the inquiries were received.
3.5% 3.0%
1.9% 2.8%
2.5%
1.8%
0.0%
0.5%
1.0%
1.5%
2.0%
2.5%
3.0%
3.5%
4.0%
4.5%
Jan Feb Mar Apr May Jun Jul Aug Sep Oct Nov Dec
Education Industry Conversion Rates 2014 2015 Average Immature Conversion Rate
Inquiry to Application: Conversion Rates
Conversion rates for higher education continued to trend up–July may yet hit 2014 levels. § In August, for the first time in 2015, the conversion rate beat year-ago levels. § August, September and October (all immature months) are ahead of the average pace. § The conversion rate for July, the most recent mature month, was 3.8%.
Immature Months1
2015 Mature Month Average: 3.3%

617.366.2838 www.GrayAssociates.com 9
GRAY For more information please contact Gray Associates. Email: [email protected]
Average Price for Pay-per-Lead Inquiries
The price of an external inquiry for higher education has averaged about $45 for four consecutive months.
§ Through August, prices rose year-over-year in 7 out of 8 months. § But, the average price in October was $44.96–down 1% year-over-year; September prices also fell.
Jan Feb Mar Apr May Jun Jul Aug Sep Oct Nov Dec 2014 $41.72 $41.81 $41.70 $42.45 $40.94 $44.23 $44.25 $44.00 $45.34 $45.41 $44.79 $42.18 2015 $43.10 $43.50 $43.70 $43.61 $43.80 $43.63 $45.07 $44.75 $45.24 $44.96
$30
$32
$34
$36
$38
$40
$42
$44
$46
$48
Average Price per Inquiry for PPI All Programs and Award Levels
Note: PPI means “Pay per Inquiry.” Inquiry price is the average price per inquiry from PPI.

617.366.2838 www.GrayAssociates.com 10
GRAY For more information please contact Gray Associates. Email: [email protected]
Agenda
1. National Inquiry Trends
2. Inquiries and Conversions: On-Line vs. On-Ground Programs
3. Views by Program and Segment
4. Program Feasibility Study
5. Summary

617.366.2838 www.GrayAssociates.com 11
GRAY For more information please contact Gray Associates. Email: [email protected]
Inquiries for On-Line Programs Education Industry Inquiries: YOY Percent Change Student demand for on-line programs rose a whopping 46% in October.
§ October follows a September that exceeded year-ago inquiry volumes by 20%. § Year-to-date inquiries for on-line programs have now surpassed 2014 levels by 1%.
0
50,000
100,000
150,000
200,000
250,000
300,000
350,000
Jan Feb Mar Apr May Jun Jul Aug Sep Oct Nov Dec
Inquiries
Inquiries for On-Line Programs All Programs and Award Levels
2014 2015
46% YOY

617.366.2838 www.GrayAssociates.com 12
GRAY For more information please contact Gray Associates. Email: [email protected]
Student Inquiry Conversions for On-Line Programs
July fell 19% below last year’s conversion volume. August and September are ahead—and will get better.
§ Year-to-date, conversions for on-line higher education programs are down 15%. § August and September are already up over 10% and are likely to finish up 15% or more.
1. Applications are counted in the month in which the inquiry was received (i.e., an inquiry that is received in January and converts in March will be counted as a January inquiry). Typically, the application rate will rise for at least three months after the month in which the inquiries were received.
0 1,000 2,000 3,000 4,000 5,000 6,000 7,000 8,000 9,000
Jan Feb Mar Apr May Jun Jul Aug Sep Oct Nov Dec
Inquiry Conversions for On-Line Programs All Programs and Award Levels
2014 2015
Immature Months1 -19% YOY

617.366.2838 www.GrayAssociates.com 13
GRAY For more information please contact Gray Associates. Email: [email protected]
Inquiries for On-Ground Programs
For the first time this year, student demand for on-campus programs grew in October.
§ Year-to-date, student demand for on-ground programs has dipped 11% behind 2014 levels. § In contrast, Q4 got off to a promising start, October surpassed 2014 by 2.7%.
2012
0 50,000
100,000 150,000 200,000 250,000 300,000 350,000 400,000 450,000
Jan Feb Mar Apr May Jun Jul Aug Sep Oct Nov Dec
Inquiries
Inquiries for On-Ground Programs All Programs and Award Levels
2014 2015
+2.7% YOY

617.366.2838 www.GrayAssociates.com 14
GRAY For more information please contact Gray Associates. Email: [email protected]
On-campus programs in higher education continue to struggle for applications. § July matured 38% behind year-ago levels. § Excluding immature months (August through October) 2015 is 32% behind 2014. § It is too early to tell, but October does not look promising.
0 2,000 4,000 6,000 8,000
10,000 12,000 14,000 16,000 18,000 20,000
Jan Feb Mar Apr May Jun Jul Aug Sep Oct Nov Dec
Inquiry Conversions for On-Ground Programs All Programs and Award Levels
2014 2015
Immature Months1
Student Inquiry Conversions for On-Ground Programs
1. Applications are counted in the month in which the inquiry was received (i.e., an inquiry that is received in January and converts in March will be counted as a January inquiry). Typically, the application rate will rise for at least three months after the month in which the inquiries were received.
-38% YOY

617.366.2838 www.GrayAssociates.com 15
GRAY For more information please contact Gray Associates. Email: [email protected]
Agenda
1. National Inquiry Trends
2. Inquiries and Conversions: On-Line vs. On-Ground Programs
3. Views by Program and Segment
4. Program Feasibility Study
5. Summary

617.366.2838 www.GrayAssociates.com 16
GRAY For more information please contact Gray Associates. Email: [email protected]
Largest Programs: October Growth
Three of the five largest programs in higher education experienced year-over-year positive growth.
§ Registered Nursing continued to be the hottest large program–up 114% in October of 2015. § Criminal Justice and Business Administration grew 27% and 17% respectively. § Medical/Clinical Assistant and Health Care Administration shrank in September and again in October.
-1%
-38%
-77%
-28% -15%
114%
27% 17%
-13% -23%
-100%
-50%
0%
50%
100%
150%
Registered Nursing Business Administration and Management
Criminal Justice/Police Science
Medical/Clinical Assistant Health Care Administration
Demand for Higher Education Year-over-Year Change in October Inquiries
Five Largest Programs
2014 YoY % Change 2015 YoY % Change

617.366.2838 www.GrayAssociates.com 17
GRAY For more information please contact Gray Associates. Email: [email protected]
-89%
-26% -41% -22% -26%
309%
201%
150% 136% 135%
-120%
-70%
-20%
30%
80%
130%
180%
230%
280%
330%
Computer and Information Sciences
Educational Leadership and Administration
Medical Office Assistant Music Medical Insurance Coding Specialist
Year-over-Year Change in October Inquiries Five Fastest-Growing Programs
2014 YoY % Change 2015 YoY % Change
The 5 Fastest-Growing Programs in October
The programs on our list of fastest-growers continues to evolve.
§ New Arrivals: Computer and Information Sciences, Medical Office Assistant and Music § Three-peats: Educational Leadership and Administration § The year-over-year student demand for Computer and Information Sciences has more than tripled.
1. Includes only the top 75 programs (ranked on total inquiry volume since January 2012). Minimum of 1,000 inquiries in 2014.
617.366.2838 www.GrayAssociates.com 18
GRAY For more information please contact Gray Associates. Email: [email protected]
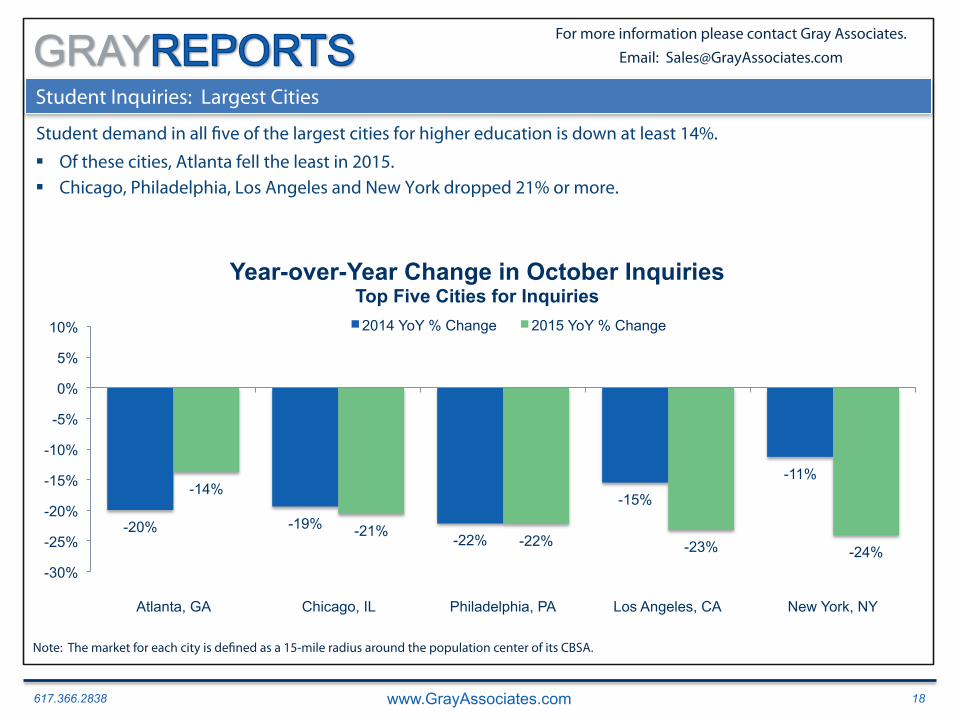
Student Inquiries: Largest Cities
Student demand in all five of the largest cities for higher education is down at least 14%. § Of these cities, Atlanta fell the least in 2015. § Chicago, Philadelphia, Los Angeles and New York dropped 21% or more.
-20% -19% -22%
-15%
-11% -14%
-21% -22% -23% -24%
-30%
-25%
-20%
-15%
-10%
-5%
0%
5%
10%
Atlanta, GA Chicago, IL Philadelphia, PA Los Angeles, CA New York, NY
Year-over-Year Change in October Inquiries Top Five Cities for Inquiries 2014 YoY % Change 2015 YoY % Change
Note: The market for each city is defined as a 15-mile radius around the population center of its CBSA.
617.366.2838 www.GrayAssociates.com 19
GRAY For more information please contact Gray Associates. Email: [email protected]
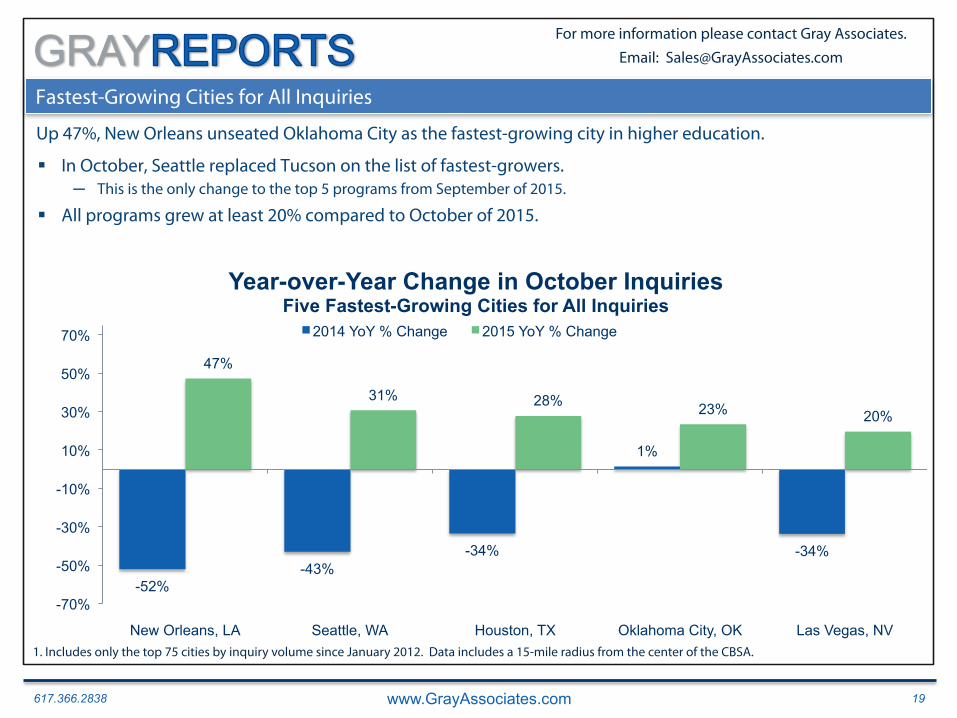
Fastest-Growing Cities for All Inquiries
Up 47%, New Orleans unseated Oklahoma City as the fastest-growing city in higher education.
§ In October, Seattle replaced Tucson on the list of fastest-growers. ─ This is the only change to the top 5 programs from September of 2015.
§ All programs grew at least 20% compared to October of 2015.
1. Includes only the top 75 cities by inquiry volume since January 2012. Data includes a 15-mile radius from the center of the CBSA.
-52% -43%
-34%
1%
-34%
47%
31% 28% 23% 20%
-70%
-50%
-30%
-10%
10%
30%
50%
70%
New Orleans, LA Seattle, WA Houston, TX Oklahoma City, OK Las Vegas, NV
Year-over-Year Change in October Inquiries Five Fastest-Growing Cities for All Inquiries
2014 YoY % Change 2015 YoY % Change

617.366.2838 www.GrayAssociates.com 20
GRAY For more information please contact Gray Associates. Email: [email protected]
79%
64%
17%
16%
14%
0%
-4%
-4%
-35% -10% 15% 40% 65%
Master's
Doctorate
Bachelor's
Online Programs
Branded Inquiries
External Inquiries
Certificates
On-campus Programs
Year-over-Year Percentage Change in Inquiries 2014 vs. 2015 (August – October)
Inquiry Volumes by Category – Trailing 3 Months
Over the last three months, interest in Master’s-degree programs grew the fastest.
§ On-ground programs declined 4%, while on-line programs increased 16%. § Interest in Bachelor’s degrees jumped 17%. § Inquiries for doctoral programs rose 65%.
Monthly Average

617.366.2838 www.GrayAssociates.com 21
GRAY For more information please contact Gray Associates. Email: [email protected]
536% 42% 42%
12% 6% 5% 4% 3% 1%
-1% -1%
-6% -16% -18%
-63%
-100% 0% 100% 200% 300% 400% 500%
Internal: Social Media Branded: Organic Branded: All Other Internal Branded: PPC Branded: Website Branded: Display Branded: Interactive Branded: PPC - Inbound Call External: PPL External: Affiliate - PPC External: Affiliate Branded: Offline Media Branded: Referral Branded: Email Branded: Inbound Phone
Year-over-Year Percentage Change in Inquiries by Channel All Programs and Award Levels
Inquiry Volumes by Channel in Trailing 3 Months
Inquiries via Social Media and Inbound Phone Call channels are headed in opposite directions–fast.

617.366.2838 www.GrayAssociates.com 22
GRAY For more information please contact Gray Associates. Email: [email protected]
Sustainers vs. Strugglers: Inquiry Volume
Strugglers seem to be recovering fast, after a long, tough stretch.
-12% -15% -15% -12%
0%
-3% -13% -16%
-31% -44% -46%
-27%
49% 45% 32%
11% 11% 6%
-2% -8% -3% -3% -7% -5%
-50%
-30%
-10%
10%
30%
50%
Jan Feb Mar Apr May Jun Jul Aug Sep Oct Nov Dec
Sustainers vs. Strugglers Year-over-Year Change in Inquiry Volumes 2014
-15% -11% -8%
-4%
-20% -12% -14%
-8%
7%
24%
-3% -5%
0% 1%
-2%
12% 14% 9%
-5% 0%
-20%
-10%
0%
10%
20%
30%
Jan Feb Mar Apr May Jun Jul Aug Sep Oct Nov Dec
Year-over-Year Change in Inquiry Volumes 2015
Strugglers
Sustainers

617.366.2838 www.GrayAssociates.com 23
GRAY For more information please contact Gray Associates. Email: [email protected]
Agenda
1. National Inquiry Trends
2. Inquiries and Conversions: On-Line vs. On-Ground Programs
3. Views by Program and Segment
4. Program Feasibility Study
5. Summary

Confidential www.GrayAssociates.com 24 Confidential
Program Profile: M.S. in Engineering and Technology
Management (ETM)
October 2015

Confidential www.GrayAssociates.com 25
Contents
1. Summary
2. Student Demand
3. Competition
4. Employment
5. Academic Program Descriptions
Confidential www.GrayAssociates.com 26
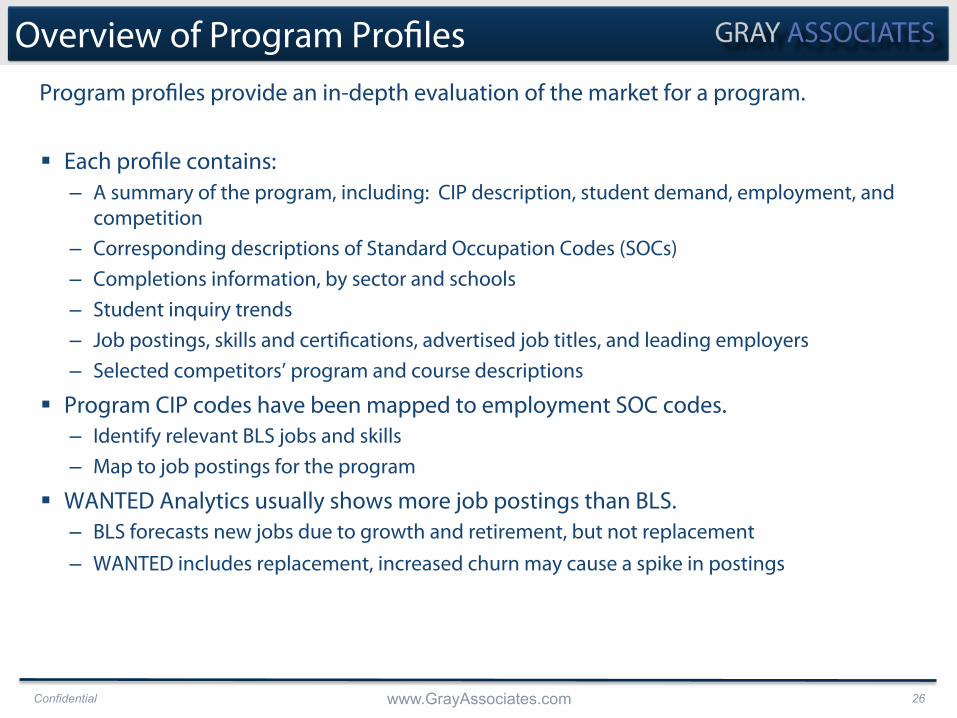
Overview of Program Profiles
§ Each profile contains: – A summary of the program, including: CIP description, student demand, employment, and
competition – Corresponding descriptions of Standard Occupation Codes (SOCs) – Completions information, by sector and schools – Student inquiry trends – Job postings, skills and certifications, advertised job titles, and leading employers – Selected competitors’ program and course descriptions
§ Program CIP codes have been mapped to employment SOC codes. – Identify relevant BLS jobs and skills – Map to job postings for the program
§ WANTED Analytics usually shows more job postings than BLS. – BLS forecasts new jobs due to growth and retirement, but not replacement – WANTED includes replacement, increased churn may cause a spike in postings
Program profiles provide an in-depth evaluation of the market for a program.

Confidential www.GrayAssociates.com 27
Sources
GrayData § Employment Overview and Outlook: http://www.bls.gov/ooh/a-z-index.htm
§ CIP Description: http://nces.ed.gov/ipeds/cipcode/Default.aspx?y=55
§ SOC Description: https://www.onetonline.org/
§ Student Inquiry Data
§ Completions: The Integrated Postsecondary Education Data System (IPEDS)
§ Job Postings, Skills, Certifications and Employers: WANTED Analytics
§ Academic Program Descriptions: Competitors’ websites
GrayData integrates a number of sources to create program profiles.

Confidential www.GrayAssociates.com 28
Gray relied primarily on the following information sources to develop this profile.
Program Data Sources
Item Information Source Comments
Proposed program
MS in ETM (IPEDS CIPs 15.1501, Master’s degrees)
Benchmark program
Master’s in Organizational Leadership (IPEDS CIP 52.0213, Master’s degrees)
Student demand (market inquiries)
GrayData sample of over 40 million higher-education inquiries, coded by CIP and intended degree
Relevant occupations for graduates
See next page
Student demand (completions) IPEDS-reported graduates in relevant fields
Employment, job growth, wages
Bureau of Labor Statistics (Employment Projections 2012-2022, 2014-15 Occupational Outlook Handbook)
Captured for selected relevant occupations
Job postings, credentials, hiring difficulty
WANTED Analytics Captured for selected relevant occupations
Competition IPEDS reported graduates by institution

Confidential www.GrayAssociates.com 29
Program CIP and Occupation SOC Codes
§ Depending on program focus, we could use different, or even combine CIP and SOC codes to define the program.
§ Gray works with you to define the program to analyze relevant CIP and SOCs. § For this profile we used the following CIP and SOC to define Engineering and
Technology Management.
As with related occupations (SOCs), there are many program codes (CIPs) related to Engineering and Technology Management, but none are focused on ETM.
CIP Code CIP Title Included?
15.1501 Engineering/Industrial Management. Yes
11.0103 Informa-on Technology. No
11.1005 Informa-on Technology Project Management. No
SOC Code SOC Title Included?
11-‐9041 Architectural and Engineering Managers Yes
11-‐3051 Industrial Produc-on Managers No
17-‐3026 Industrial Engineering Technicians No
11-‐3021 Computer and Informa-on Systems Managers No
15-‐1122 Informa-on Security Analysts No

Confidential www.GrayAssociates.com 30
Summary Completions for M.S. in ETM are steadily increasing but employment growth is slow. § ETM is similar to the benchmark program, Master’s in Organizational Leadership. § Also, similar to the current program structure, ETM may fit well as a concentration in an MBA
program.
Proposed Benchmark Program
MS in ETM MSOL Comments
Student Demand
2015 YTD Master’s student Inquiries/month1 88 556 Very few inquiries for Master’s programs with the words
“Engineering, Technology and Management”
Inquiry Trends (2015 YoY Change) -25% +617%
Job Opportunities2
BLS Job Growth (10-year CAGR) 0.7% 1.2% BLS Annual Job Openings 6,060 30,775 JOG (job openings per graduate) 1.5 14.8 Job Postings (last 12 Months) 185,133 215,188 Hiring Difficulty (100 = most difficult) 27 48
Competition 2014 Completions 4,136 2,907 Price Per Inquiry $77.33 $50.92 Number of Competitors Total/Online 86/35 88/49
Degrees and Wages
BLS % Of Employed: Assoc and below 17% 43% BLS % Of Employed: Bachelor’s 26% 36% BLS % Of Employed: Master’s 35% 17% BLS % Of Employed: Doctoral 22% 4% Wages (WANTED: Median Salary) $124,900 $85,000
1. Competitors for ETM are primarily well-known public and private universities, who do not advertise, which depresses inquiry volume in our sample.
2. MSOL employment data (BLS and WANTED) calculations use a combination of 16 different SOCs, which together apply to a much broader range of degrees than just MSOL. MS in ETM employment calculations use 1 SOC.

Confidential www.GrayAssociates.com 31
Below is a description of the instructional program (CIP) and its associated jobs (SOC).
Program and Occupation Description
Classification of Instructional Program (CIP) Engineering/Industrial Management. (15.1501)*
Definition: A program that focuses on the application of engineering principles to the planning and operational management of industrial and manufacturing operations, and prepares individuals to plan and manage such operations. Includes instruction in accounting, engineering economy, financial management, industrial and human resources management, industrial psychology, management information systems, mathematical modeling and optimization, quality control, operations research, safety and health issues, and environmental program management. § Below bachelor's degree: 1% § Bachelor’s degree: 18% § Post-baccalaureate certificate: 6% § Master’s degree: 74% § Above master’s degree: 1%
Standard Occupational Codes (SOCs) Architectural and Engineering Managers (11-9041.00)**
Definition: Plan, direct, or coordinate activities in such fields as architecture and engineering or research and development in these fields. Sample of reported job titles: Chief Engineer, Civil Engineering Manager, Director of Engineering, Engineering Group Manager, Engineering Manager, Engineering Program Manager, Principal Engineer, Project Engineer, Project Engineering Manager, Project Manager Tasks: § Manage the coordination and overall integration of technical activities in architecture or engineering projects. See more occupations
related to this task. § Direct, review, or approve project design changes. See more occupations related to this task. § Confer with management, production, or marketing staff to discuss project specifications or procedures. See more occupations related to
this task. § Present and explain proposals, reports, or findings to clients. See more occupations related to this task. § Consult or negotiate with clients to prepare project specifications. Employer Requirement: Most of these occupations require graduate school. For example, they may require a master's degree, and some require a Ph.D., M.D., or J.D. (law degree).
*IPEDS 2010 CIP Classification, **ONET

Confidential www.GrayAssociates.com 32
Student Demand: GrayData Inquiry Trends
§ For the most recent 12 months, there has been a small, erratic flow of inquiries. - There are less than 26 inquiries per month, which may reflect limited use of paid inquiries by
public colleges, or a small sample. - Inquiries are down about 7% year-over-year. - Inquiries fluctuate from 5-10 to over 20 on a monthly basis.
Inquiries have been relatively flat with a spike in April and May of 2014.
Source: GrayReports inquiries for Technology and Engineering Management (MBA).
0
5
10
15
20
25
30
Jan Feb Mar Apr May Jun Jul Aug Sep Oct Nov Dec
2013
2014
2015

Confidential www.GrayAssociates.com 33
California and Texas had the most inquiries for ETM.
Student Demand: GrayData Inquiry Map
Source: GrayReports inquiries for Technology and Engineering Management (MBA).

Confidential www.GrayAssociates.com 34
74% of ETM graduates receive a Master’s degree – 18% receive a Bachelor’s.
Student Demand: 2014 Completions by Award Level
2 22
737 253
3,067
3 52 -
500 1,000 1,500 2,000 2,500 3,000 3,500
Completions by Award Level
Source: IPEDs Completions for CIP 15.1501

Confidential www.GrayAssociates.com 35
ETM completions are split between Private not-for-profit and Public.
Student Demand: 2014 Completions by Sector
1
1,520 1,546
-
200
400
600
800
1,000
1,200
1,400
1,600
1,800
Private for-profit Private not-for-profit Public
Completions by Sector
Source: IPEDs Completions for CIP 15.1501

Confidential www.GrayAssociates.com 36
Employment: Occupation Overview
Overview § Architectural and engineering managers plan, coordinate, and direct activities in architectural and engineering companies. Job Outlook § Employment of architectural and engineering managers is projected to grow 7 percent from 2012 to 2022, slower than the average for all occupations.
Employment growth will largely reflect the growth of the industries in which these managers are employed. § For example, the engineering services industry is projected to grow 21 percent from 2012 to 2022, adding the most new architectural and engineering manager
jobs. Engineering services is composed of consulting firms that provide services to many different industries. Civil engineering services related to the construction of large buildings, roads, and other infrastructure projects are the most common services provided by this industry. Demand for these services is expected to be high as the nation’s aging infrastructure needs repair and expansion. Mechanical and electrical engineering services are also commonly provided by this industry and will continue to be used on many different projects.
§ However, employment in manufacturing—the largest industry employing architectural and engineering managers—is projected to decline by 6 percent from 2012 to 2022, impeding overall growth of the occupation.
Education § The vast majority of architectural and engineering managers have at least a bachelor’s degree in an engineering specialty or a professional degree in
architecture. § Many also gain business management skills by completing a master’s degree in engineering management (MEM or MsEM) or technology
management (MSTM) or a master’s in business administration (MBA), either before or after advancing to management positions. Employers will sometimes pay for such education. Typically, those who prefer to manage in technical areas pursue an MsEM or MSTM and those interested in more general management skills earn an MBA.
§ Engineering management programs usually include classes in accounting, engineering economics, financial management, industrial and human resources management, and quality control.
§ Technology management programs typically provide instruction in production and operations management, project management, computer applications, quality control, safety and health issues, statistics, and general management principles
Quick Facts
2012 Median Pay $124,870 per year $60.03 per hour
Entry-Level Education Bachelor’s degree
Work Experience in a Related Occupation 5 years or more
Number of Jobs, 2012 193,800
Job Outlook, 2012-22 7% (Slower than average)
Employment Change, 2012-22 13,100

Confidential www.GrayAssociates.com 37
Employment: BLS Projections and Educational Attainment
§ BLS estimates that 31% of 193,800 working in the field have a Master’s degree.
BLS forecasts 60,600 job openings through 2022. BLS does not forecast changes in educational attainment within an occupation.
60,659 64,760
-
50,000
100,000
150,000
200,000
250,000
2012 2022
BLS Employment Outlook for ETM
Associate's and Below
Bachelor's
Master's
Doctoral or professional degree
Source: BLS, Employment Outlook 2012-2022 for SOC 11-9041
CAGR: 0.7%

Confidential www.GrayAssociates.com 38
There are currently 7,856 job postings for ETM jobs nationally. This occupation is relatively easy to fill with a hiring scale score of 27.
Employment: WANTED Analytics Summary
Job Titles
Hiring Scale
Wage
Average hiring scale for jobs requiring a Master’s degree is 45.
Average for all master’s degree occupations: $85,200

Confidential www.GrayAssociates.com 39
216,024 199,073 197,004
209,763
41,777 39,846 41,500 42,465
0
50,000
100,000
150,000
200,000
250,000
Jan - Sep 2012 Jan - Sep 2013 Jan - Sep 2014 Jan - Sep 2015
Job Postings for Engineering and Technology Management
Available Jobs New Jobs
Employment: Job Posting Trends
§ New job postings have increased 2.3% so far in 2015. § Available jobs grew 6%, suggesting new job postings are not being filled.
New and available job postings for ETM have just started to increase.
Source: Gray Associates analysis of WANTED Analytics job postings for SOC 11-9041.
+2.3%
+6%
+4.5%
-1%
-4.6%
-7.9%

Confidential www.GrayAssociates.com 40
Employment: Most Requested Hard Skills
Quality Assurance is the most requested skill listed in job postings for ETM.
449 454 461 464 470 486 490 528 533 537 538 583 606 631 668 690 707
757 996
1,060 1,100
1,729 1,978
2,034 2,418
4,009
0 500 1,000 1,500 2,000 2,500 3,000 3,500 4,000 4,500
Water treatment Software as a Service
Project management software Capital equipment
Good Manufacturing Practice Mechanical design Electrical systems
Lean Manufacturing Cyber security
User Experience design Microsoft Office Visio
Scrum agile methodology Risk assessment SolidWorks CAD
Preventative maintenance inspections Java
Quality Systems Technical writing
Energy management Instrumentation
Systems Integration Project engineering
Technical support AutoCAD
Quality control Quality Assurance
Most Requested Hard Skills in Job Postings (10.2014 – 9.2015)
Source: Gray’s analysis of WANTED Analytics job postings 10.2014 to 09.2015 for jobs requiring Bachelor’s and above.

Confidential www.GrayAssociates.com 41
Employment: Most Requested Certifications
Professional Engineer is the most requested certification.
128 134 144 176 184 188 209 211 222 226 237 279 281 293 305 352
457 473 509
762 1,069
1,408 1,523
4,076 5,673
0 1,000 2,000 3,000 4,000 5,000 6,000
Leadership in Energy and Environmental Design Accredited Certified Project Manager
ISO TS16949 Computer Aided Design & Drafting
Certified Energy Manager Certified IRB Professional
Six Sigma certification Food safety programs
General contractor Engineer-In-Training
HAZMAT Enterprise Project Management
FAR Part 23 certification Six Sigma Black Belt Design for Six Sigma
American Society of Mechanical Engineers EPA certification
Certified Purchasing Manager Six Sigma Green Belt
Accreditation Board for Engineering and Technology Occupational Safety & Health Administration Certification
Top Secret Sensitive Compartmented Information Project Management Institute
Project Management Professional Professional Engineer
Most Requested Certifications in Job Postings (10.2014 – 9.2014)
Source: Gray’s analysis of WANTED Analytics job postings 10.2014 to 09.2015 for jobs requiring Bachelor’s and above.

Confidential www.GrayAssociates.com 42
Employment: Employers by Number of Job Postings
HDR, GE and Apple are the top three employers in terms of job postings.
165 171 177
200 202
213 221 222 223 228
237 246
253 264
274 280 284
293 294
323 357
475 589
617
0 100 200 300 400 500 600 700
Flextronics The Boeing Company
United Technologies Amazon
ARCADIS Michael Baker Corporation
HNTB Corporation Duke Energy Corporation
Siemens Honeywell CH2M Hill
Black & Veatch Corporation Raytheon Corporation
Lockheed Martin URS Corporation
STI AECOM
Northrop Grumman ACCENTURE
PARSONS CORPORATION Oracle
Apple Inc. General Electric
HDR, Inc.
Employers by Most Job Postings (10.2014 – 9.2015)
Source: Gray’s analysis of WANTED Analytics job postings 10.2014 to 09.2015 for jobs requiring Bachelor’s and above.
Confidential www.GrayAssociates.com 43
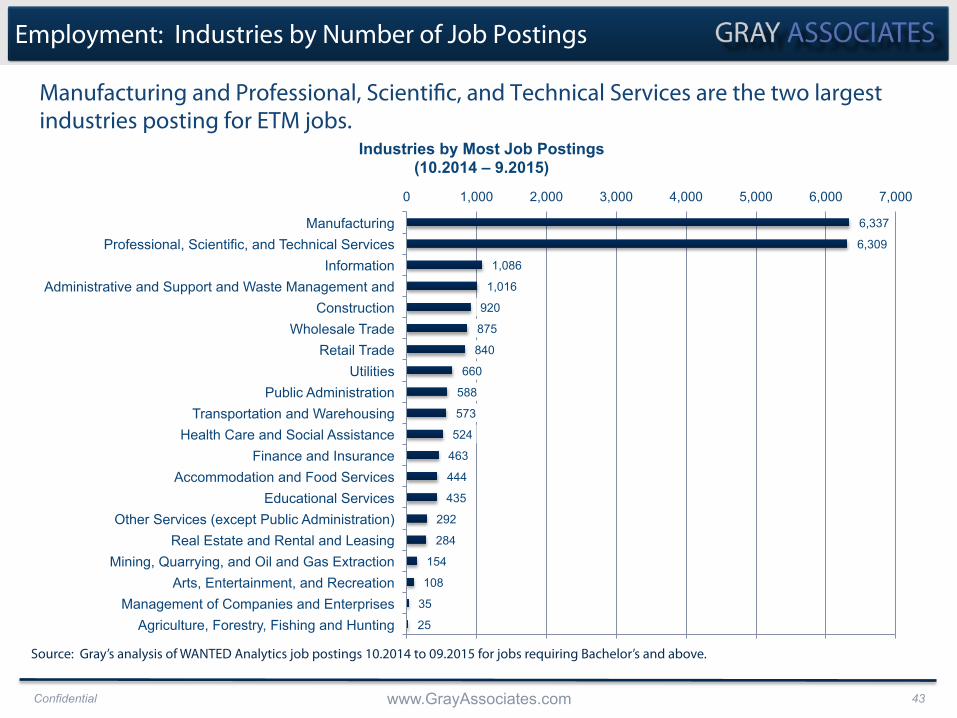
Employment: Industries by Number of Job Postings
Manufacturing and Professional, Scientific, and Technical Services are the two largest industries posting for ETM jobs.
25
35
108
154
284
292
435
444
463
524
573
588
660
840
875
920
1,016
1,086
6,309
6,337
0 1,000 2,000 3,000 4,000 5,000 6,000 7,000
Agriculture, Forestry, Fishing and Hunting Management of Companies and Enterprises
Arts, Entertainment, and Recreation Mining, Quarrying, and Oil and Gas Extraction
Real Estate and Rental and Leasing Other Services (except Public Administration)
Educational Services Accommodation and Food Services
Finance and Insurance Health Care and Social Assistance
Transportation and Warehousing Public Administration
Utilities Retail Trade
Wholesale Trade Construction
Administrative and Support and Waste Management and Information
Professional, Scientific, and Technical Services Manufacturing
Industries by Most Job Postings (10.2014 – 9.2015)
Source: Gray’s analysis of WANTED Analytics job postings 10.2014 to 09.2015 for jobs requiring Bachelor’s and above.

Confidential www.GrayAssociates.com 44
Completions increased 2.2% from 2013 to 2014.
Competition: 2014 Completions by Institution
0 200 400 600 800
1,000 1,200 1,400 1,600
ETM Completions by Competitor
California State University
University of Illinois Board of Trustees Purdue University
Universidad Politecnica
University of Missouri
New Jersey Institute of Technology
Duke University
Stanford University
George Washington University
University of Arkansas System
Source: IPEDS for CIP 15.1501 for award levels 7 (Master’s Degree).
Company 2010 2011 2012 2013 2014 University of Arkansas System 210 258 254 233 215 George Washington University 168 128 135 142 186 Stanford University 157 173 201 165 160 Duke University 0 0 0 151 149 New Jersey Institute of Technology 109 123 114 80 145 University of Missouri 101 105 135 153 131 Universidad Politecnica 68 100 68 72 119 Purdue University 18 29 149 158 110 University of Illinois Board of Trustees 44 47 82 84 100 California State University 129 145 108 112 87 Other 1,620 1,556 1,685 1,651 1,665 Total 2,624 2,664 2,931 3,001 3,067
Confidential www.GrayAssociates.com 45
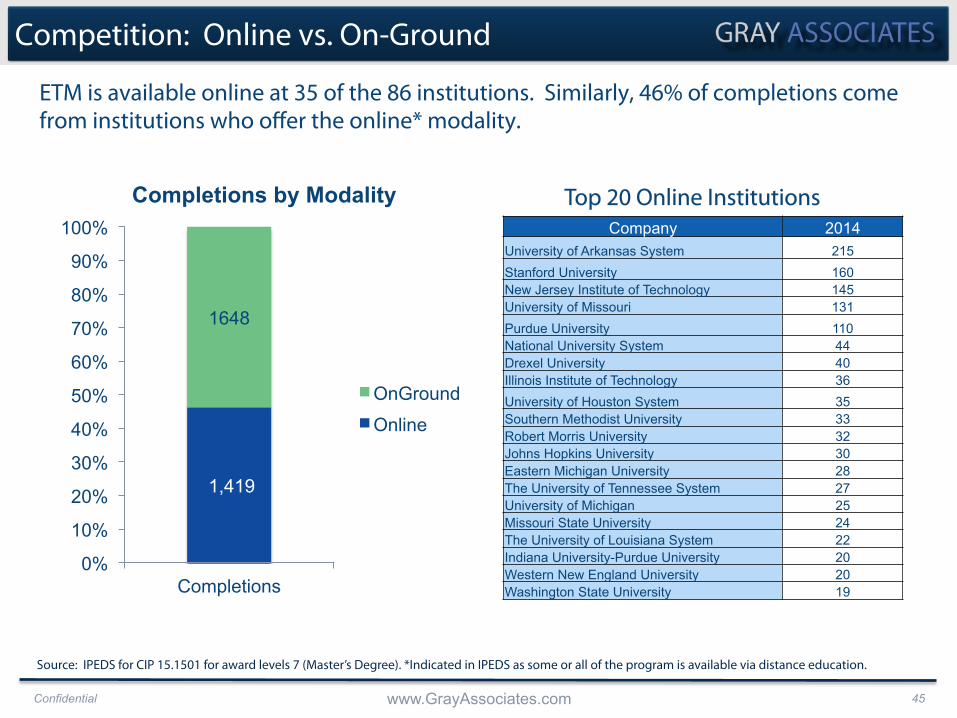
ETM is available online at 35 of the 86 institutions. Similarly, 46% of completions come from institutions who offer the online* modality.
Competition: Online vs. On-Ground
1,419
1648
0%
10%
20%
30%
40%
50%
60%
70%
80%
90%
100%
Completions
Completions by Modality
OnGround
Online
Source: IPEDS for CIP 15.1501 for award levels 7 (Master’s Degree). *Indicated in IPEDS as some or all of the program is available via distance education.
Company 2014 University of Arkansas System 215 Stanford University 160 New Jersey Institute of Technology 145 University of Missouri 131 Purdue University 110 National University System 44 Drexel University 40 Illinois Institute of Technology 36 University of Houston System 35 Southern Methodist University 33 Robert Morris University 32 Johns Hopkins University 30 Eastern Michigan University 28 The University of Tennessee System 27 University of Michigan 25 Missouri State University 24 The University of Louisiana System 22 Indiana University-Purdue University 20 Western New England University 20 Washington State University 19
Top 20 Online Institutions

Confidential www.GrayAssociates.com 46
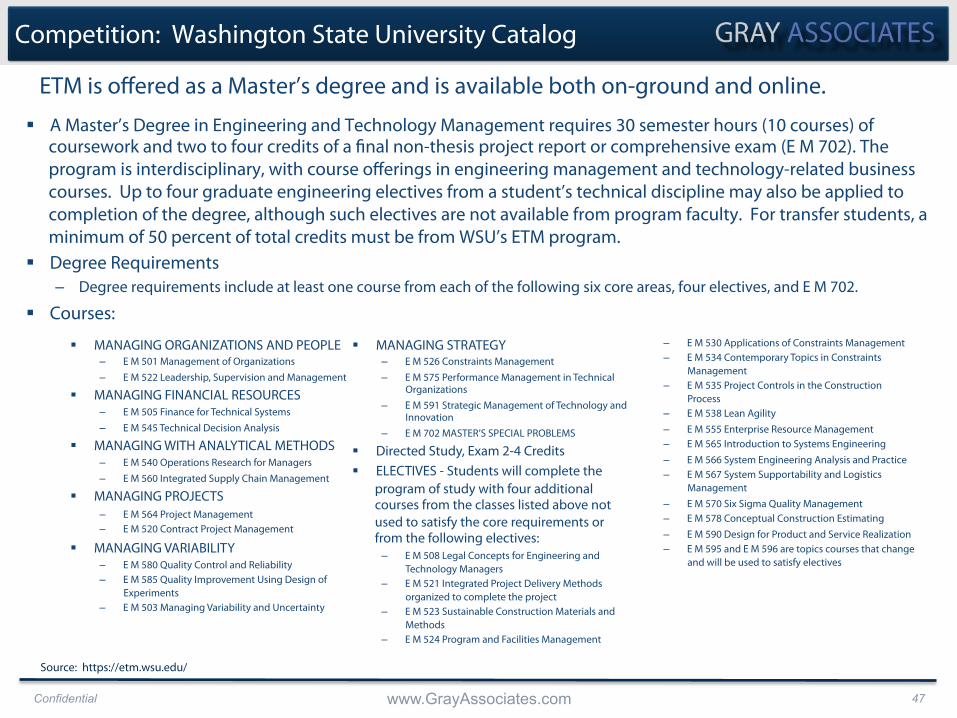
Competition: Washington State University
ETM is offered as a Master’s degree and is available both on-ground and online.
Source: https://etm.wsu.edu/
School Possible CIPs CIP Title 2014 Completions
Engineering 15.1501 Engineering/Industrial Management. 36
Confidential www.GrayAssociates.com 47
Competition: Washington State University Catalog
§ A Master’s Degree in Engineering and Technology Management requires 30 semester hours (10 courses) of coursework and two to four credits of a final non-thesis project report or comprehensive exam (E M 702). The program is interdisciplinary, with course offerings in engineering management and technology-related business courses. Up to four graduate engineering electives from a student’s technical discipline may also be applied to completion of the degree, although such electives are not available from program faculty. For transfer students, a minimum of 50 percent of total credits must be from WSU’s ETM program.
§ Degree Requirements – Degree requirements include at least one course from each of the following six core areas, four electives, and E M 702.
§ Courses:
ETM is offered as a Master’s degree and is available both on-ground and online.
Source: https://etm.wsu.edu/
§ MANAGING ORGANIZATIONS AND PEOPLE – E M 501 Management of Organizations – E M 522 Leadership, Supervision and Management
§ MANAGING FINANCIAL RESOURCES – E M 505 Finance for Technical Systems – E M 545 Technical Decision Analysis
§ MANAGING WITH ANALYTICAL METHODS – E M 540 Operations Research for Managers – E M 560 Integrated Supply Chain Management
§ MANAGING PROJECTS – E M 564 Project Management – E M 520 Contract Project Management
§ MANAGING VARIABILITY – E M 580 Quality Control and Reliability – E M 585 Quality Improvement Using Design of
Experiments – E M 503 Managing Variability and Uncertainty
§ MANAGING STRATEGY – E M 526 Constraints Management – E M 575 Performance Management in Technical
Organizations – E M 591 Strategic Management of Technology and
Innovation – E M 702 MASTER’S SPECIAL PROBLEMS
§ Directed Study, Exam 2-4 Credits § ELECTIVES - Students will complete the
program of study with four additional courses from the classes listed above not used to satisfy the core requirements or from the following electives:
– E M 508 Legal Concepts for Engineering and Technology Managers
– E M 521 Integrated Project Delivery Methods organized to complete the project
– E M 523 Sustainable Construction Materials and Methods
– E M 524 Program and Facilities Management
– E M 530 Applications of Constraints Management – E M 534 Contemporary Topics in Constraints
Management – E M 535 Project Controls in the Construction
Process – E M 538 Lean Agility – E M 555 Enterprise Resource Management – E M 565 Introduction to Systems Engineering – E M 566 System Engineering Analysis and Practice – E M 567 System Supportability and Logistics
Management – E M 570 Six Sigma Quality Management – E M 578 Conceptual Construction Estimating – E M 590 Design for Product and Service Realization – E M 595 and E M 596 are topics courses that change
and will be used to satisfy electives

Confidential www.GrayAssociates.com 48
Competition: Duke University
Duke is a leader in Master’s-level engineering management.
Source: http://memp.pratt.duke.edu/
School Possible CIPs CIP Title 2014 Completions
Engineering 15.1501 Engineering/Industrial Management. 149

Confidential www.GrayAssociates.com 49
Competition: Stanford University
ETM is one of six specialties in the Master’s of Management Science and Engineering.
Source: https://msande.stanford.edu/academics/graduate-programs/masters-program
School Possible CIPs CIP Title 2014 Completions
Engineering 15.1501 Engineering/Industrial
Management. 160

Confidential www.GrayAssociates.com 50
Competition: Northwestern University
ETM is offered both full-time and as a part-time program.
Source: https://msande.stanford.edu/academics/graduate-programs/masters-program
School Possible CIPs CIP Title 2014 Completions
Engineering 15.1501 Engineering/Industrial Management. 86

Confidential www.GrayAssociates.com 51
Competition: Colorado School of Mines
ETM is offered as a Master’s degree and positioned as an alternative to an MBA.
Source: http://www.mines.edu/ETM_GS
School Possible CIPs CIP Title 2014 Completions
Engineering 15.1501 Engineering/Industrial Management. 19

617.366.2838 www.GrayAssociates.com 52
GRAY For more information please contact Gray Associates. Email: [email protected]
Agenda
1. National Inquiry Trends
2. Inquiries and Conversions: On-Line vs. On-Ground Programs
3. Views by Program and Segment
4. Program Feasibility Study
5. Summary

617.366.2838 www.GrayAssociates.com 53
GRAY For more information please contact Gray Associates. Email: [email protected]
Key Demand Trends and Observations
For the first time in a long time, student demand trends were significantly positive.
§ Broad-based increases in inquiries in October. ─ Up 14% overall year-over-year ─ First back-to-back increases in a very long time (September was up 3%) ─ Internal/branded inquiries up 29% ─ Inquiries for on-line programs up 46% ─ Inquiries for on-ground programs down less than 3% ─ Inquiries for Master’s-degree and Doctoral programs up 79% and 64%, respectively
§ Conversion rates are now ahead of norms for most recent three months. ─ Conversions of inquiries for on-line programs already above last year for August
and September

617.366.2838 www.GrayAssociates.com 54
GRAY For more information please contact Gray Associates. Email: [email protected]
Upcoming Gray Associates’ Webinars
Please join us next month!
December Webinar (November Results)
Thursday, December 17th at 2:00 PM EDT

617.366.2838 www.GrayAssociates.com 55
GRAY For more information please contact Gray Associates. Email: [email protected]
Gray’s Webinar with Keypath Education
Tuesday, December 8th at 1:00 PM EST
Webinar
Selecting Your Program Portfolio: A 360˚ View

617.366.2838 www.GrayAssociates.com 56
GRAY For more information please contact Gray Associates. Email: [email protected]
Questions and Contacts
Please feel free to contact: Bob Atkins
CEO Gray Associates, Inc.
617-366-2836