2014 june grayreports - student demand trends
TRANSCRIPT
GRAYREPORTS Demand for Educational Programs
www.GrayAssociates.com
Results through June 2014
617.401.7662 www.GrayAssociates.com 2
GRAY For more information please contact Bob Atkins. Email: [email protected]
Agenda
1. Introduction
2. Demand: National Overview
3. Demand for On-Line Programs
4. Demand for On-Ground Programs
5. Demand by Program and City
6. Acquisition Analysis: Corinthian Example
7. Summary
617.401.7662 www.GrayAssociates.com 3
GRAY For more information please contact Bob Atkins. Email: [email protected]
Key Demand Trends and Observations
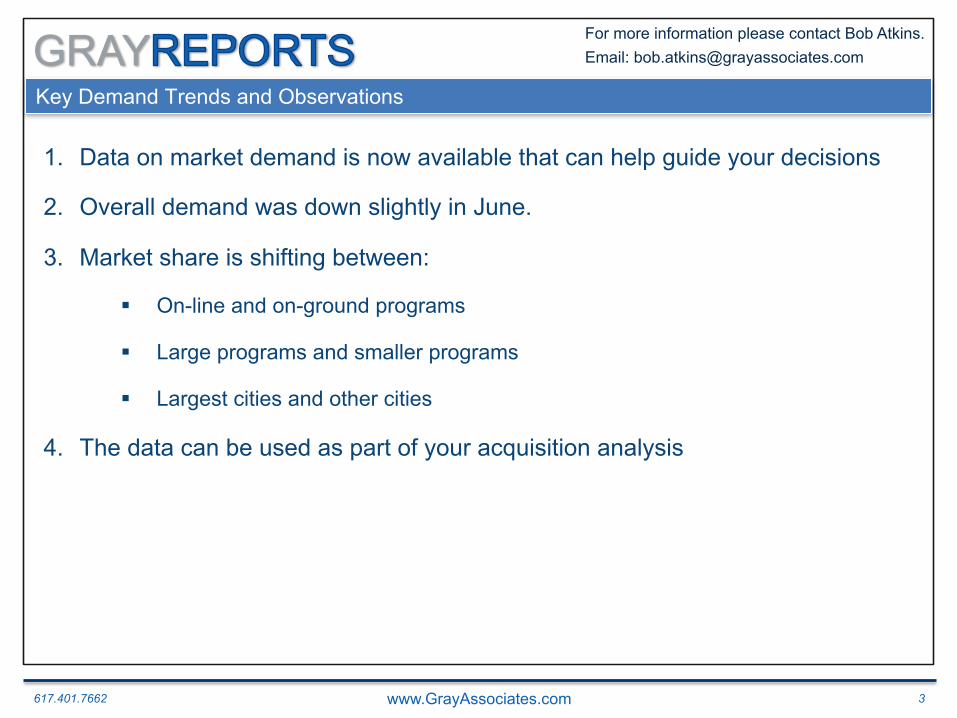
1. Data on market demand is now available that can help guide your decisions
2. Overall demand was down slightly in June.
3. Market share is shifting between:
§ On-line and on-ground programs
§ Large programs and smaller programs
§ Largest cities and other cities
4. The data can be used as part of your acquisition analysis
617.401.7662 www.GrayAssociates.com 4
GRAY For more information please contact Bob Atkins. Email: [email protected]
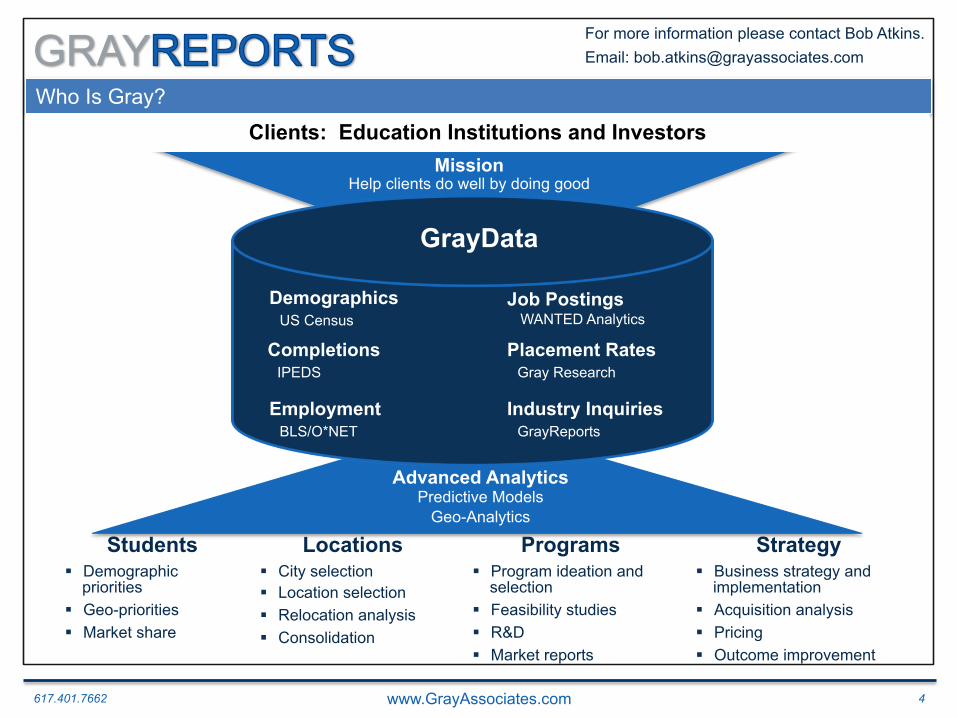
Who Is Gray?
GrayData
Completions IPEDS
Employment BLS/O*NET
Placement Rates Gray Research
Industry Inquiries GrayReports
Demographics US Census
Job Postings WANTED Analytics
Students Programs Strategy Locations § Demographic
priorities § Geo-priorities § Market share
§ City selection § Location selection § Relocation analysis § Consolidation
§ Program ideation and selection
§ Feasibility studies § R&D § Market reports
§ Business strategy and implementation
§ Acquisition analysis § Pricing § Outcome improvement
Advanced Analytics Predictive Models
Geo-Analytics
Clients: Education Institutions and Investors Mission
Help clients do well by doing good
617.401.7662 www.GrayAssociates.com 5
GRAY For more information please contact Bob Atkins. Email: [email protected]
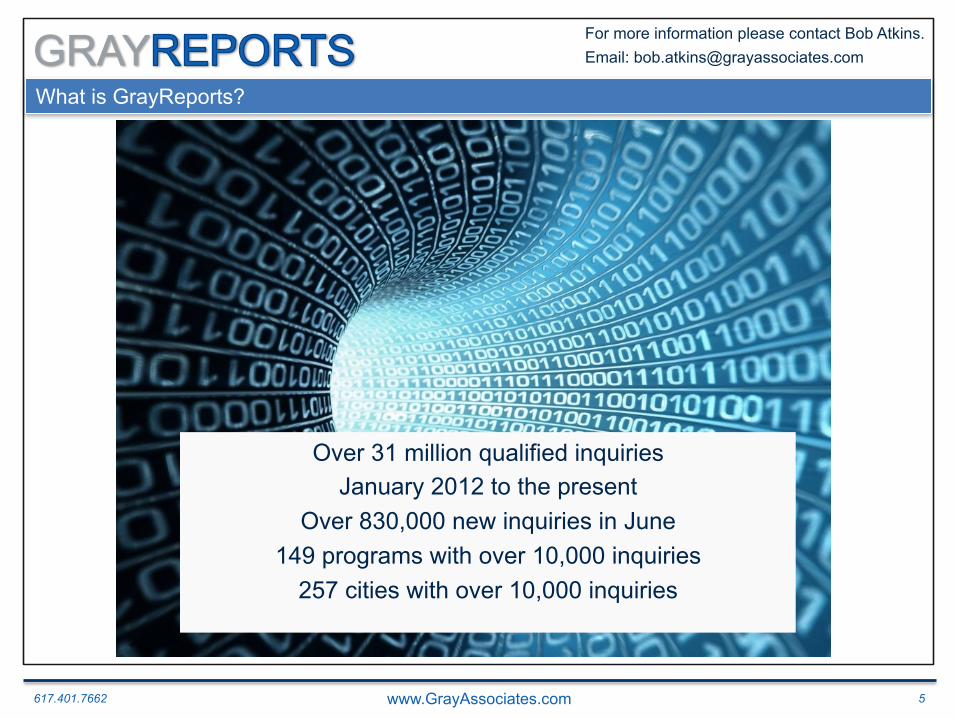
What is GrayReports?
Over 31 million qualified inquiries January 2012 to the present
Over 830,000 new inquiries in June 149 programs with over 10,000 inquiries
257 cities with over 10,000 inquiries
617.401.7662 www.GrayAssociates.com 6
GRAY For more information please contact Bob Atkins. Email: [email protected]
Agenda
1. Introduction
2. Demand: National Overview
3. Demand for On-Line Programs
4. Demand for On-Ground Programs
5. Demand by Program and City
6. Acquisition Analysis: Corinthian Example
7. Summary
617.401.7662 www.GrayAssociates.com 7
GRAY For more information please contact Bob Atkins. Email: [email protected]
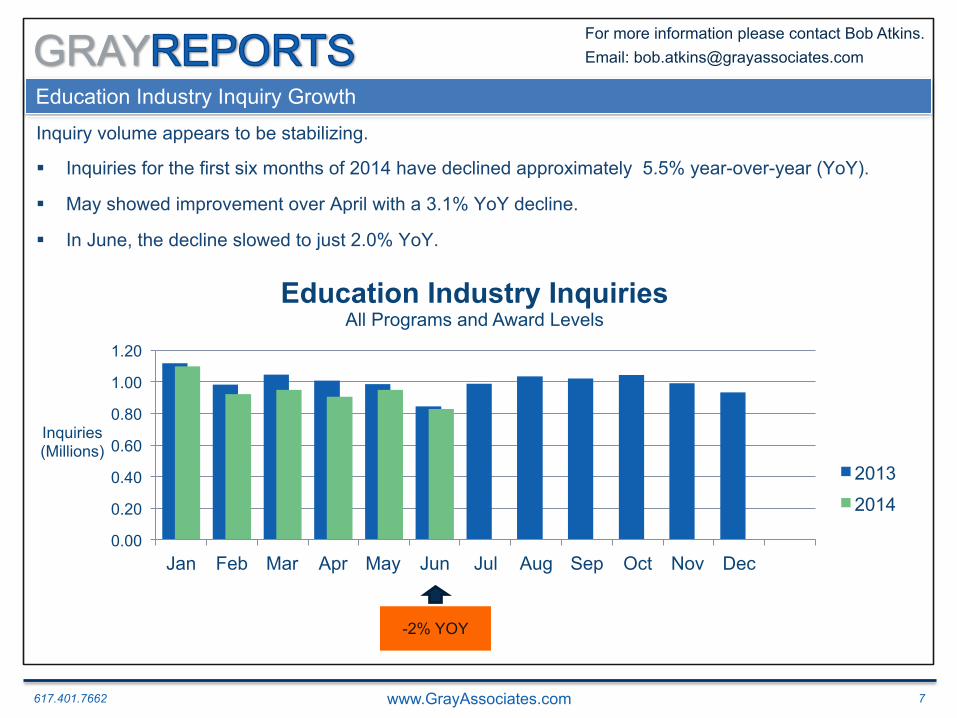
Education Industry Inquiry Growth
Inquiry volume appears to be stabilizing.
§ Inquiries for the first six months of 2014 have declined approximately 5.5% year-over-year (YoY).
§ May showed improvement over April with a 3.1% YoY decline.
§ In June, the decline slowed to just 2.0% YoY.
2012
0.00
0.20
0.40
0.60
0.80
1.00
1.20
Jan Feb Mar Apr May Jun Jul Aug Sep Oct Nov Dec
Inquiries (Millions)
Education Industry Inquiries All Programs and Award Levels
2013
2014
-2% YOY
617.401.7662 www.GrayAssociates.com 8
GRAY For more information please contact Bob Atkins. Email: [email protected]
2.9%
2.6%
3.0%
2.8%
2.9%
3.5%
3.3%
3.1%
2.8%
2.9%
2.9%
2.9%
3.2%
2.9%
3.4%
3.2%
2.8%
2.2%
0.00%
0.50%
1.00%
1.50%
2.00%
2.50%
3.00%
3.50%
4.00%
Jan Feb Mar Apr May Jun Jul Aug Sep Oct Nov Dec
App
licat
ion
Rat
e
Education Industry Application Rates 2013 2014
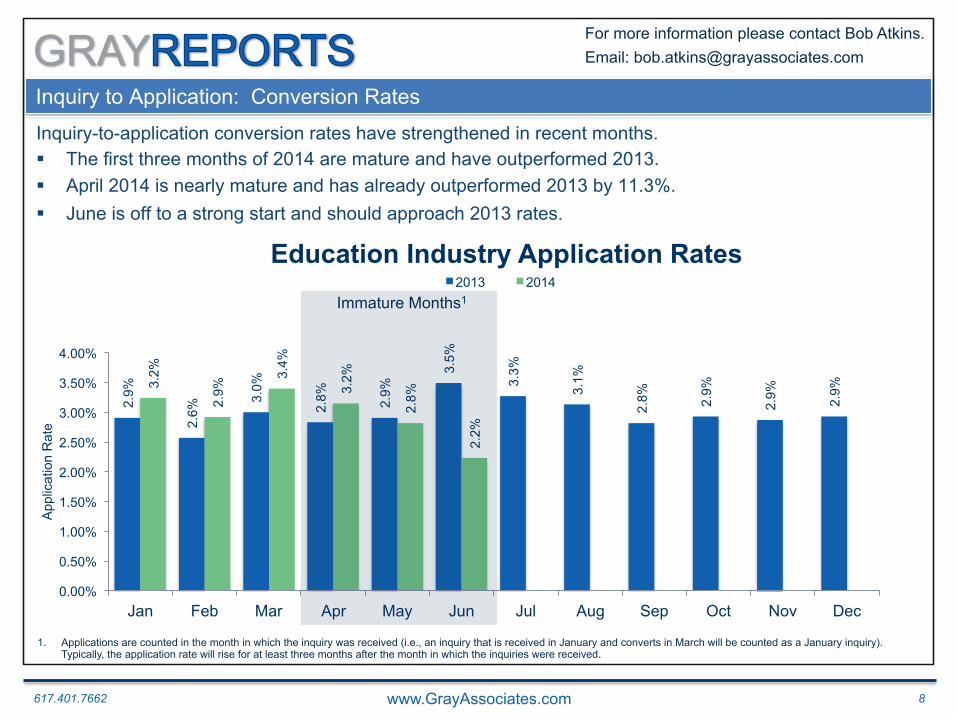
Inquiry to Application: Conversion Rates
Immature Months1
Inquiry-to-application conversion rates have strengthened in recent months. § The first three months of 2014 are mature and have outperformed 2013. § April 2014 is nearly mature and has already outperformed 2013 by 11.3%. § June is off to a strong start and should approach 2013 rates.
1. Applications are counted in the month in which the inquiry was received (i.e., an inquiry that is received in January and converts in March will be counted as a January inquiry). Typically, the application rate will rise for at least three months after the month in which the inquiries were received.
617.401.7662 www.GrayAssociates.com 9
GRAY For more information please contact Bob Atkins. Email: [email protected]
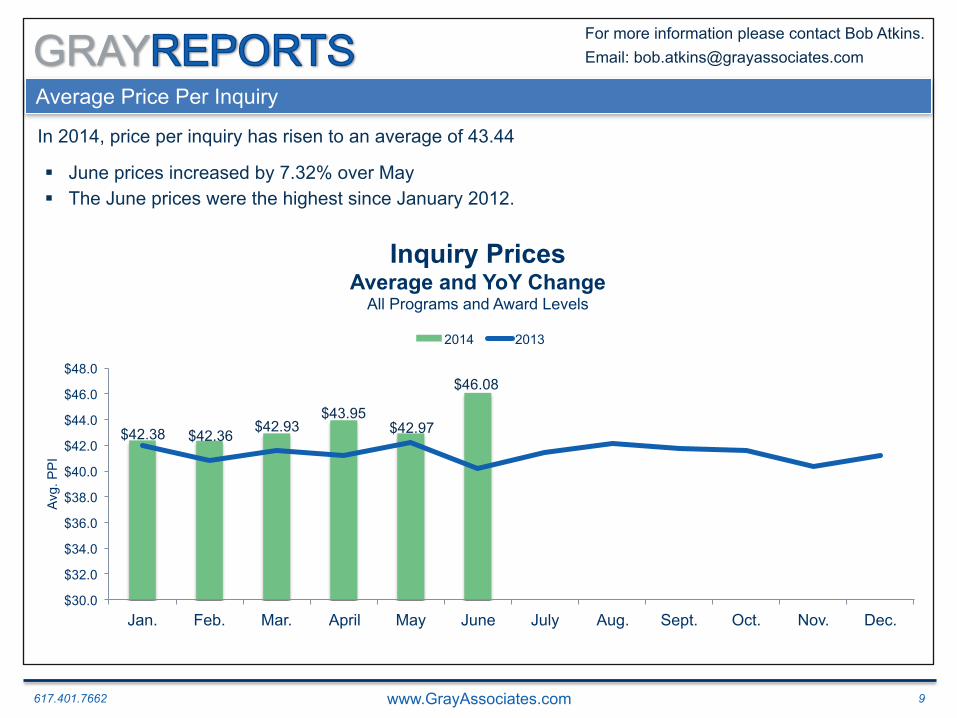
§ June prices increased by 7.32% over May § The June prices were the highest since January 2012.
Average Price Per Inquiry
In 2014, price per inquiry has risen to an average of 43.44
$30.0
$32.0
$34.0
$36.0
$38.0
$40.0
$42.0
$44.0
$46.0
$48.0
Jan. Feb. Mar. April May June July Aug. Sept. Oct. Nov. Dec.
Avg.
PP
I
Inquiry Prices Average and YoY Change
All Programs and Award Levels
2014 2013
$42.38 $42.36 $42.93 $43.95
$42.97
$46.08
617.401.7662 www.GrayAssociates.com 10
GRAY For more information please contact Bob Atkins. Email: [email protected]
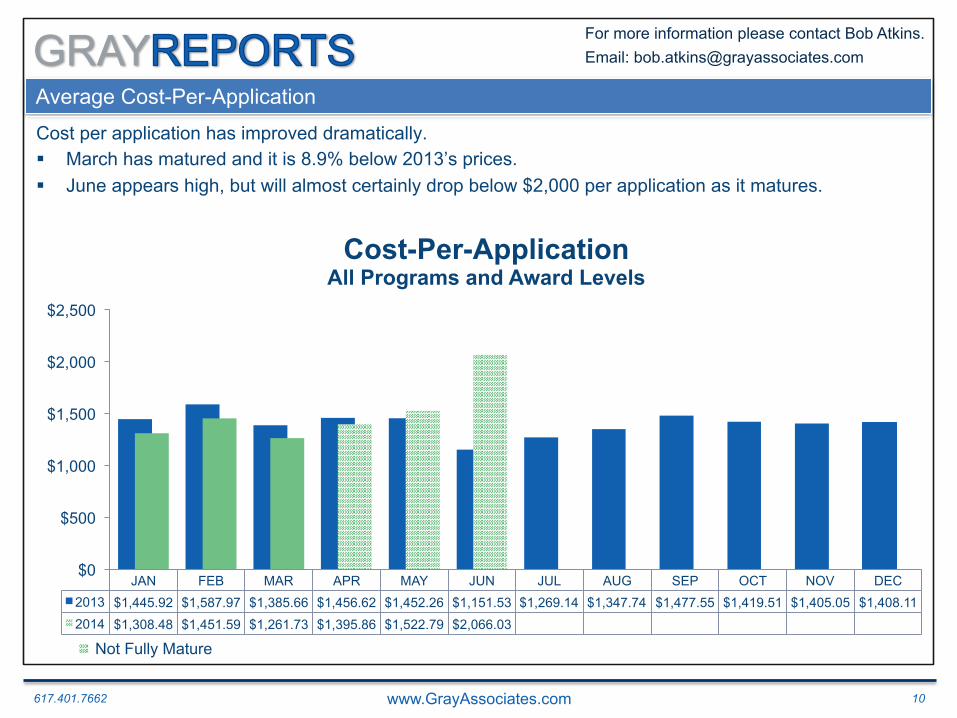
Average Cost-Per-Application
Cost per application has improved dramatically. § March has matured and it is 8.9% below 2013’s prices. § June appears high, but will almost certainly drop below $2,000 per application as it matures.
JAN FEB MAR APR MAY JUN JUL AUG SEP OCT NOV DEC 2013 $1,445.92 $1,587.97 $1,385.66 $1,456.62 $1,452.26 $1,151.53 $1,269.14 $1,347.74 $1,477.55 $1,419.51 $1,405.05 $1,408.11 2014 $1,308.48 $1,451.59 $1,261.73 $1,395.86 $1,522.79 $2,066.03
$0
$500
$1,000
$1,500
$2,000
$2,500
Cost-Per-Application All Programs and Award Levels
Not Fully Mature
617.401.7662 www.GrayAssociates.com 11
GRAY For more information please contact Bob Atkins. Email: [email protected]
Agenda
1. Introduction
2. Demand: National Overview
3. Demand for On-Line Programs
4. Demand for On-Ground Programs
5. Demand by Program and City
6. Acquisition Analysis: Corinthian Example
7. Summary
617.401.7662 www.GrayAssociates.com 12
GRAY For more information please contact Bob Atkins. Email: [email protected]
-
100,000
200,000
300,000
400,000
500,000
600,000
Jan Feb Mar Apr May Jun Jul Aug Sep Oct Nov Dec
Inquiries
Inquiries for On-Line Programs All Programs and Award Levels
2013
2014
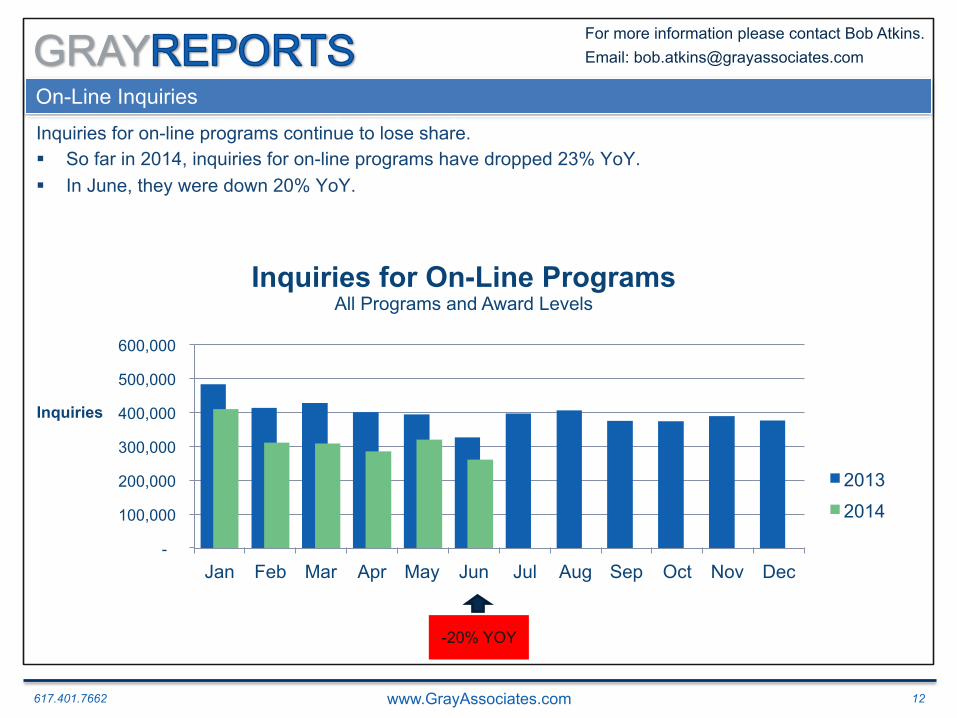
On-Line Inquiries Education Industry Inquiries: YOY Percent Change Inquiries for on-line programs continue to lose share. § So far in 2014, inquiries for on-line programs have dropped 23% YoY. § In June, they were down 20% YoY.
-20% YOY
617.401.7662 www.GrayAssociates.com 13
GRAY For more information please contact Bob Atkins. Email: [email protected]
1.9%
1.9%
2.2%
2.2%
2.2%
3.7%
2.0%
2.2%
2.0%
2.2%
1.9%
2.0%
1.9%
1.8%
2.5%
2.6%
2.5%
1.9%
0.00%
0.50%
1.00%
1.50%
2.00%
2.50%
3.00%
3.50%
4.00%
Jan Feb Mar Apr May Jun Jul Aug Sep Oct Nov Dec
App
licat
ion
Rat
e
On-Line Education Industry Application Rates 2013 2014
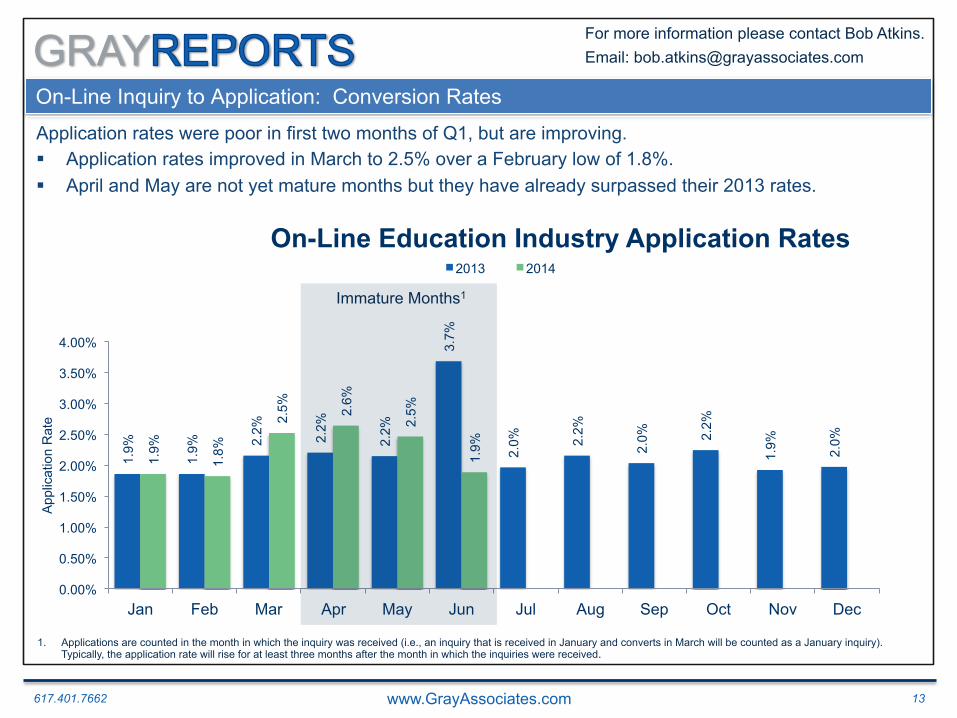
On-Line Inquiry to Application: Conversion Rates
Immature Months1
Application rates were poor in first two months of Q1, but are improving. § Application rates improved in March to 2.5% over a February low of 1.8%. § April and May are not yet mature months but they have already surpassed their 2013 rates.
1. Applications are counted in the month in which the inquiry was received (i.e., an inquiry that is received in January and converts in March will be counted as a January inquiry). Typically, the application rate will rise for at least three months after the month in which the inquiries were received.
617.401.7662 www.GrayAssociates.com 14
GRAY For more information please contact Bob Atkins. Email: [email protected]
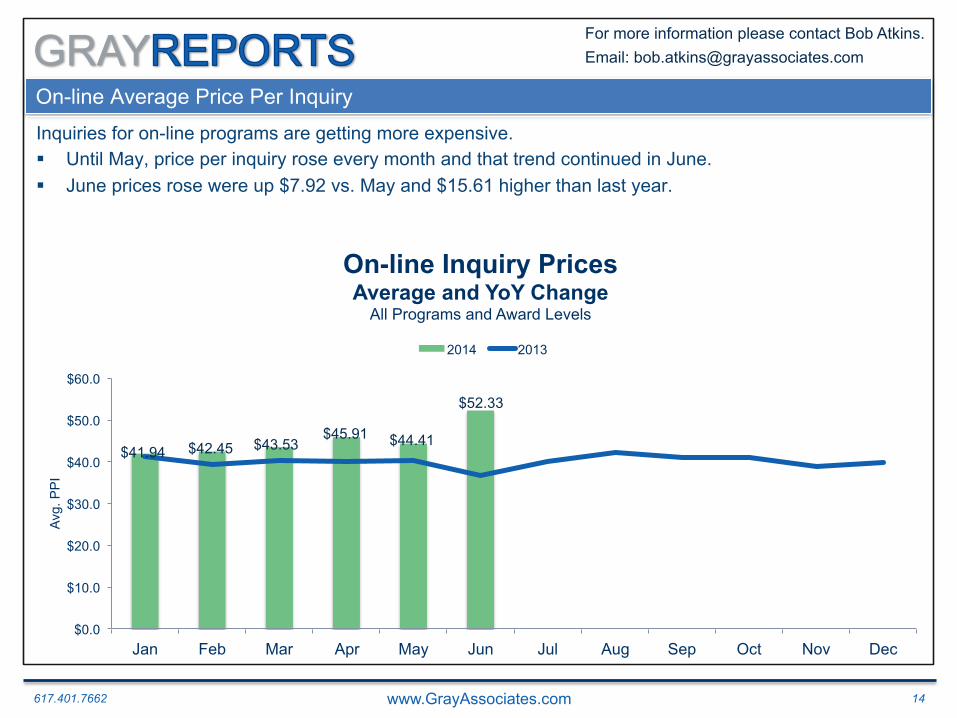
On-line Average Price Per Inquiry
Inquiries for on-line programs are getting more expensive. § Until May, price per inquiry rose every month and that trend continued in June. § June prices rose were up $7.92 vs. May and $15.61 higher than last year.
$0.0
$10.0
$20.0
$30.0
$40.0
$50.0
$60.0
Jan Feb Mar Apr May Jun Jul Aug Sep Oct Nov Dec
Avg.
PP
I
On-line Inquiry Prices Average and YoY Change
All Programs and Award Levels
2014 2013
$41.94 $42.45 $43.53 $45.91 $44.41
$52.33
617.401.7662 www.GrayAssociates.com 15
GRAY For more information please contact Bob Atkins. Email: [email protected]
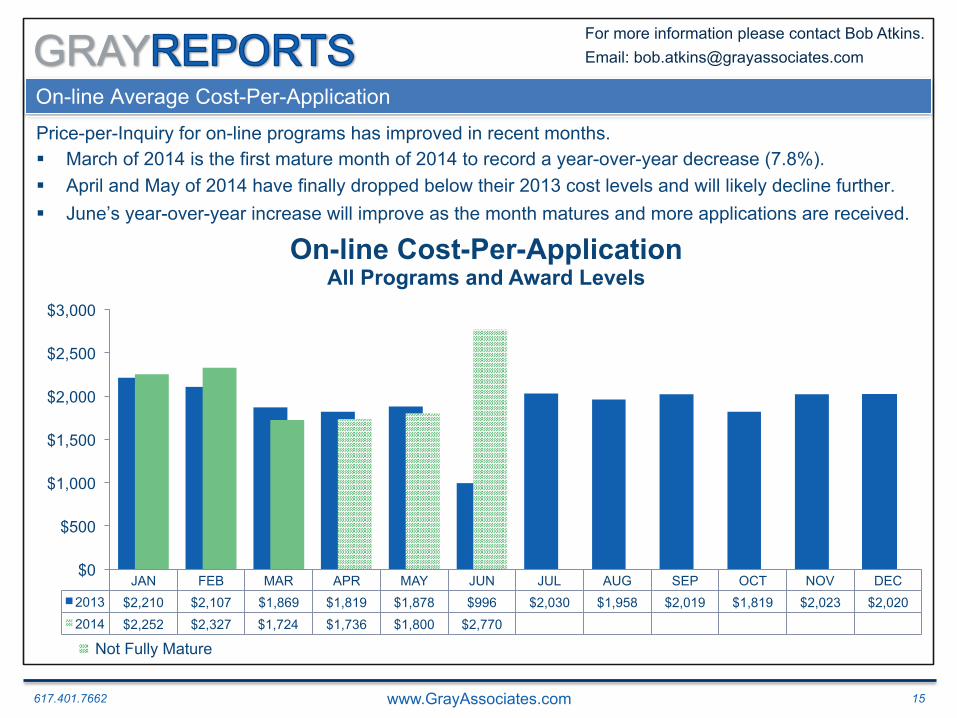
On-line Average Cost-Per-Application
Price-per-Inquiry for on-line programs has improved in recent months. § March of 2014 is the first mature month of 2014 to record a year-over-year decrease (7.8%). § April and May of 2014 have finally dropped below their 2013 cost levels and will likely decline further. § June’s year-over-year increase will improve as the month matures and more applications are received.
JAN FEB MAR APR MAY JUN JUL AUG SEP OCT NOV DEC 2013 $2,210 $2,107 $1,869 $1,819 $1,878 $996 $2,030 $1,958 $2,019 $1,819 $2,023 $2,020 2014 $2,252 $2,327 $1,724 $1,736 $1,800 $2,770
$0
$500
$1,000
$1,500
$2,000
$2,500
$3,000
On-line Cost-Per-Application All Programs and Award Levels
Not Fully Mature
617.401.7662 www.GrayAssociates.com 16
GRAY For more information please contact Bob Atkins. Email: [email protected]
Agenda
1. Introduction
2. Demand: National Overview
3. Demand for On-Line Programs
4. Demand for On-Ground Programs
5. Demand by Program and City
6. Acquisition Analysis: Corinthian Example
7. Summary
617.401.7662 www.GrayAssociates.com 17
GRAY For more information please contact Bob Atkins. Email: [email protected]
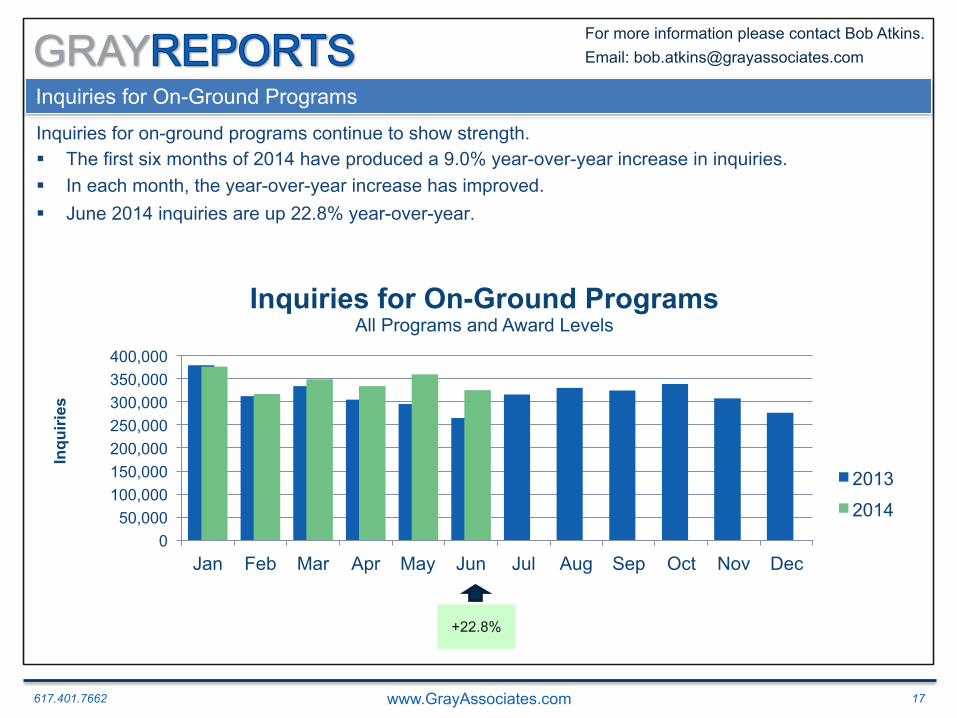
Inquiries for On-Ground Programs
Inquiries for on-ground programs continue to show strength. § The first six months of 2014 have produced a 9.0% year-over-year increase in inquiries. § In each month, the year-over-year increase has improved. § June 2014 inquiries are up 22.8% year-over-year.
2012
0 50,000
100,000 150,000 200,000 250,000 300,000 350,000 400,000
Jan Feb Mar Apr May Jun Jul Aug Sep Oct Nov Dec
Inqu
iries
Inquiries for On-Ground Programs All Programs and Award Levels
2013
2014
+22.8%
617.401.7662 www.GrayAssociates.com 18
GRAY For more information please contact Bob Atkins. Email: [email protected]
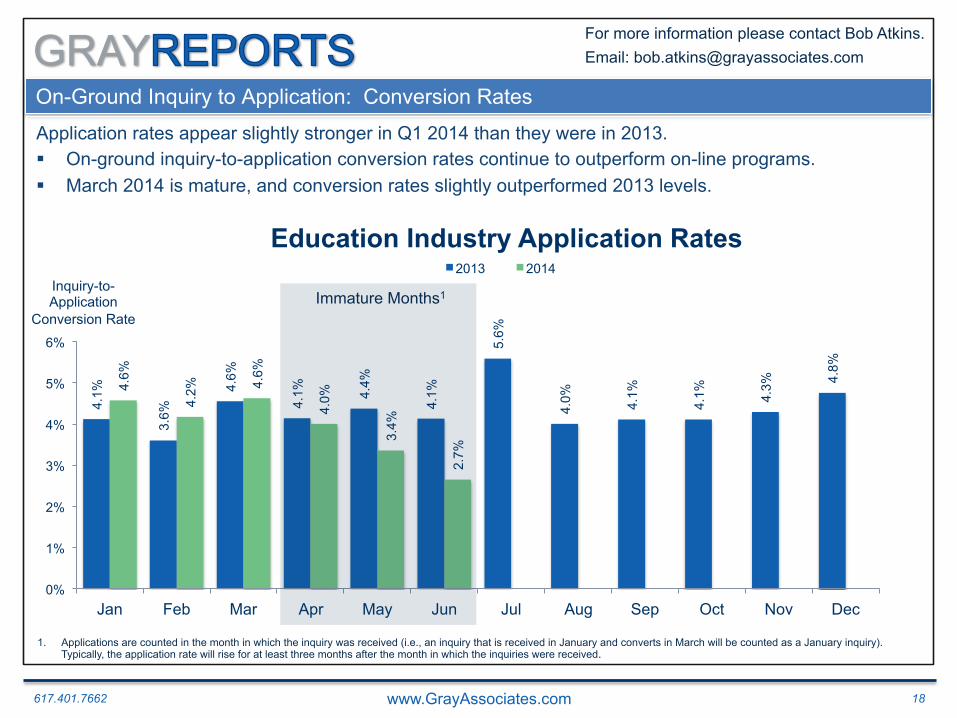
4.1%
3.6%
4.6%
4.1%
4.4%
4.1%
5.6%
4.0%
4.1%
4.1%
4.3%
4.8%
4.6%
4.2%
4.6%
4.0%
3.4%
2.7%
0%
1%
2%
3%
4%
5%
6%
Jan Feb Mar Apr May Jun Jul Aug Sep Oct Nov Dec
Inquiry-to- Application
Conversion Rate
Education Industry Application Rates 2013 2014
On-Ground Inquiry to Application: Conversion Rates
Immature Months1
Application rates appear slightly stronger in Q1 2014 than they were in 2013. § On-ground inquiry-to-application conversion rates continue to outperform on-line programs. § March 2014 is mature, and conversion rates slightly outperformed 2013 levels.
1. Applications are counted in the month in which the inquiry was received (i.e., an inquiry that is received in January and converts in March will be counted as a January inquiry). Typically, the application rate will rise for at least three months after the month in which the inquiries were received.
617.401.7662 www.GrayAssociates.com 19
GRAY For more information please contact Bob Atkins. Email: [email protected]
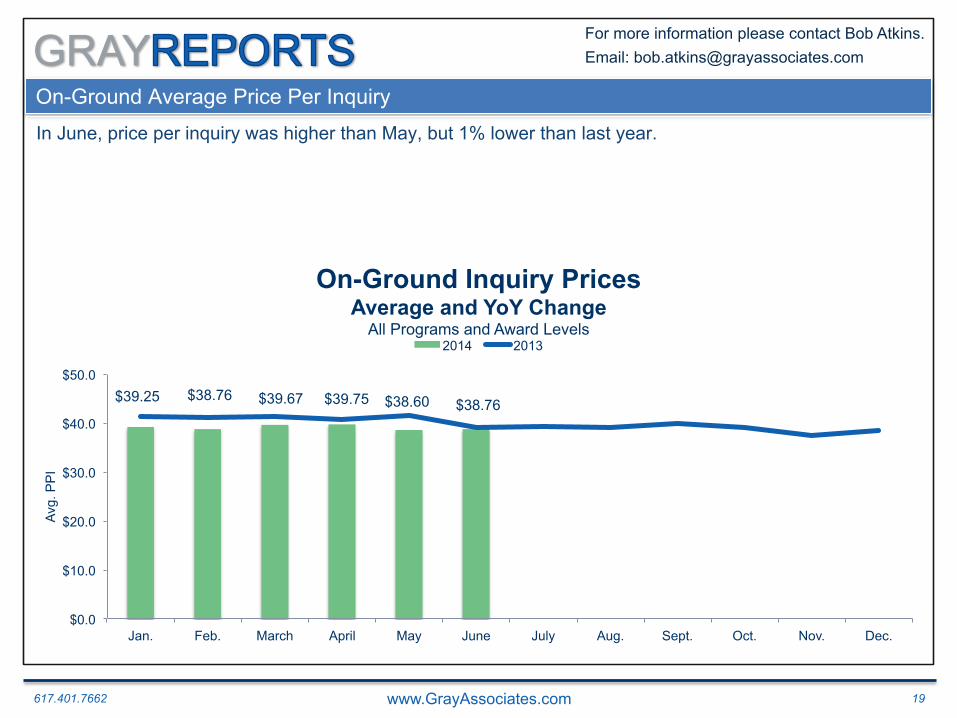
On-Ground Average Price Per Inquiry
In June, price per inquiry was higher than May, but 1% lower than last year.
$39.25 $38.76 $39.67 $39.75 $38.60 $38.76
$0.0
$10.0
$20.0
$30.0
$40.0
$50.0
Jan. Feb. March April May June July Aug. Sept. Oct. Nov. Dec.
Avg.
PP
I
On-Ground Inquiry Prices Average and YoY Change
All Programs and Award Levels 2014 2013
617.401.7662 www.GrayAssociates.com 20
GRAY For more information please contact Bob Atkins. Email: [email protected]
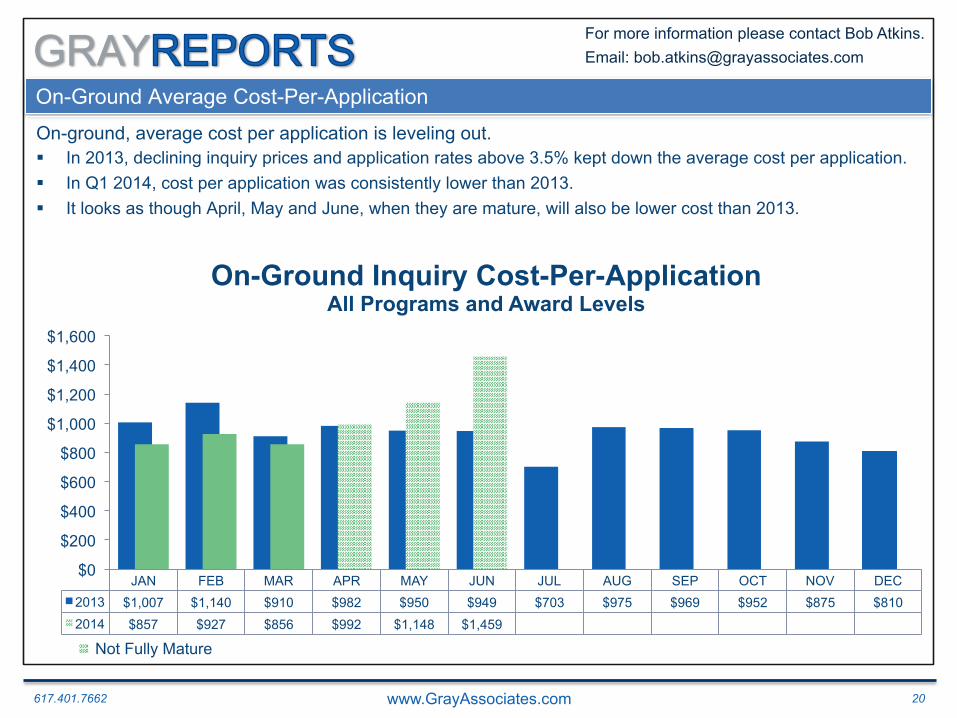
On-Ground Average Cost-Per-Application
On-ground, average cost per application is leveling out. § In 2013, declining inquiry prices and application rates above 3.5% kept down the average cost per application. § In Q1 2014, cost per application was consistently lower than 2013. § It looks as though April, May and June, when they are mature, will also be lower cost than 2013.
JAN FEB MAR APR MAY JUN JUL AUG SEP OCT NOV DEC 2013 $1,007 $1,140 $910 $982 $950 $949 $703 $975 $969 $952 $875 $810 2014 $857 $927 $856 $992 $1,148 $1,459
$0
$200
$400
$600
$800
$1,000
$1,200
$1,400
$1,600
On-Ground Inquiry Cost-Per-Application All Programs and Award Levels
Not Fully Mature
617.401.7662 www.GrayAssociates.com 21
GRAY For more information please contact Bob Atkins. Email: [email protected]
Agenda
1. Introduction
2. Demand: National Overview
3. Demand for On-Line Programs
4. Demand for On-Ground Programs
5. Demand by Program and City
6. Acquisition Analysis: Corinthian Example
7. Summary
617.401.7662 www.GrayAssociates.com 22
GRAY For more information please contact Bob Atkins. Email: [email protected]
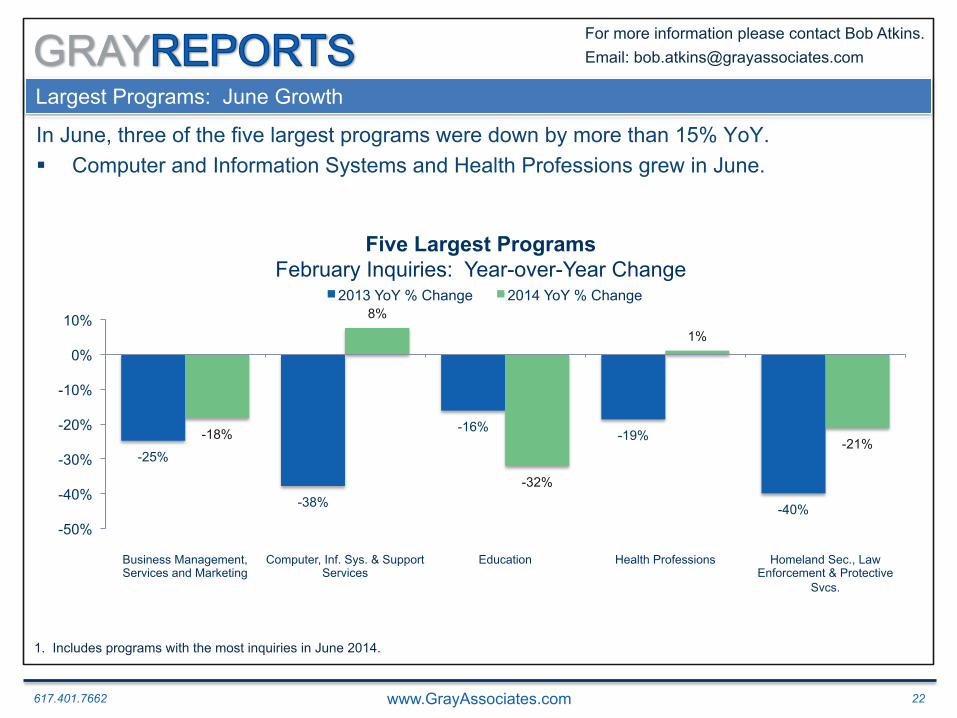
Largest Programs: June Growth
In June, three of the five largest programs were down by more than 15% YoY. § Computer and Information Systems and Health Professions grew in June.
-25%
-38%
-16% -19%
-40%
-18%
8%
-32%
1%
-21%
-50%
-40%
-30%
-20%
-10%
0%
10%
Business Management, Services and Marketing
Computer, Inf. Sys. & Support Services
Education Health Professions Homeland Sec., Law Enforcement & Protective
Svcs.
Five Largest Programs February Inquiries: Year-over-Year Change
2013 YoY % Change 2014 YoY % Change
1. Includes programs with the most inquiries in June 2014.
617.401.7662 www.GrayAssociates.com 23
GRAY For more information please contact Bob Atkins. Email: [email protected]
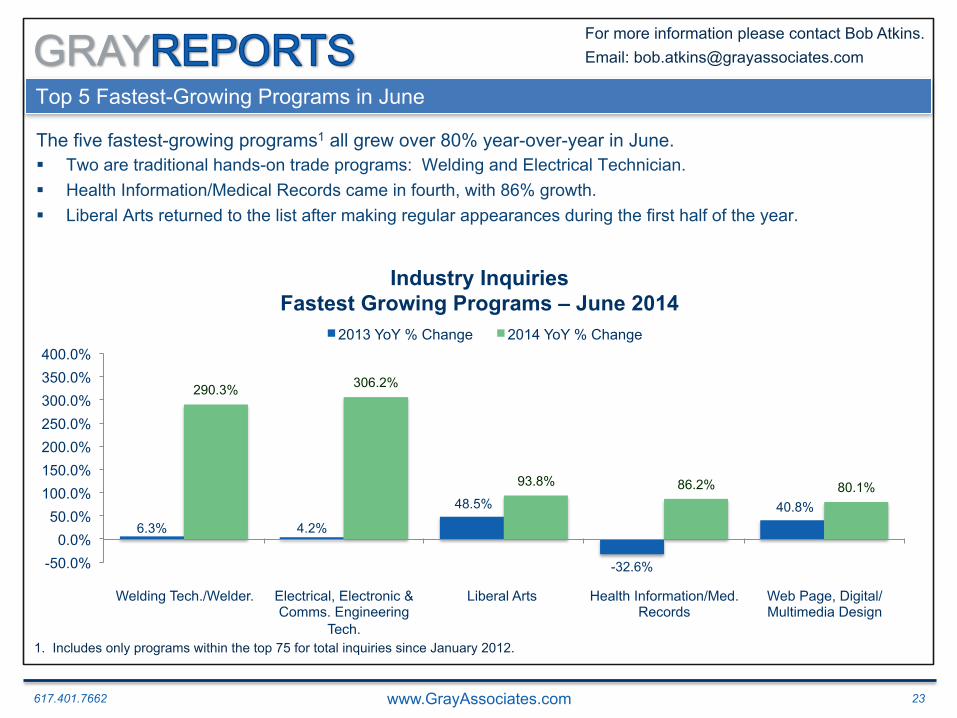
Top 5 Fastest-Growing Programs in June
The five fastest-growing programs1 all grew over 80% year-over-year in June. § Two are traditional hands-on trade programs: Welding and Electrical Technician. § Health Information/Medical Records came in fourth, with 86% growth. § Liberal Arts returned to the list after making regular appearances during the first half of the year.
6.3% 4.2%
48.5%
-32.6%
40.8%
290.3% 306.2%
93.8% 86.2% 80.1%
-50.0% 0.0%
50.0% 100.0% 150.0% 200.0% 250.0% 300.0% 350.0% 400.0%
Welding Tech./Welder. Electrical, Electronic & Comms. Engineering
Tech.
Liberal Arts Health Information/Med. Records
Web Page, Digital/Multimedia Design
Industry Inquiries Fastest Growing Programs – June 2014
2013 YoY % Change 2014 YoY % Change
1. Includes only programs within the top 75 for total inquiries since January 2012.
617.401.7662 www.GrayAssociates.com 24
GRAY For more information please contact Bob Atkins. Email: [email protected]
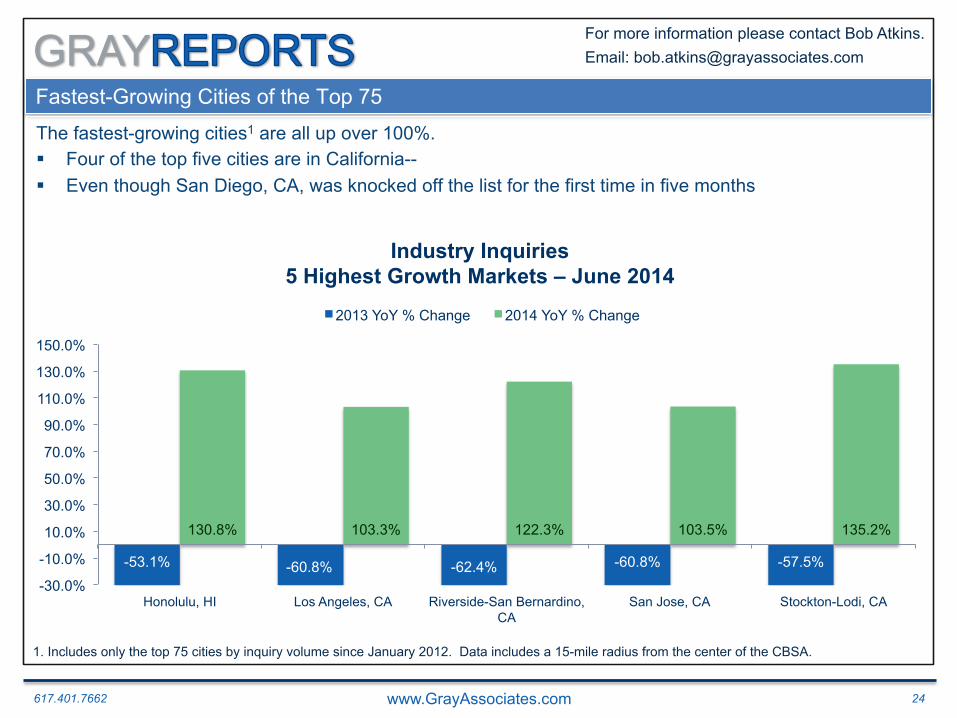
Fastest-Growing Cities of the Top 75
The fastest-growing cities1 are all up over 100%. § Four of the top five cities are in California-- § Even though San Diego, CA, was knocked off the list for the first time in five months
-53.1% -60.8% -62.4% -60.8% -57.5%
130.8% 103.3% 122.3% 103.5% 135.2%
-30.0%
-10.0%
10.0%
30.0%
50.0%
70.0%
90.0%
110.0%
130.0%
150.0%
Honolulu, HI Los Angeles, CA Riverside-San Bernardino, CA
San Jose, CA Stockton-Lodi, CA
Industry Inquiries 5 Highest Growth Markets – June 2014
2013 YoY % Change 2014 YoY % Change
1. Includes only the top 75 cities by inquiry volume since January 2012. Data includes a 15-mile radius from the center of the CBSA.
617.401.7662 www.GrayAssociates.com 25
GRAY For more information please contact Bob Atkins. Email: [email protected]
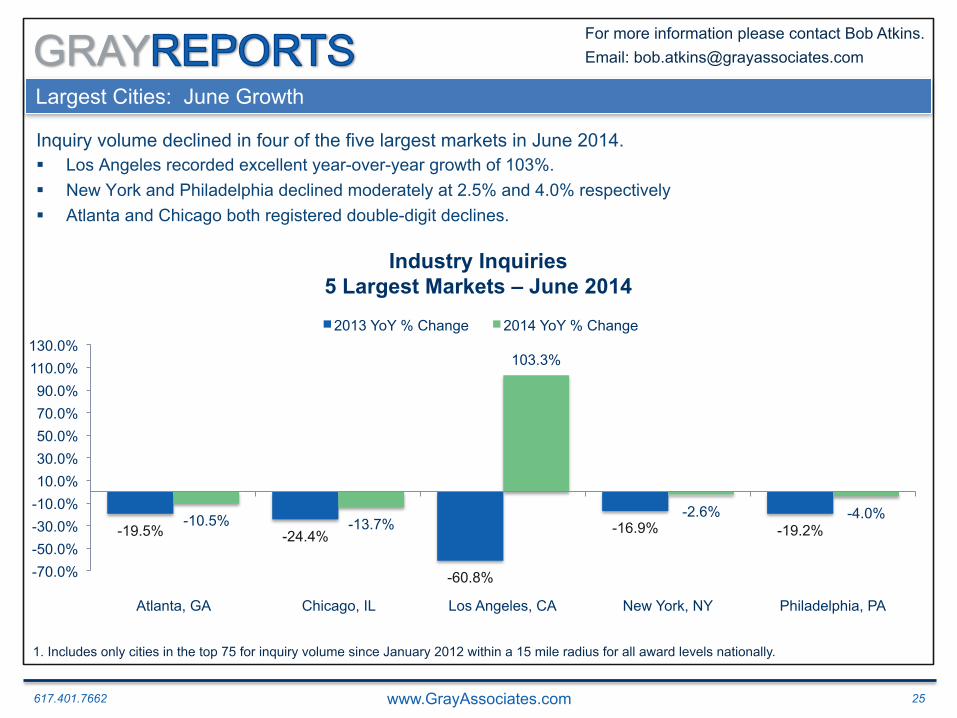
Largest Cities: June Growth
Inquiry volume declined in four of the five largest markets in June 2014. § Los Angeles recorded excellent year-over-year growth of 103%. § New York and Philadelphia declined moderately at 2.5% and 4.0% respectively § Atlanta and Chicago both registered double-digit declines.
-19.5% -24.4%
-60.8%
-16.9% -19.2% -10.5% -13.7%
103.3%
-2.6% -4.0%
-70.0% -50.0% -30.0% -10.0% 10.0% 30.0% 50.0% 70.0% 90.0%
110.0% 130.0%
Atlanta, GA Chicago, IL Los Angeles, CA New York, NY Philadelphia, PA
Industry Inquiries 5 Largest Markets – June 2014
2013 YoY % Change 2014 YoY % Change
1. Includes only cities in the top 75 for inquiry volume since January 2012 within a 15 mile radius for all award levels nationally.
617.401.7662 www.GrayAssociates.com 26
GRAY For more information please contact Bob Atkins. Email: [email protected]
Agenda
1. Introduction
2. Demand: National Overview
3. Demand for On-Line Programs
4. Demand for On-Ground Programs
5. Demand by Program and City
6. Acquisition Analysis: Corinthian Example
7. Summary
Confidential www.GrayAssociates.com 27
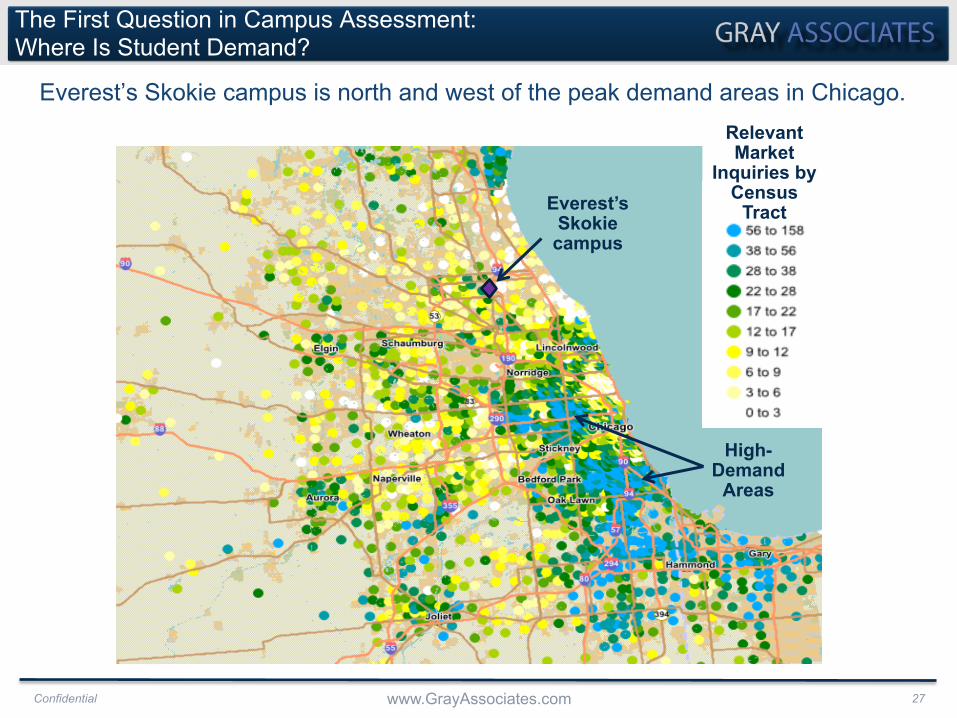
Everest’s Skokie campus is north and west of the peak demand areas in Chicago.
The First Question in Campus Assessment: Where Is Student Demand?
Relevant Market
Inquiries by Census
Tract Everest’s Skokie campus
High-Demand
Areas
Confidential www.GrayAssociates.com 28
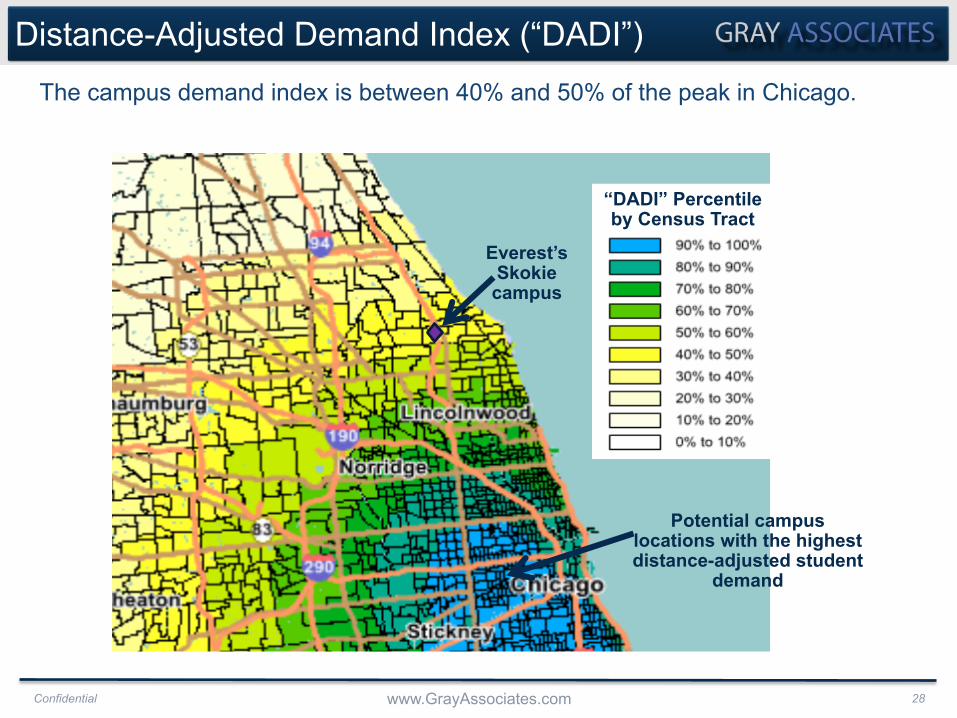
The campus demand index is between 40% and 50% of the peak in Chicago.
Distance-Adjusted Demand Index (“DADI”)
Everest’s Skokie campus
“DADI” Percentile by Census Tract
Potential campus locations with the highest distance-adjusted student
demand
Confidential www.GrayAssociates.com 29
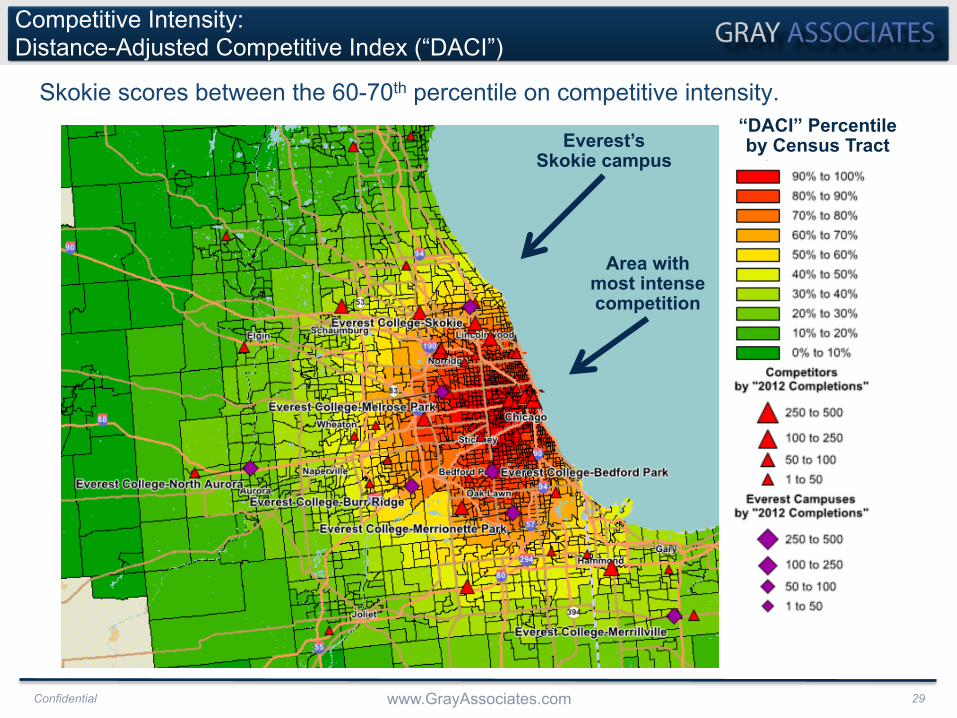
Skokie scores between the 60-70th percentile on competitive intensity.
Competitive Intensity: Distance-Adjusted Competitive Index (“DACI”)
Everest’s Skokie campus
Area with most intense competition
“DACI” Percentile by Census Tract
Confidential www.GrayAssociates.com 30
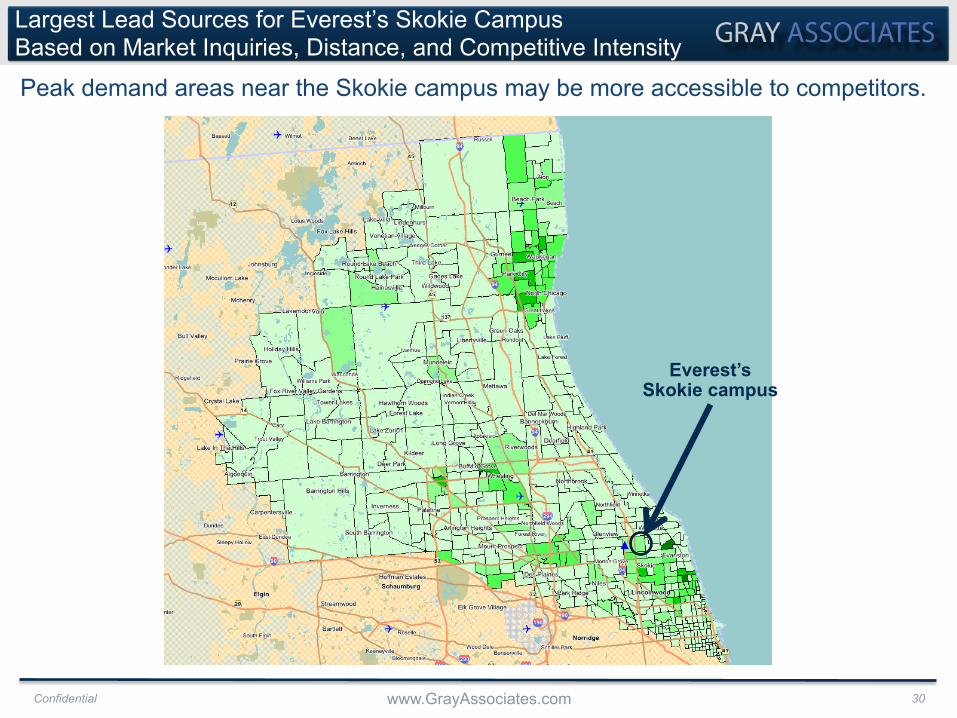
Peak demand areas near the Skokie campus may be more accessible to competitors.
Largest Lead Sources for Everest’s Skokie Campus Based on Market Inquiries, Distance, and Competitive Intensity
Everest’s Skokie campus
617.401.7662 www.GrayAssociates.com 31
GRAY For more information please contact Bob Atkins. Email: [email protected]
Agenda
1. Introduction
2. Demand: National Overview
3. Demand for On-Line Programs
4. Demand for On-Ground Programs
5. Demand by Program and City
6. Acquisition Analysis: Corinthian Example
7. Summary
617.401.7662 www.GrayAssociates.com 32
GRAY For more information please contact Bob Atkins. Email: [email protected]
Key Findings
There is a fundamental shift in the mix between On-Line and On-Ground Programs
§ Inquiries are down 20% for on-line programs.
§ Inquiries for on-ground programs increased nearly 23%.
§ On-ground programs gained nearly 8 share points
§ On-line program lost nearly share 7 points.
617.401.7662 www.GrayAssociates.com 33
GRAY For more information please contact Bob Atkins. Email: [email protected]
How do I get Information for My Locations and Programs?
Gray Reports is offered as an annual subscription. § Customized for your locations § Customized for your programs § Monthly PDF overview of inquiry, application, and pricing tends in your markets § On-line access to your market data by program, campus, veteran’s status, years since
high school and other factors
617.401.7662 www.GrayAssociates.com 34
GRAY For more information please contact Bob Atkins. Email: [email protected]
Questions and Contacts
Please feel free to contact me: Bob Atkins
CEO Gray Associates, Inc.
617-401-7662
For the presentation or a recording of the session, please visit: GrayAssociates.com