2016 november grayreports - demand trends in higher education
TRANSCRIPT

GRAYREPORTS Demand for Higher Education Programs
www.GrayAssociates.com
Results through November 2016

617.366.2838 www.GrayAssociates.com 2
GRAY For more information please contact Gray Associates. Email: [email protected]
Who Is Gray?
Program and Market Evaluation Data
Employment BLS/O*NET
Placement Rates Gray Research
Student Inquiries GrayReports
Demographics US Census
Job Postings CEB TalentNeuron
Programs Price Projects Place § Program portfolio
strategy § Program profiles § Program development
§ City targeting § Location selection § Campus consolidation
§ Price elasticity § Price positioning § Price optimization
§ Business strategy § Strategy implementation § Acquisition analysis § Complex analytics
Advanced Analytics Predictive Models
Geo-Analytics
Clients: Higher Education Institutions and Stakeholders
Competition IPEDS+
Gray’s Program Evaluation System is available as an SaaS solution.
Enhanced Crosswalks

617.366.2838 www.GrayAssociates.com 3
GRAY For more information please contact Gray Associates. Email: [email protected]
Strategies for Developing New Academic Programs: January 18 -20, 2017 – San Diego, CA
Gray will be presenting at the AI conference in San Diego on January 18-20.
Learn the art and science of selecting new academic programs. You will walk through a set of criteria that should guide your decisions on which programs to Start. You will leave this event better able to assess the potential for a new academic program, including:
§ Fit with your institutional mission and goals § Operational feasibility given your capacity and resources § Prospective student enrollment § Internal support to get it up and running § Profitability and impact resulting from failure
For more information, please visit:
www.AcademicImpressions.com
Strategies for Developing New Academic Programs January 18-20, San Diego, CA

617.366.2838 www.GrayAssociates.com 4
GRAY For more information please contact Gray Associates. Email: [email protected]
Agenda
1. Inquiry and Conversion Trends:
1. National
2. Online and On-Campus
3. Degree and Channel
2. Integrated View of Student and Employer Demand:
1. City and Program
2. Job Posting Trends
3. Summary

617.366.2838 www.GrayAssociates.com 5
GRAY For more information please contact Gray Associates. Email: [email protected]
Overall Student Inquiries (All Sources)
We will share data from 2014, 2015, and 2016. § GrayReports covers January 2012 through the present. § We add between 600,000 to 1 million qualified inquires to the dataset each month. Introduce how to read
chart: years and colors
Report Monthly to account for seasonality
0
200,000
400,000
600,000
800,000
1,000,000
1,200,000
Jan Feb Mar Apr May Jun Jul Aug Sep Oct Nov Dec
National Inquiries All Programs and Award Levels
2014 2015 2016

617.366.2838 www.GrayAssociates.com 6
GRAY For more information please contact Gray Associates. Email: [email protected]
0
200,000
400,000
600,000
800,000
1,000,000
1,200,000
Jan Feb Mar Apr May Jun Jul Aug Sep Oct Nov Dec
National Inquiries All Programs and Award Levels
2014 2015 2016
Overall Student Inquiries (All Sources)
Inquiries have decreased an average of 9% year-over-year in 2016.
• Big declines were earlier in the year.
• August and September were closer to last year’s results. -9%

617.366.2838 www.GrayAssociates.com 7
GRAY For more information please contact Gray Associates. Email: [email protected]
0
200,000
400,000
600,000
800,000
1,000,000
1,200,000
Jan Feb Mar Apr May Jun Jul Aug Sep Oct Nov Dec
National Inquiries All Programs and Award Levels
2014 2015 2016
Overall Student Inquiries (All Sources)
In November, inquiry volumes decreased 8%.
5% is a little worse than last month’s 1% decline, but better than this year’s average 8% decline.
-8% YoY

617.366.2838 www.GrayAssociates.com 8
GRAY For more information please contact Gray Associates. Email: [email protected]
Branded Inquiries
Branded inquiries are up for the seventh consecutive month. § The average monthly growth rate for branded inquiries in 2016 is 7%. § In November, branded inquiries grew 5%.
0
50,000
100,000
150,000
200,000
250,000
300,000
350,000
Jan Feb Mar Apr May Jun Jul Aug Sep Oct Nov Dec
National Branded Inquiries All Programs and Award Levels 2014 2015 2016
+5% YoY
Define Branded Inquiries: Inquiries for a particular school’s brand name
There is an critical implication: if Branded inquiries become more prevalent, awareness and preference for your brand will increase in importance.
But, most institutions do not have the budget to support brand marketing. This trend may favor
1. bigger schools with stronger brands, and more ability to fund brand marketing and football teams.
2. Schools with well-defined niches in which they are well-known and well-regarded.

617.366.2838 www.GrayAssociates.com 9
GRAY For more information please contact Gray Associates. Email: [email protected]
External Inquiries: Overall Results
External (or PPL) inquiries for higher education have dropped an average of 15% in 2016.
0
100,000
200,000
300,000
400,000
500,000
600,000
700,000
800,000
900,000
Jan Feb Mar Apr May Jun Jul Aug Sep Oct Nov Dec
National External Inquiries All Programs and Award Levels 2014 2015 2016
Define External Inquiries: Inquiries from a third-party site that generates inquiries for higher education.
-15%

617.366.2838 www.GrayAssociates.com 10
GRAY For more information please contact Gray Associates. Email: [email protected]
External Inquiries: Overall Results
In November, external inquiries fell 14%, roughly in-line with the year-to-date average.
0
100,000
200,000
300,000
400,000
500,000
600,000
700,000
800,000
900,000
Jan Feb Mar Apr May Jun Jul Aug Sep Oct Nov Dec
National External Inquiries All Programs and Award Levels 2014 2015 2016
Define External Inquiries: Inquiries from a third-party site that generates inquiries for higher education.
-14% YoY

617.366.2838 www.GrayAssociates.com 11
GRAY For more information please contact Gray Associates. Email: [email protected]
Inquiry to Application: Overall Conversion Rates
In 2014 and 2015, conversion rates were volatile. § In 2014 and 2015, quarterly rates rose as little as 1% and as much as 22%.
80
85
90
95
100
105
110
115
120
125
Q1 2014 Q2 2014 Q3 2014 Q4 2014 Q1 2015 Q2 2015 Q3 2015 Q4 2015 Q1 2016 Q2 2016 Q3 2016
Overall Inquiry Conversion Rates: Trends (Indexed to Q1 2014)
1. Applications are counted in the month in which the inquiry was received (i.e., an inquiry that is received in January and converts in March will be counted as a January inquiry). Typically, the application rate will rise for at least three months after the month in which the inquiries were received.
2. Total includes unknown source type.
+11%
+22%
+1%
Explain Conversion Rates: schools
have many definitions of a
conversion, so in our data a conversion includes: an
application, an enrollment, or a
start.

617.366.2838 www.GrayAssociates.com 12
GRAY For more information please contact Gray Associates. Email: [email protected]
80
85
90
95
100
105
110
115
120
125
Q1 2014 Q2 2014 Q3 2014 Q4 2014 Q1 2015 Q2 2015 Q3 2015 Q4 2015 Q1 2016 Q2 2016 Q3 2016
Overall Inquiry Conversion Rates: Trends (Indexed to Q1 2014)
Inquiry to Application: Overall Conversion Rates
In 2016, conversion rates seem to be stabilizing, close to 2014 levels. § Q3 2016 is not fully matured and is already greater than last quarter and 7% above the Q1 2014 level. § Rates may be stabilizing 5-10% above our baseline.
1. Applications are counted in the month in which the inquiry was received (i.e., an inquiry that is received in January and converts in March will be counted as a January inquiry). Typically, the application rate will rise for at least three months after the month in which the inquiries were received.
2. Total includes unknown source type.
+7%

617.366.2838 www.GrayAssociates.com 13
GRAY For more information please contact Gray Associates. Email: [email protected]
Overall Student Inquiry Conversions (All Sources)
For August inquiries, total conversions fell 13% year-over-year. § This is the highest volume of conversions since January of this year. § It now takes six months for conversions to fully mature, so the 13% gap should narrow.
1. Applications are counted in the month in which the inquiry was received (i.e., an inquiry that is received in January and converts in March will be counted as a January inquiry). Typically, the application rate will rise for at least three months after the month in which the inquiries were received.
Immature Months1
0 5,000
10,000 15,000 20,000 25,000 30,000 35,000 40,000
Jan Feb Mar Apr May Jun Jul Aug Sep Oct Nov Dec
Total Inquiry Conversions All Programs and Award Levels
2014 2015 2016
Explain Conversion Timing: Conversions are counted in the month in which the original inquiry is received. If a June inquiry converts I August, it is counted as a June Conversion.
Typically, inquires take 13 months to mature (or reach their maximum conversion rate.
More recently, conversions are taking longer, sometimes 5-6 months after the inquiry.
-13% YoY

617.366.2838 www.GrayAssociates.com 14
GRAY For more information please contact Gray Associates. Email: [email protected]
Jan Feb Mar Apr May Jun Jul Aug Sep Oct Nov Dec 2014 $41.72 $41.81 $41.70 $42.45 $40.94 $44.23 $44.25 $44.00 $45.34 $45.43 $44.79 $42.18 2015 $43.10 $43.50 $43.70 $43.61 $43.80 $43.63 $45.07 $44.75 $45.24 $44.92 $44.67 $44.75 2016 $45.11 $45.91 $44.79 $44.85 $42.47 $44.97 $44.39 $44.53 $45.13 $44.77 $44.92 $-
$30 $32 $34 $36 $38 $40 $42 $44 $46 $48
Average Price per Inquiry for PPI All Programs and Award Levels
Average Price for Pay-per-Inquiry
The average price of an External inquiry has been fairly stable. § Prices peaked in February at $45.91 and have fallen over $1.00 since then. § So far in 2016, the average price for paid inquiries has risen just 1.2% year-over-year.
Note: PPI means “Pay per Inquiry.” Inquiry price is the average price per inquiry from PPI.
+0.6%

617.366.2838 www.GrayAssociates.com 15
GRAY For more information please contact Gray Associates. Email: [email protected]
Agenda
1. Inquiry and Conversion Trends:
1. National
2. Online and On-Campus
3. Degree and Channel
2. Integrated View of Student and Employer Demand:
1. City and Program
2. Job Posting Trends
3. Summary

617.366.2838 www.GrayAssociates.com 16
GRAY For more information please contact Gray Associates. Email: [email protected]
0
50,000
100,000
150,000
200,000
250,000
300,000
350,000
Jan Feb Mar Apr May Jun Jul Aug Sep Oct Nov Dec
Inquiries
Inquiries for Online Programs All Programs and Award Levels
2014 2015 2016
Inquiries for Online Programs Education Industry Inquiries: YOY Percent Change Year-to-date, inquiries for online programs are flat year-over-year.
+0.1%

617.366.2838 www.GrayAssociates.com 17
GRAY For more information please contact Gray Associates. Email: [email protected]
0
50,000
100,000
150,000
200,000
250,000
300,000
350,000
Jan Feb Mar Apr May Jun Jul Aug Sep Oct Nov Dec
Inquiries
Inquiries for Online Programs All Programs and Award Levels 2014 2015 2016
Inquiries for Online Programs Education Industry Inquiries: YOY Percent Change After a drop in October, inquiries for online programs grew 5%. § Growth is particularly impressive since November grew over 40% last year. § Online inquiries have now increased in four of the last five months.
+5% YoY
617.366.2838 www.GrayAssociates.com 18
GRAY For more information please contact Gray Associates. Email: [email protected]
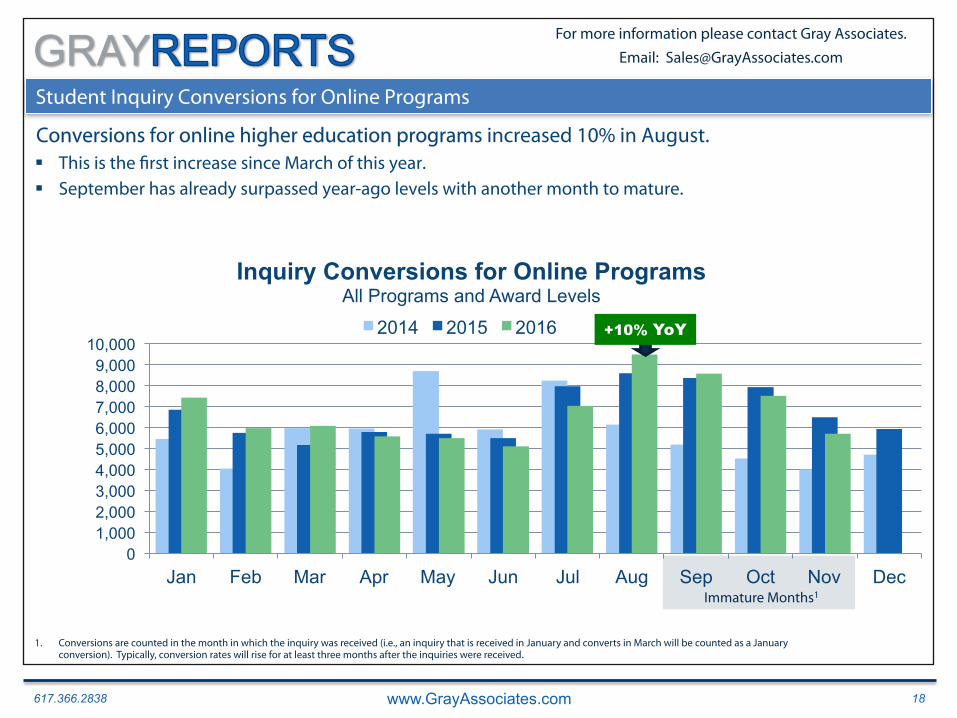
Student Inquiry Conversions for Online Programs
Conversions for online higher education programs increased 10% in August. § This is the first increase since March of this year. § September has already surpassed year-ago levels with another month to mature.
0 1,000 2,000 3,000 4,000 5,000 6,000 7,000 8,000 9,000
10,000
Jan Feb Mar Apr May Jun Jul Aug Sep Oct Nov Dec
Inquiry Conversions for Online Programs All Programs and Award Levels
2014 2015 2016
Immature Months1
1. Conversions are counted in the month in which the inquiry was received (i.e., an inquiry that is received in January and converts in March will be counted as a January conversion). Typically, conversion rates will rise for at least three months after the inquiries were received.
+10% YoY

617.366.2838 www.GrayAssociates.com 19
GRAY For more information please contact Gray Associates. Email: [email protected]
Inquiries for On-Campus Programs
The negative trend in inquiries for on-campus academic programs in higher education continues.
§ The first eleven months of 2016 have fallen short of year-ago levels by an average of 15%. § In November, inquiries for on-campus higher-education programs dropped 12% year-over-year.
2012
0 50,000
100,000 150,000 200,000 250,000 300,000 350,000 400,000 450,000
Jan Feb Mar Apr May Jun Jul Aug Sep Oct Nov Dec
Inquiries
Inquiries for On-Campus Programs All Programs and Award Levels
2014 2015 2016
-12% YoY 1. Conversions are counted in the month in which the inquiry was received (i.e., an inquiry that is received in January and converts in March will be counted as a January
conversion). Typically, conversion rates will rise for at least three months after the inquiries were received.

617.366.2838 www.GrayAssociates.com 20
GRAY For more information please contact Gray Associates. Email: [email protected]
Student Inquiry Conversions for On-Campus Programs
Conversions for on-campus programs fell 7% YoY in August. § May, June and July each closed the gap by about 1%. § September still has a large gap to make up before maturing.
0 2,000 4,000 6,000 8,000
10,000 12,000 14,000 16,000 18,000 20,000
Jan Feb Mar Apr May Jun Jul Aug Sep Oct Nov Dec
Inquiry Conversions for On-Campus Programs All Programs and Award Levels
2014 2015 2016
-7% YOY Immature Months1
1. Conversions are counted in the month in which the inquiry was received (i.e., an inquiry that is received in January and converts in March will be counted as a January conversion). Typically, conversion rates will rise for at least three months after the inquiries were received.

617.366.2838 www.GrayAssociates.com 21
GRAY For more information please contact Gray Associates. Email: [email protected]
Agenda
1. Inquiry and Conversion Trends:
1. National
2. Online and On-Campus
3. Degree and Channel
2. Integrated View of Student and Employer Demand:
1. City and Program
2. Job Posting Trends
3. Summary
617.366.2838 www.GrayAssociates.com 22
GRAY For more information please contact Gray Associates. Email: [email protected]
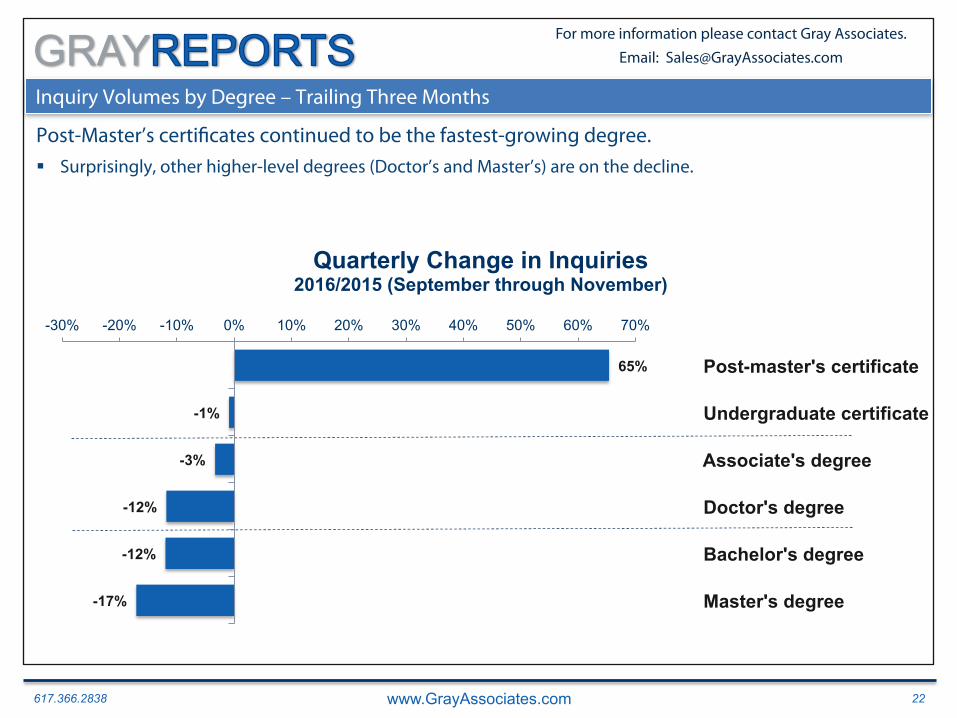
Inquiry Volumes by Degree – Trailing Three Months
Post-Master’s certificates continued to be the fastest-growing degree. § Surprisingly, other higher-level degrees (Doctor’s and Master’s) are on the decline.
-17%
-12%
-12%
-3%
-1%
65%
-30% -20% -10% 0% 10% 20% 30% 40% 50% 60% 70%
Master's degree
Bachelor's degree
Doctor's degree
Associate's degree
Undergraduate certificate
Post-master's certificate
Quarterly Change in Inquiries 2016/2015 (September through November)

617.366.2838 www.GrayAssociates.com 23
GRAY For more information please contact Gray Associates. Email: [email protected]
Inquiry Volumes by Channel – Trailing Three Months
Last month, Affiliate – PPC was the fastest-growing channel for student inquiries. § Six different Branded inquiry channels grew in the most recent quarter.
-64% -43% -37% -34% -30%
-12% -2%
2% 16%
25% 29% 32%
59% 61%
301%
-100% -50% 0% 50% 100% 150% 200% 250% 300% 350%
PPC - Inbound Call: Branded Email: Branded Interactive: Branded PPL: External Display: Branded Referral: Branded PPC: Branded Affiliate: External Website: Branded All Other Internal: Branded Offline Media: Branded Organic: Branded Inbound Phone: Branded Social Media: Branded Affiliate - PPC: External
Quarterly Change in Inquiries by Channel All Programs and Award Levels (September through November YoY)
617.366.2838 www.GrayAssociates.com 24
GRAY For more information please contact Gray Associates. Email: [email protected]
Agenda
1. Inquiry and Conversion Trends:
1. National
2. Online and On-Campus
3. Degree and Channel
2. Integrated View of Student and Employer Demand:
1. City and Program
2. Job Postings Trends
3. Summary

617.366.2838 www.GrayAssociates.com 25
GRAY For more information please contact Gray Associates. Email: [email protected]
The Big 5 Programs: November Growth
Inquiries for the Big Five shrank over 10%–accounting for 91% of the total decline in inquiries. § Medical Assisting performed the best, but still dropped 16%. § Registered Nursing was not far behind, decreasing 19%. § Criminal Justice/Police Science continued to drop, down 22%. § The two business programs dropped more than 25%.
-16% -19%
-22% -25%
-30% -35%
-30%
-25%
-20%
-15%
-10%
-5%
0%
Medical Assistant Registered Nursing Criminal Justice Business Admin: Associate's -
Business Admin: Bachelor's +
Five Largest Programs Since January 2012 Year-over-Year Change in November Inquiries
2016 YoY % Change

617.366.2838 www.GrayAssociates.com 26
GRAY For more information please contact Gray Associates. Email: [email protected]
21% 41%
-37% -34%
217%
153%
109% 99% 74%
-50%
0%
50%
100%
150%
200%
250%
Human Services, General
Medical Insurance Coding Specialist/
Coder.
Health Services Administration.
Health Information/Medical Records
Technology/Technician.
Construction Management.
The Fast 5 Programs Year-over-Year Change in November Inquiries
2015 YoY % Change 2016 YoY % Change
The Fast 5 Programs: The Higher Education Programs with the Fastest Inquiry Growth
All five of the fastest-growing programs1 grew more than 70%. § At over 200%, Human Services grew the fastest. § The three fastest growers this month are repeats from last month’s five fastest-growing list.
1. Includes the top 75 programs in inquiry volume since January 2012. 2. May reflect competitive marketing, or reporting by Gray’s data suppliers.

617.366.2838 www.GrayAssociates.com 27
GRAY For more information please contact Gray Associates. Email: [email protected]
Student Inquiries: The Big 5 Cities
All five cities in The Big 5 decreased year-over-year. § Philadelphia performed the best, but still declined 9% compared to November 2015. § Chicago had the largest decline–a drop of 35%.
-16%
-10% -9%
-23%
-15%
-9%
-21%
-32% -34% -35% -40%
-30%
-20%
-10%
0%
10%
Philadelphia, PA New York, NY Atlanta, GA Los Angeles, CA Chicago, IL
Top Five Cities for Inquiries Since January 2012 Year-over-Year Change in November Inquiries
2015 YoY % Change 2016 YoY % Change
Note: The market for each city is defined as a 15-mile radius around the population center of its CBSA.

617.366.2838 www.GrayAssociates.com 28
GRAY For more information please contact Gray Associates. Email: [email protected]
Agenda
1. Inquiry and Conversion Trends:
1. National
2. Online and On-Campus
3. Degree and Channel
2. Integrated View of Student and Employer Demand:
1. City and Program
2. Job Posting Trends
3. Summary

617.366.2838 www.GrayAssociates.com 29
GRAY For more information please contact Gray Associates. Email: [email protected]
-2%
4%
10%
27%
-10% 0% 10% 20% 30%
Bachelor's
Master's
Associate's
Doctorate
National Quarterly Change in New Job Postings 2016/2015 (September through November)
National New Job Postings by Degree – Trailing Three Months1
Unlike last month, not all new job postings requiring a degree grew for the last three months. § Job postings for Bachelor’s degrees decreased 2%. § Compared to last year, job postings that require a Doctoral degree grew 27%.
1. Excludes Heavy and Tractor-Trailer Truck Drivers.
617.366.2838 www.GrayAssociates.com 30
GRAY For more information please contact Gray Associates. Email: [email protected]
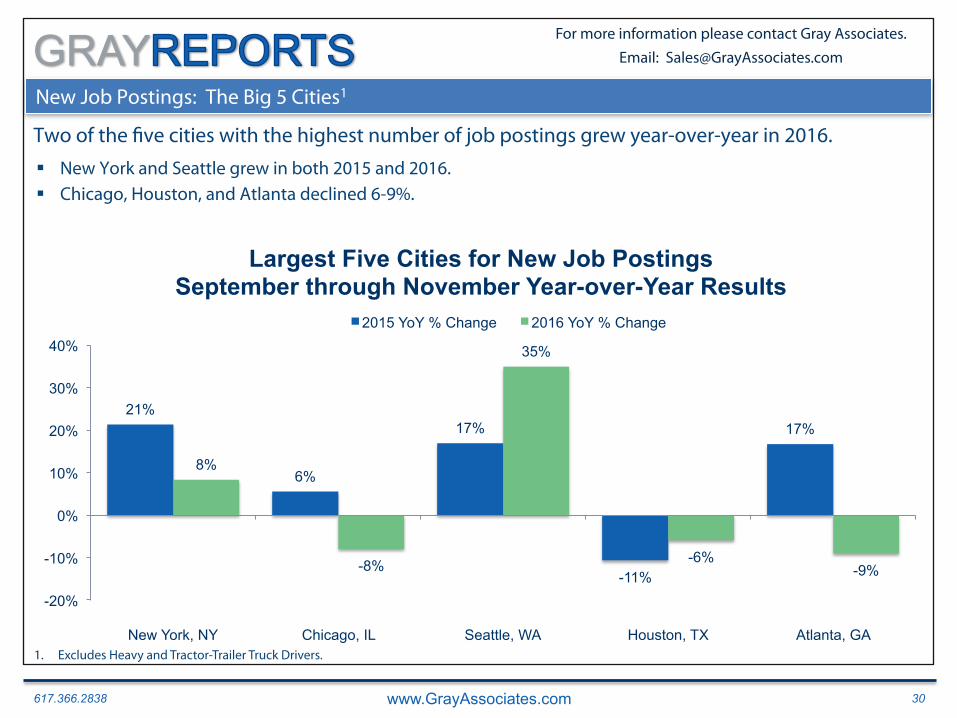
New Job Postings: The Big 5 Cities1
Two of the five cities with the highest number of job postings grew year-over-year in 2016. § New York and Seattle grew in both 2015 and 2016. § Chicago, Houston, and Atlanta declined 6-9%.
21%
6%
17%
-11%
17%
8%
-8%
35%
-6% -9%
-20%
-10%
0%
10%
20%
30%
40%
New York, NY Chicago, IL Seattle, WA Houston, TX Atlanta, GA
Largest Five Cities for New Job Postings September through November Year-over-Year Results
2015 YoY % Change 2016 YoY % Change
1. Excludes Heavy and Tractor-Trailer Truck Drivers.

617.366.2838 www.GrayAssociates.com 31
GRAY For more information please contact Gray Associates. Email: [email protected]
New Job Postings: Ten Largest Occupations in Nation1,2
Once again, in the past three months, Registered Nursing had the most new job postings in the country.
§ Half of the top ten occupations involve some form of computer systems or IT. § In this time period, the 10 largest occupations made up 31% of the total new job postings requiring a degree.
0 100,000 200,000 300,000 400,000
Registered Nurses
Computer Occupations, All Other
Software Developers, Applications
Marketing Managers
Computer Systems Analysts
Accountants and Auditors
Medical and Health Services Managers
Computer User Support Specialists
Management Analysts
Network and Computer Systems Administrators
New Job Postings in Last 3 Months (Sep-Nov 2016) Ten Largest Occupations in the U.S.
IT
Health
Other
1. Includes only the occupations that require at least an Associate’s degree.
2. Excludes Heavy and Tractor-Trailer Truck Drivers.

617.366.2838 www.GrayAssociates.com 32
GRAY For more information please contact Gray Associates. Email: [email protected]
New Job Postings: Ten Fastest Growing Occupations in Nation1,2
The fastest-growing occupations are generally in the healthcare industry.
§ Five of the ten fastest-growing occupations are related to healthcare.
0% 10% 20% 30% 40% 50% 60% 70% 80%
Hairdressers, Hairstylists, and Cosmetologists
Internists, General
Family and General Practitioners
Nurse Practitioners
Physicians and Surgeons, All Other
Physical Therapists
Teacher Assistants
Coaches and Scouts
Preschool Teachers, Except Special Education
Child, Family, and School Social Workers
New Job Postings in Last 3 Months (Sep-Nov 2016) Ten Fastest Growing Occupations in Nation
1. Includes only the 100 largest occupations that require at least an Associate’s degree.
2. Excludes Heavy and Tractor-Trailer Truck Drivers.
Health
Other

617.366.2838 www.GrayAssociates.com 33
GRAY For more information please contact Gray Associates. Email: [email protected]
New Job Postings: Ten Most Requested Hard Skills in Nation1,2
Nationally, the most requested hard skill for jobs requiring a degree was quality assurance.
§ Programming languages such as SQL, Java, and JavaScript are among the most requested hard skills. § Despite the size and growth of health occupations, only Pediatrics made the top ten skills.
0 50,000 100,000 150,000 200,000 250,000
Quality Assurance
Structured query language
Java
Pediatrics
Technical support
Linux
Customer relationship management
Bilingual
Quality control
JavaScript
New Job Postings in Last 3 Months (Sep-Nov 2016) Ten Most-Requested Hard Skills in the US
1. Includes only the occupations that require at least an Associate’s degree.
2. Excludes Heavy and Tractor-Trailer Truck Drivers.
IT
Health
Other

617.366.2838 www.GrayAssociates.com 34
GRAY For more information please contact Gray Associates. Email: [email protected]
New Job Postings: Ten Fastest Growing Hard Skills in the US1,2
The fastest growing hard skills are generally in computer science.
§ Human Resources Software, a new hard skill on our list, grew over 2,700% year-over-year. § Three of the ten fastest growing hard skills are new this period.
0% 10% 20% 30% 40% 50% 60% 70% 80% 90% 100%
D Language
Human resources software
Spring
Systems Integration
Cloud Computing
Amazon Web Services
DevOps
User Experience design
Python
Critical care
New Job Postings in Last 3 Months (Sep-Nov 2016) Ten Fastest-Growing Hard Skills Nationwide
1. Includes only the 100 largest hard skills in occupations that require at least an Associate’s degree.
2. Excludes Heavy and Tractor-Trailer Truck Drivers.
IT
Health
Other

617.366.2838 www.GrayAssociates.com 35
GRAY For more information please contact Gray Associates. Email: [email protected]
New Job Postings: Ten Most Requested Certifications in the US1,2
Nationally, Certified RN was the the most requested certification.
§ Many of the most requested certifications were related to an Allied Health occupation. § Government Security Clearances are often among the top 10 certifications. § This month, accounting showed up twice in the list.
0 100,000 200,000 300,000 400,000 500,000
Certified Registered Nurse
Basic Life Support
Certification in Cardiopulmonary Resuscitation
Advanced Cardiac Life Support
Secret Clearance
Continuing Education
Accounting
Licensed Practical Nurse
Occupational Safety & Health Administration
Certified Public Accountant
Ten Most Requested Certifications in the US September-November 2016
1. Includes only the occupations that require at least an Associate’s degree.
2. Excludes Heavy and Tractor-Trailer Truck Drivers.
IT
Health
Other

617.366.2838 www.GrayAssociates.com 36
GRAY For more information please contact Gray Associates. Email: [email protected]
New Job Postings: Ten Fastest Growing Certifications in the US1,2
Like the 10 largest certifications, the fastest-growing certifications are generally from jobs in healthcare.
§ Accounting, new to the list, was the fastest growing certification. § Of the six new certifications on the fastest-growing list, five are outside of healthcare.
0% 10% 20% 30% 40% 50% 60% 70% 80% 90% 100%
Accounting
American Academy of Nurse Practitioners
Pharmacy Technician
Doctor of Pharmacy
American Nurses Credentialing Center
Certification in Ethics
Engineer-In-Training
Six Sigma Green Belt
Health Insurance Portability and Accountability Act -
EPA certification
Ten Fastest-Growing Certifications Nationally September-November 2016
1. Includes only the 100 largest certifications in occupations that require at least an Associate’s degree.
2. Excludes Heavy and Tractor-Trailer Truck Drivers.
IT
Health
Other

617.366.2838 www.GrayAssociates.com 37
GRAY For more information please contact Gray Associates. Email: [email protected]
Agenda
1. Inquiry and Conversion Trends:
1. National
2. Online and On-Campus
3. Degree and Channel
2. Integrated View of Student and Employer Demand:
1. City and Program
2. Job Postings Trends
3. New Ed – Inform to Empower
4. Summary

617.366.2838 www.GrayAssociates.com 38
GRAY For more information please contact Gray Associates. Email: [email protected]
Key Demand Trends and Observations
§ Overall, inquiries continue to fall 8-9%. ─ Branded inquiries are rising ─ Which is offset by a large decline in PPI ─ Big programs and big cities are leading the decline.
§ Inquiries and conversions for online programs are growing. § Inquiry growth for graduate programs has reversed. § Job postings for all degree levels are up – except for Bachelor’s degrees. § Health care and IT dominate the growth in job postings.
─ Accounting is also doing well. ─ Quality is a large, persistent theme in job postings.

617.366.2838 www.GrayAssociates.com 39
GRAY For more information please contact Gray Associates. Email: [email protected]
Strategies for Developing New Academic Programs: January 18 -20, 2017 – San Diego, CA
Gray will be presenting at the AI conference in San Diego on January 18-20.
Learn the art and science of selecting new academic programs. You will walk through a set of criteria that should guide your decisions on which programs to Start. You will leave this event better able to assess the potential for a new academic program, including:
§ Fit with your institutional mission and goals § Operational feasibility given your capacity and resources § Prospective student enrollment § Internal support to get it up and running § Profitability and impact resulting from failure
For more information, please visit:
www.AcademicImpressions.com
Strategies for Developing New Academic Programs January 18-20, San Diego, CA

617.366.2838 www.GrayAssociates.com 40
GRAY For more information please contact Gray Associates. Email: [email protected]
Questions and Contacts
Please feel free to contact:
Bob Atkins CEO
Gray Associates, Inc.
[email protected] @Gray_Associates
617.366.2836

617.366.2838 www.GrayAssociates.com 41
GRAY For more information please contact Gray Associates. Email: [email protected]
Upcoming Gray Associates’ Webcast
Please join us next month!
January Webcast (December Results)
Thursday, January 26th at 2:00 PM EDT