2017 october grayreports - demand trends for higher education
TRANSCRIPT

GRAYREPORTSDemand for Higher Education Programs
www.GrayAssociates.com
Results through October 2017
617.366.2838 www.GrayAssociates.com 2
GRAY For more information please contact Gray Associates.
Email: [email protected]
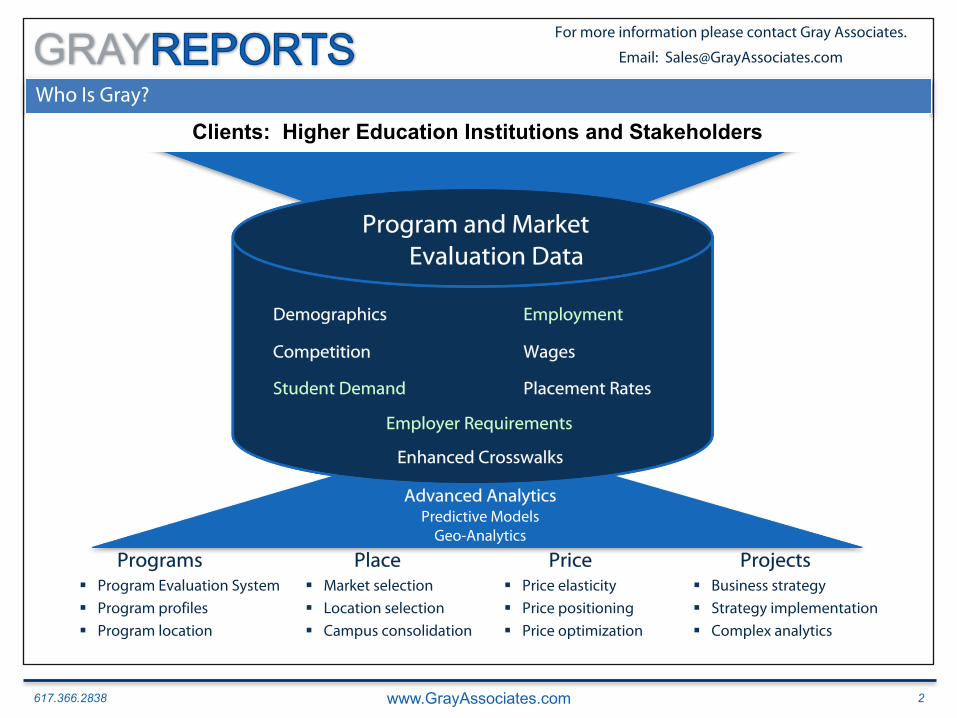
Who Is Gray?
Program and Market Evaluation Data
Employment
Placement RatesStudent Demand
Demographics
Wages
Programs Price ProjectsPlace§ Program Evaluation System
§ Program profiles
§ Program location
§ Market selection
§ Location selection
§ Campus consolidation
§ Price elasticity
§ Price positioning
§ Price optimization
§ Business strategy
§ Strategy implementation
§ Complex analytics
Advanced AnalyticsPredictive Models
Geo-Analytics
Clients: Higher Education Institutions and Stakeholders
Competition
Enhanced Crosswalks
Employer Requirements
617.366.2838 www.GrayAssociates.com 3
GRAY For more information please contact Gray Associates.
Email: [email protected]
Agenda
1. Student Demand Trends: Inquiries, Conversions, and Searches
1. National
2. Online and On-Campus
3. Degree Level
4. City and Program
2. Emerging Programs
3. Program of the Month: Human Services
4. Summary
617.366.2838 www.GrayAssociates.com 4
GRAY For more information please contact Gray Associates.
Email: [email protected]
0
100,000
200,000
300,000
400,000
500,000
600,000
700,000
800,000
900,000
1,000,000
Jan Feb Mar Apr May Jun Jul Aug Sep Oct Nov Dec
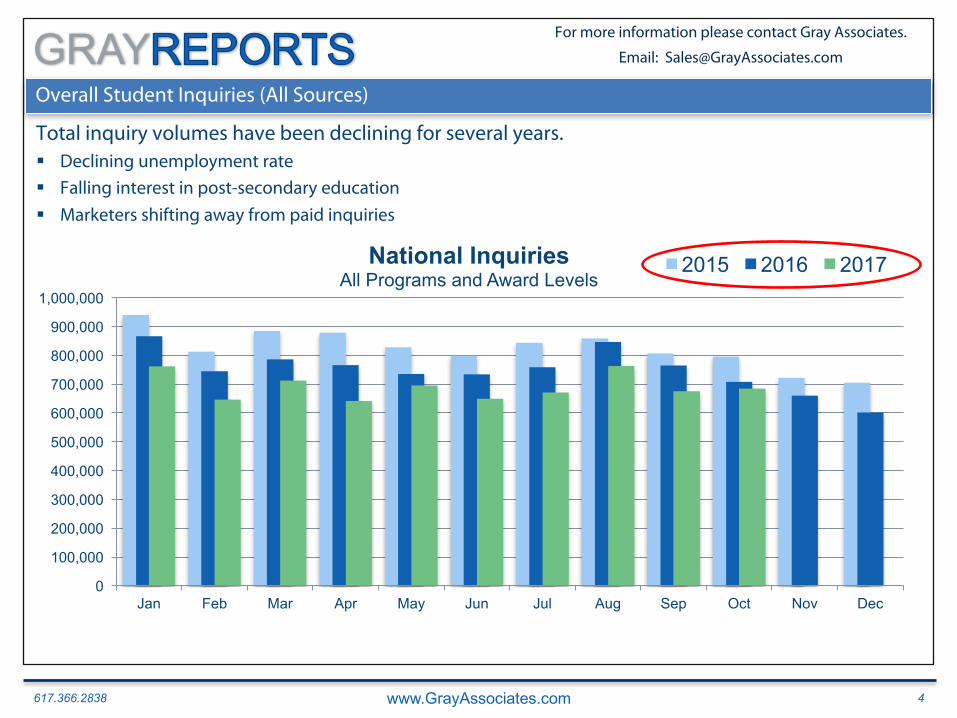
National InquiriesAll Programs and Award Levels
2015 2016 2017
Overall Student Inquiries (All Sources)
Total inquiry volumes have been declining for several years.§ Declining unemployment rate
§ Falling interest in post-secondary education
§ Marketers shifting away from paid inquiries
617.366.2838 www.GrayAssociates.com 5
GRAY For more information please contact Gray Associates.
Email: [email protected]
0
100,000
200,000
300,000
400,000
500,000
600,000
700,000
800,000
900,000
1,000,000
Jan Feb Mar Apr May Jun Jul Aug Sep Oct Nov Dec
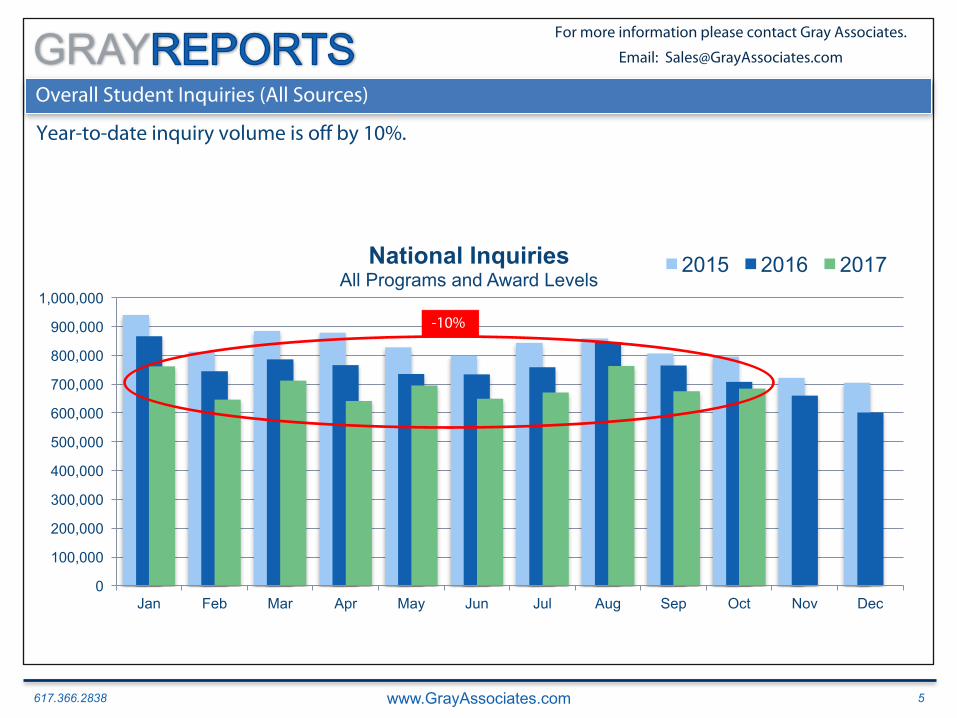
National InquiriesAll Programs and Award Levels
2015 2016 2017
Overall Student Inquiries (All Sources)
Year-to-date inquiry volume is off by 10%.
-10%
617.366.2838 www.GrayAssociates.com 6
GRAY For more information please contact Gray Associates.
Email: [email protected]
0
100,000
200,000
300,000
400,000
500,000
600,000
700,000
800,000
900,000
1,000,000
Jan Feb Mar Apr May Jun Jul Aug Sep Oct Nov Dec
National InquiriesAll Programs and Award Levels
2015 2016 2017
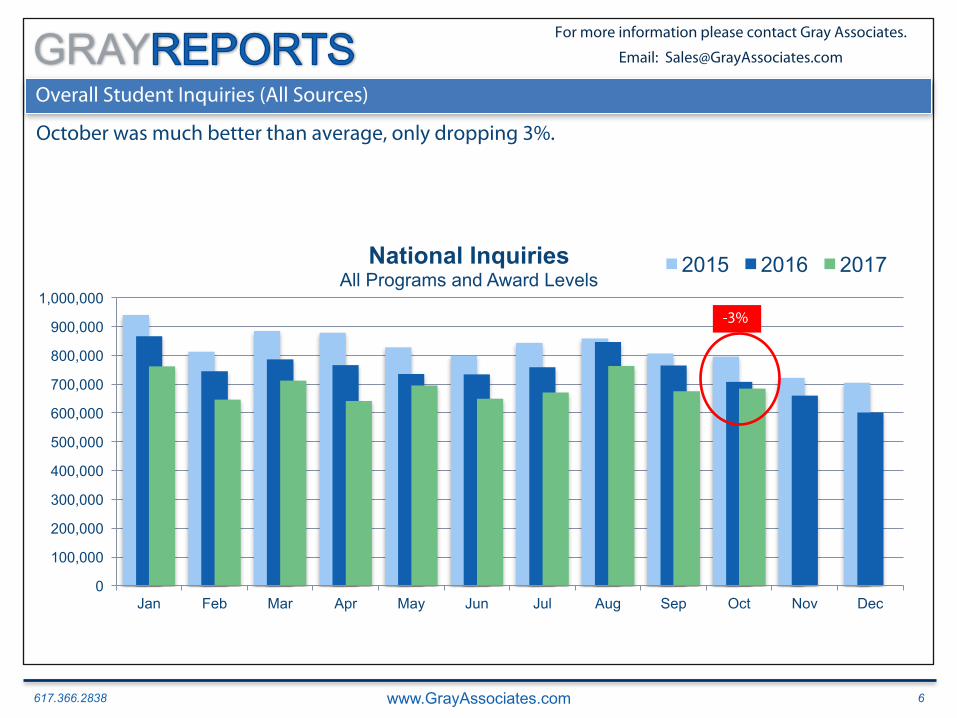
Overall Student Inquiries (All Sources)
October was much better than average, only dropping 3%.
-3%
617.366.2838 www.GrayAssociates.com 7
GRAY For more information please contact Gray Associates.
Email: [email protected]
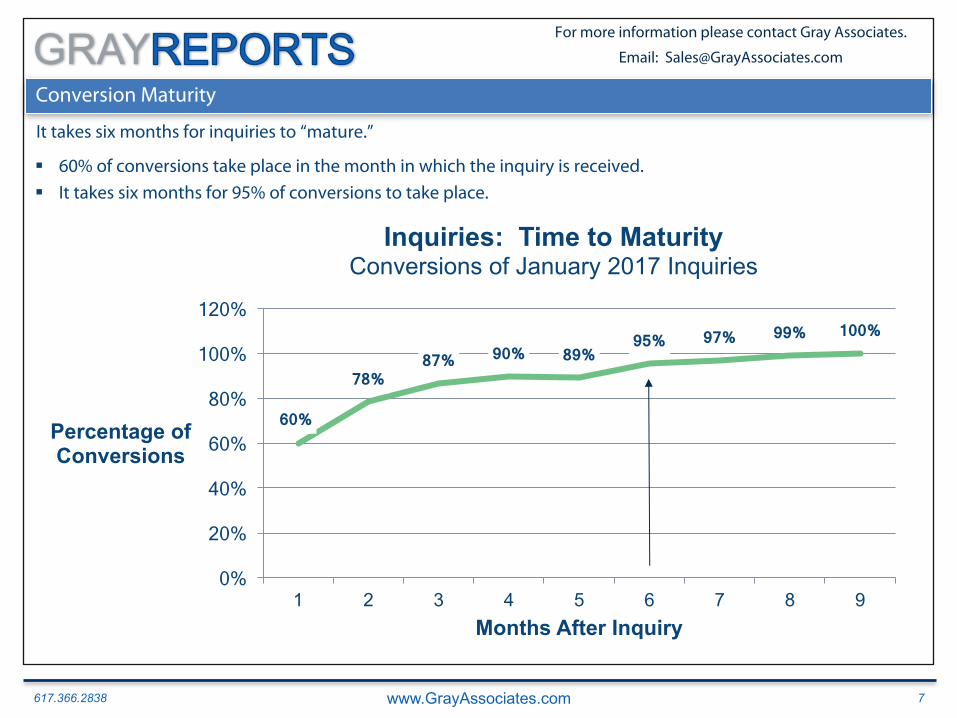
Conversion Maturity
It takes six months for inquiries to “mature.”
§ 60% of conversions take place in the month in which the inquiry is received.
§ It takes six months for 95% of conversions to take place.
-40% -35% -30% -25% -20% -15% -10% -5% 0% 5%
10%
Month 1 January
Month 2 February
Month 3 March
Month 4 April
Month 5 May
Month 6 June
Month 7 July
Month 8 August
Month 9 September
Conversion of 2017 January InquiriesVersus 2016 January Conversions
60%
78% 87% 90% 89%
95% 97% 99% 100%
0%
20%
40%
60%
80%
100%
120%
1 2 3 4 5 6 7 8 9
Percentage of Conversions
Months After Inquiry
Inquiries: Time to MaturityConversions of January 2017 Inquiries
617.366.2838 www.GrayAssociates.com 8
GRAY For more information please contact Gray Associates.
Email: [email protected]
80
90
100
110
120
130
140
150
Q1 2014
Q2 2014
Q3 2014
Q4 2014
Q1 2015
Q2 2015
Q3 2015
Q4 2015
Q1 2016
Q2 2016
Q3 2016
Q4 2016
Q1 2017
Q2 2017
Q3 2017
Overall Inquiry Conversion Rates: Trends(Indexed to Q1 2014)
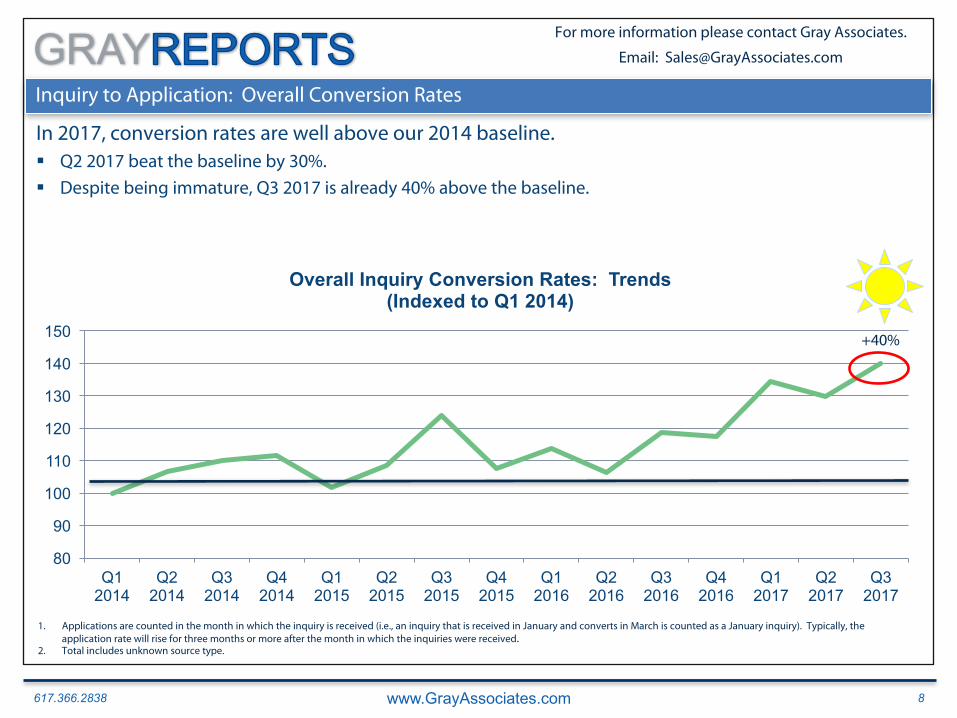
Inquiry to Application: Overall Conversion Rates
In 2017, conversion rates are well above our 2014 baseline.§ Q2 2017 beat the baseline by 30%.
§ Despite being immature, Q3 2017 is already 40% above the baseline.
1. Applications are counted in the month in which the inquiry is received (i.e., an inquiry that is received in January and converts in March is counted as a January inquiry). Typically, the application rate will rise for three months or more after the month in which the inquiries were received.
2. Total includes unknown source type.
+40%
617.366.2838 www.GrayAssociates.com 9
GRAY For more information please contact Gray Associates.
Email: [email protected]
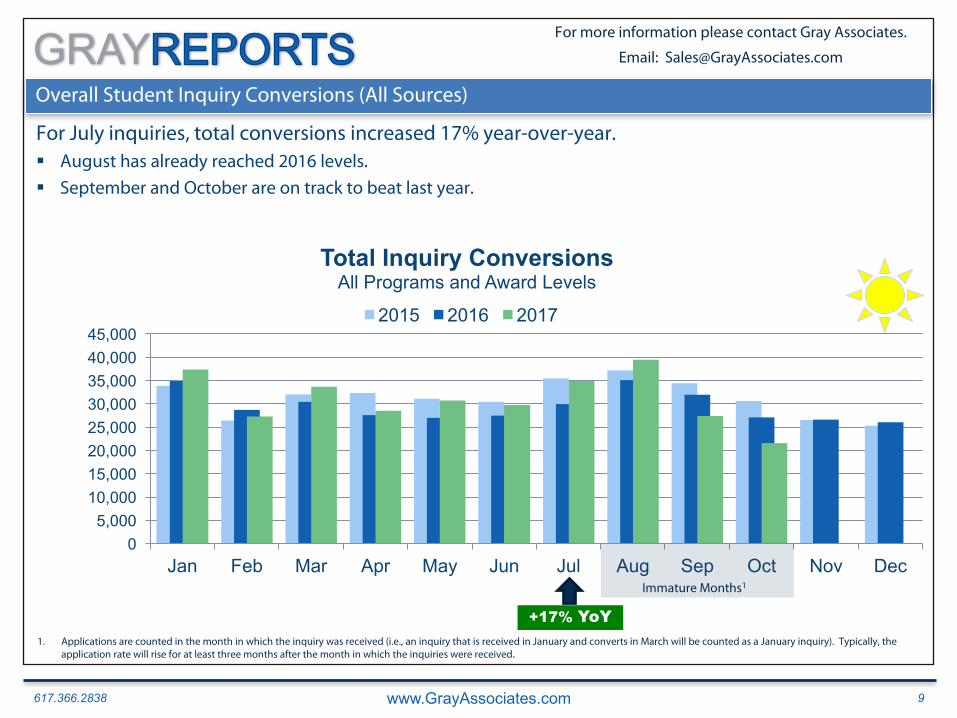
Overall Student Inquiry Conversions (All Sources)
For July inquiries, total conversions increased 17% year-over-year.§ August has already reached 2016 levels.
§ September and October are on track to beat last year.
1. Applications are counted in the month in which the inquiry was received (i.e., an inquiry that is received in January and converts in March will be counted as a January inquiry). Typically, the application rate will rise for at least three months after the month in which the inquiries were received.
05,000
10,00015,00020,00025,00030,00035,00040,00045,000
Jan Feb Mar Apr May Jun Jul Aug Sep Oct Nov Dec
Total Inquiry ConversionsAll Programs and Award Levels
2015 2016 2017
+17% YoY
Immature Months1
617.366.2838 www.GrayAssociates.com 10
GRAY For more information please contact Gray Associates.
Email: [email protected]
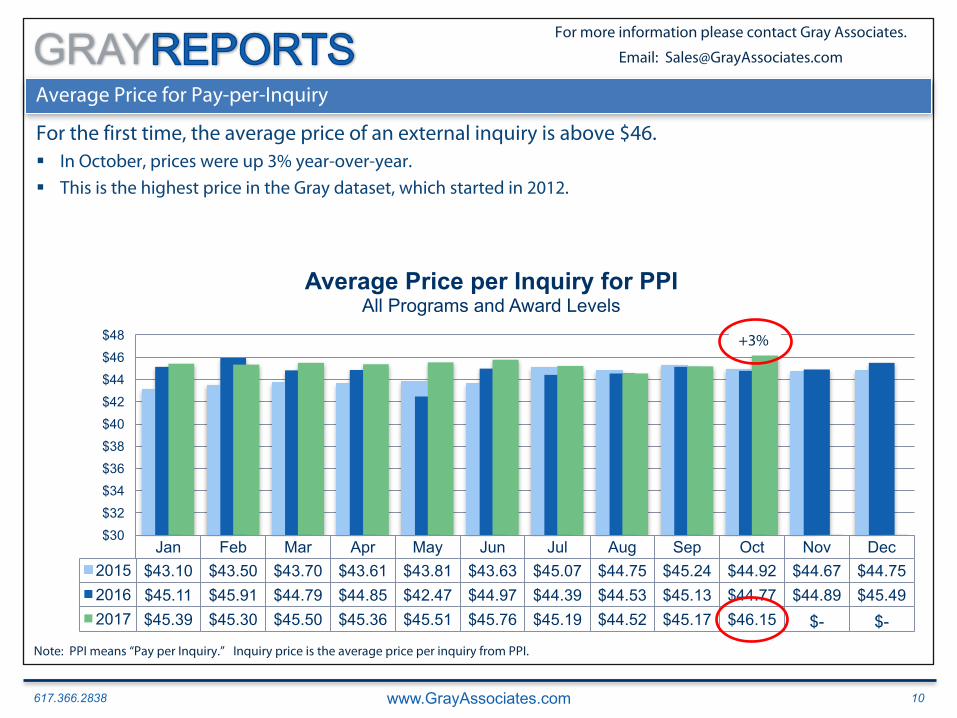
Jan Feb Mar Apr May Jun Jul Aug Sep Oct Nov Dec2015 $43.10 $43.50 $43.70 $43.61 $43.81 $43.63 $45.07 $44.75 $45.24 $44.92 $44.67 $44.752016 $45.11 $45.91 $44.79 $44.85 $42.47 $44.97 $44.39 $44.53 $45.13 $44.77 $44.89 $45.492017 $45.39 $45.30 $45.50 $45.36 $45.51 $45.76 $45.19 $44.52 $45.17 $46.15 $- $-
$30$32$34$36$38$40$42$44$46$48
Average Price per Inquiry for PPIAll Programs and Award Levels
Average Price for Pay-per-Inquiry
For the first time, the average price of an external inquiry is above $46.§ In October, prices were up 3% year-over-year.
§ This is the highest price in the Gray dataset, which started in 2012.
Note: PPI means “Pay per Inquiry.” Inquiry price is the average price per inquiry from PPI.
+3%
617.366.2838 www.GrayAssociates.com 11
GRAY For more information please contact Gray Associates.
Email: [email protected]
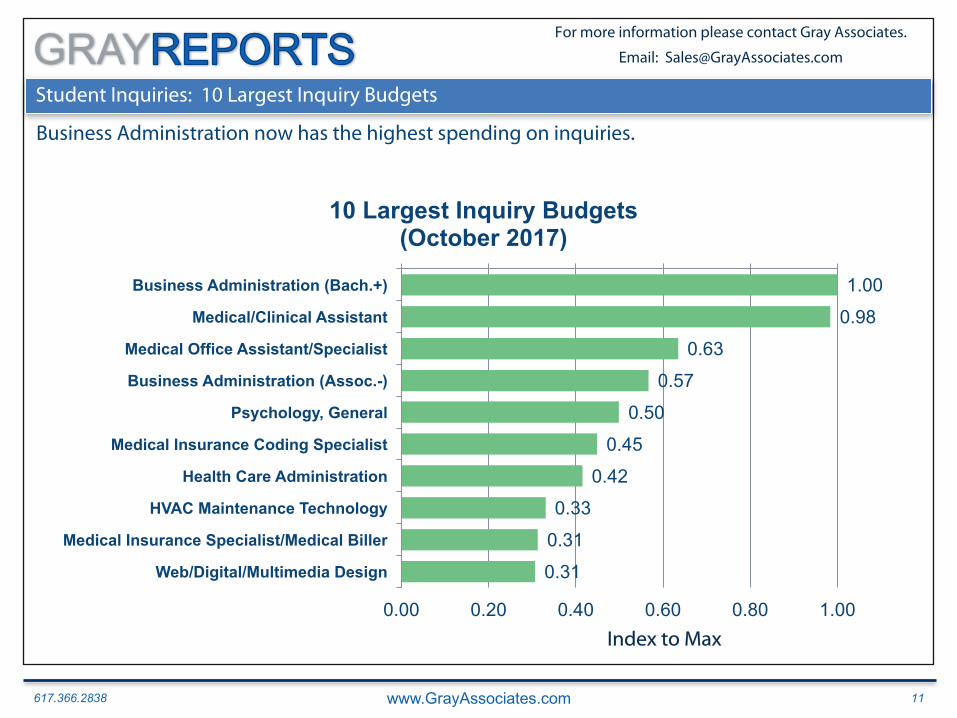
Student Inquiries: 10 Largest Inquiry Budgets
1.00
0.98
0.63
0.57
0.50
0.45
0.42
0.33
0.31
0.31
0.00 0.20 0.40 0.60 0.80 1.00
Business Administration (Bach.+)
Medical/Clinical Assistant
Medical Office Assistant/Specialist
Business Administration (Assoc.-)
Psychology, General
Medical Insurance Coding Specialist
Health Care Administration
HVAC Maintenance Technology
Medical Insurance Specialist/Medical Biller
Web/Digital/Multimedia Design
10 Largest Inquiry Budgets(October 2017)
Business Administration now has the highest spending on inquiries.
Index to Max
617.366.2838 www.GrayAssociates.com 12
GRAY For more information please contact Gray Associates.
Email: [email protected]
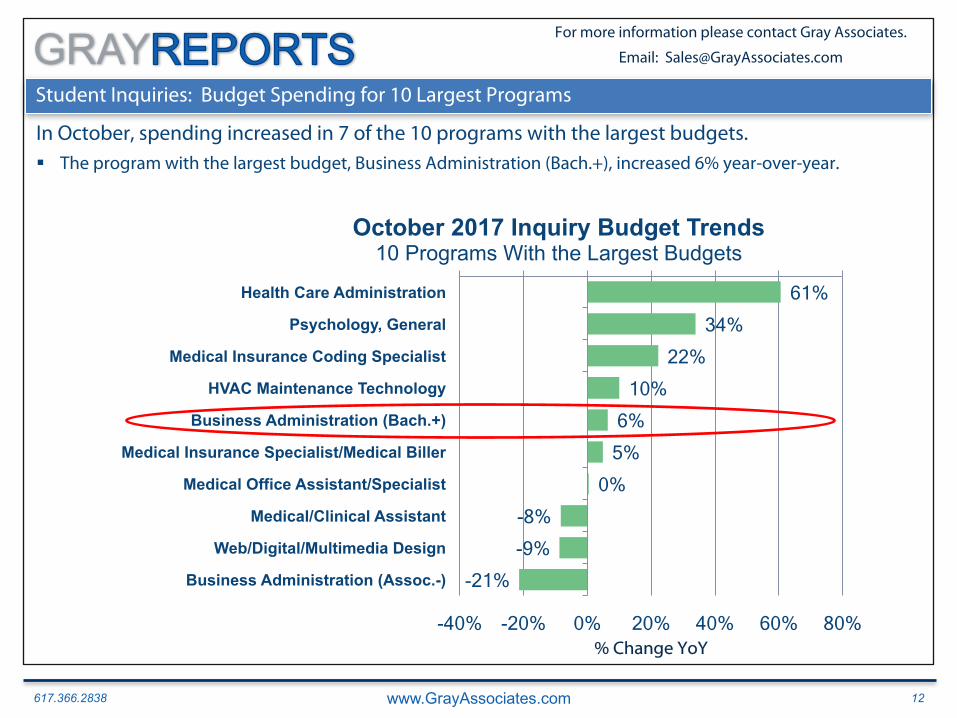
Student Inquiries: Budget Spending for 10 Largest Programs
61% 34%
22% 10%
6% 5%
0% -8% -9%
-21%
-40% -20% 0% 20% 40% 60% 80%
Health Care Administration
Psychology, General
Medical Insurance Coding Specialist
HVAC Maintenance Technology
Business Administration (Bach.+)
Medical Insurance Specialist/Medical Biller
Medical Office Assistant/Specialist
Medical/Clinical Assistant
Web/Digital/Multimedia Design
Business Administration (Assoc.-)
October 2017 Inquiry Budget Trends10 Programs With the Largest Budgets
§ The program with the largest budget, Business Administration (Bach.+), increased 6% year-over-year.
In October, spending increased in 7 of the 10 programs with the largest budgets.
% Change YoY
617.366.2838 www.GrayAssociates.com 13
GRAY For more information please contact Gray Associates.
Email: [email protected]
Agenda
1. Student Demand Trends: Inquiries, Conversions, and Searches
1. National
2. Online and On-Campus
3. Degree Level
4. City and Program
2. Emerging Programs
3. Program of the Month: Human Services
4. Summary
617.366.2838 www.GrayAssociates.com 14
GRAY For more information please contact Gray Associates.
Email: [email protected]
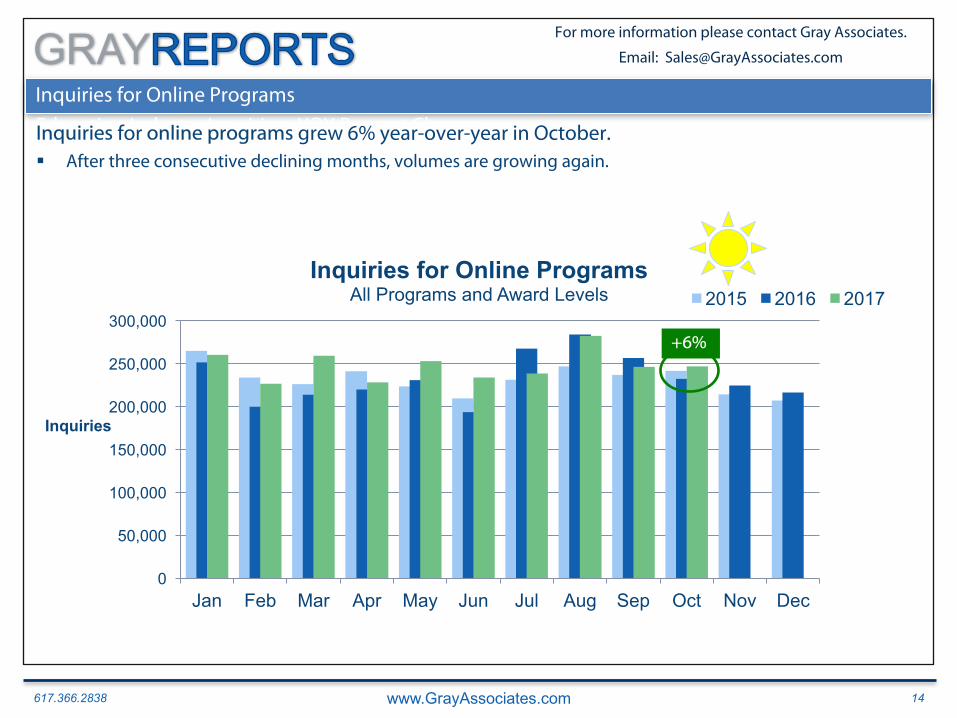
Inquiries for Online Programs
Education Industry Inquiries: YOY Percent ChangeInquiries for online programs grew 6% year-over-year in October.§ After three consecutive declining months, volumes are growing again.
0
50,000
100,000
150,000
200,000
250,000
300,000
Jan Feb Mar Apr May Jun Jul Aug Sep Oct Nov Dec
Inquiries
Inquiries for Online ProgramsAll Programs and Award Levels 2015 2016 2017
+6%
617.366.2838 www.GrayAssociates.com 15
GRAY For more information please contact Gray Associates.
Email: [email protected]
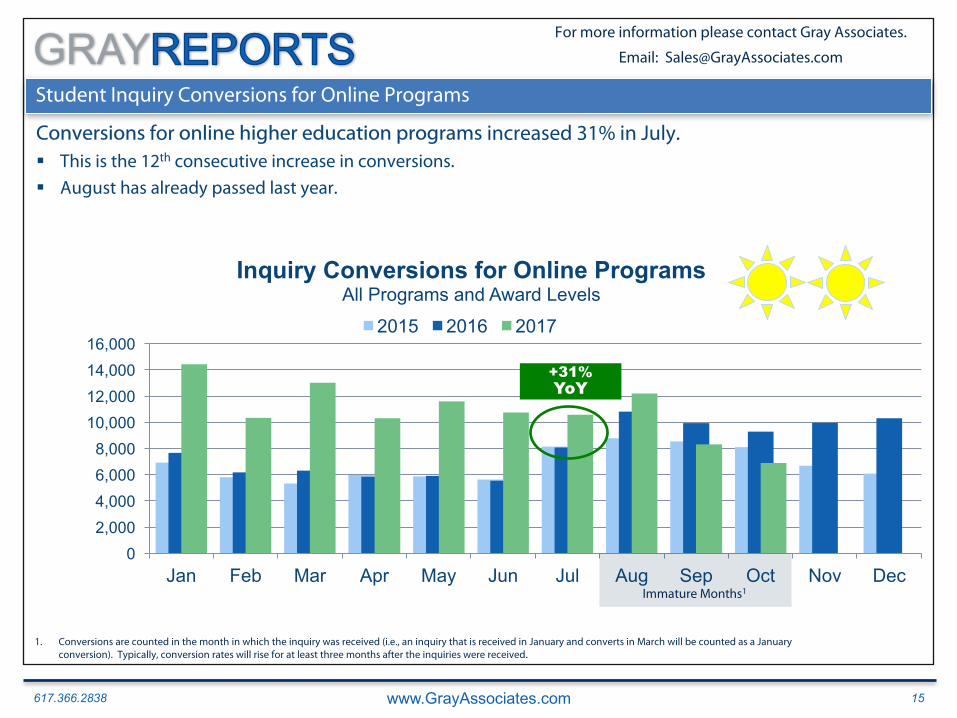
Student Inquiry Conversions for Online Programs
Conversions for online higher education programs increased 31% in July.§ This is the 12th consecutive increase in conversions.
§ August has already passed last year.
02,0004,0006,0008,000
10,00012,00014,00016,000
Jan Feb Mar Apr May Jun Jul Aug Sep Oct Nov Dec
Inquiry Conversions for Online ProgramsAll Programs and Award Levels
2015 2016 2017
1. Conversions are counted in the month in which the inquiry was received (i.e., an inquiry that is received in January and converts in March will be counted as a January conversion). Typically, conversion rates will rise for at least three months after the inquiries were received.
+31% YoY
Immature Months1
617.366.2838 www.GrayAssociates.com 16
GRAY For more information please contact Gray Associates.
Email: [email protected]
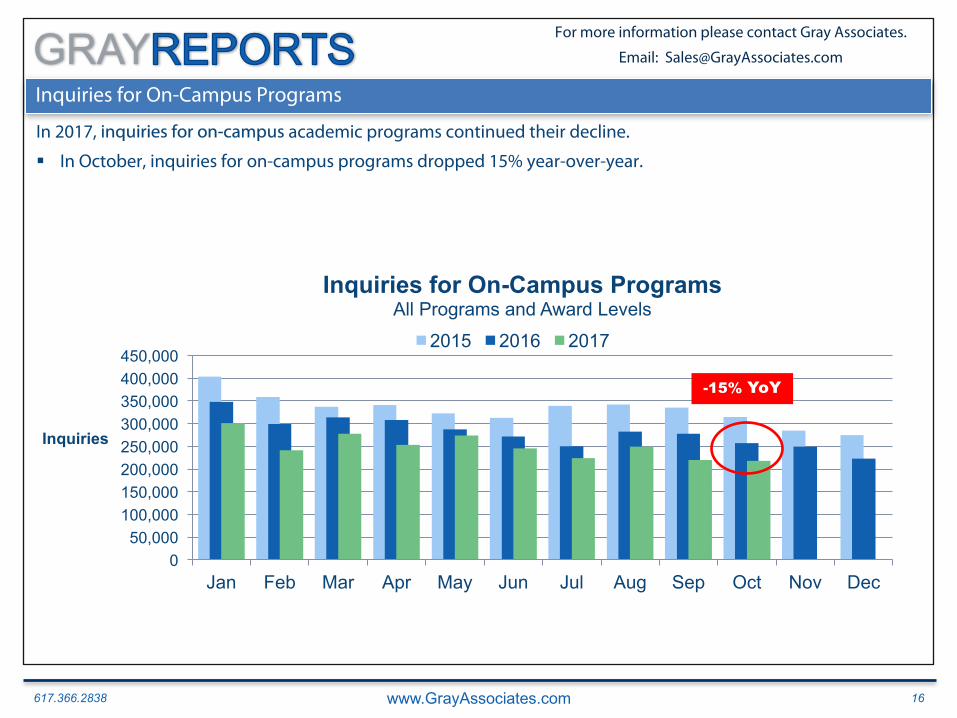
Inquiries for On-Campus Programs
In 2017, inquiries for on-campus academic programs continued their decline.
§ In October, inquiries for on-campus programs dropped 15% year-over-year.
2012
050,000
100,000150,000200,000250,000300,000350,000400,000450,000
Jan Feb Mar Apr May Jun Jul Aug Sep Oct Nov Dec
Inquiries
Inquiries for On-Campus ProgramsAll Programs and Award Levels
2015 2016 2017
-15% YoY
617.366.2838 www.GrayAssociates.com 17
GRAY For more information please contact Gray Associates.
Email: [email protected]
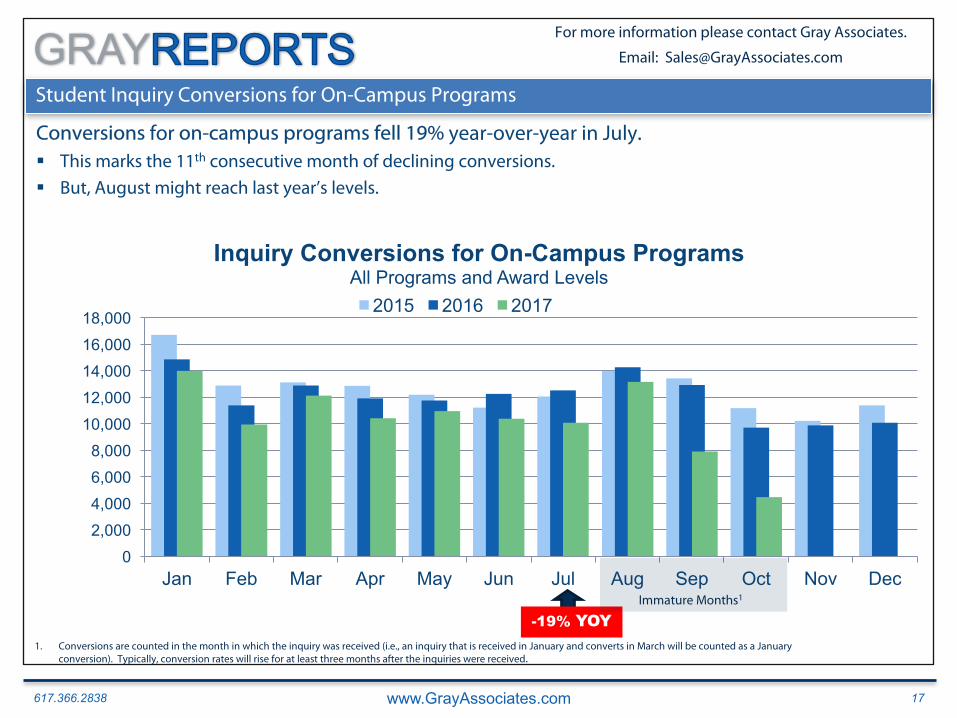
Student Inquiry Conversions for On-Campus Programs
Conversions for on-campus programs fell 19% year-over-year in July.§ This marks the 11th consecutive month of declining conversions.
§ But, August might reach last year’s levels.
02,0004,0006,0008,000
10,00012,00014,00016,00018,000
Jan Feb Mar Apr May Jun Jul Aug Sep Oct Nov Dec
Inquiry Conversions for On-Campus ProgramsAll Programs and Award Levels
2015 2016 2017
-19% YOY1. Conversions are counted in the month in which the inquiry was received (i.e., an inquiry that is received in January and converts in March will be counted as a January
conversion). Typically, conversion rates will rise for at least three months after the inquiries were received.
Immature Months1
617.366.2838 www.GrayAssociates.com 18
GRAY For more information please contact Gray Associates.
Email: [email protected]
Agenda
1. Student Demand Trends: Inquiries, Conversions, and Searches
1. National
2. Online and On-Campus
3. Degree Level
4. City and Program
2. Emerging Programs
3. Program of the Month: Human Services
4. Summary
617.366.2838 www.GrayAssociates.com 19
GRAY For more information please contact Gray Associates.
Email: [email protected]
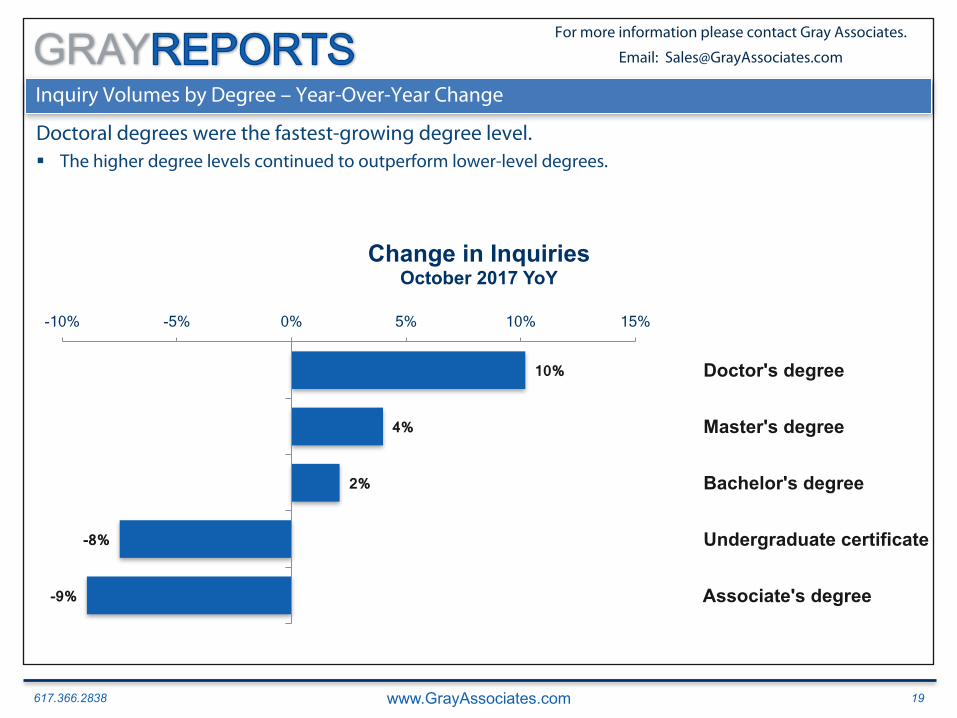
Inquiry Volumes by Degree – Year-Over-Year Change
Doctoral degrees were the fastest-growing degree level.§ The higher degree levels continued to outperform lower-level degrees.
-9%
-8%
2%
4%
10%
-10% -5% 0% 5% 10% 15%
Associate's degree
Undergraduate certificate
Bachelor's degree
Master's degree
Doctor's degree
Change in InquiriesOctober 2017 YoY
617.366.2838 www.GrayAssociates.com 20
GRAY For more information please contact Gray Associates.
Email: [email protected]
Agenda
1. Student Demand Trends: Inquiries, Conversions, and Searches
1. National
2. Online and On-Campus
3. Degree Level
4. City and Program
2. Emerging Programs
3. Program of the Month: Human Services
4. Summary
617.366.2838 www.GrayAssociates.com 21
GRAY For more information please contact Gray Associates.
Email: [email protected]
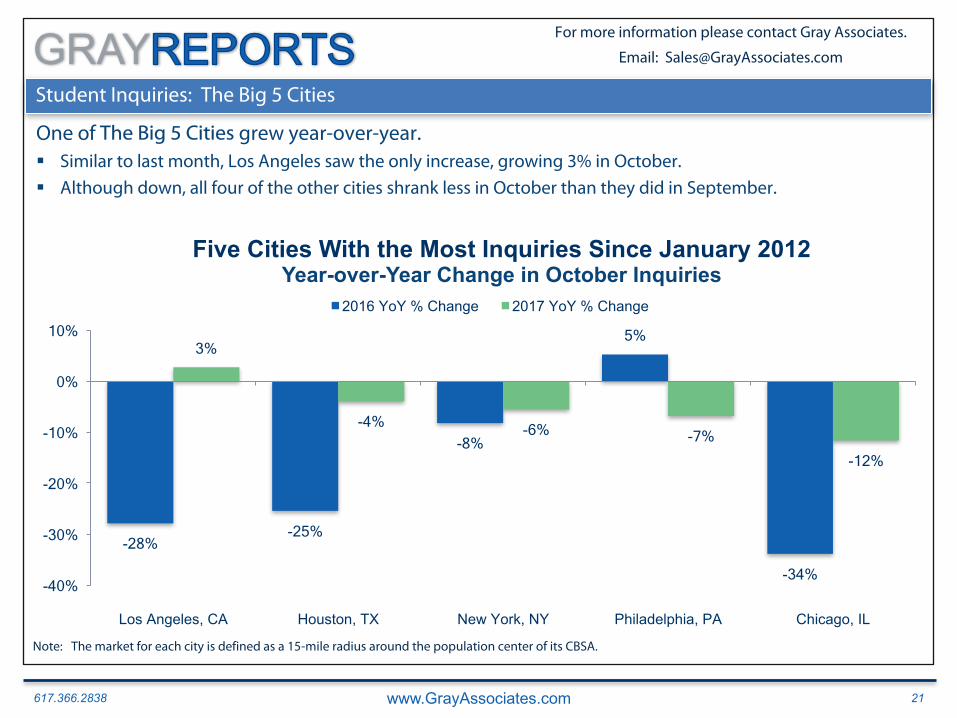
Student Inquiries: The Big 5 Cities
One of The Big 5 Cities grew year-over-year.§ Similar to last month, Los Angeles saw the only increase, growing 3% in October.
§ Although down, all four of the other cities shrank less in October than they did in September.
-28% -25%
-8%
5%
-34%
3%
-4% -6% -7% -12%
-40%
-30%
-20%
-10%
0%
10%
Los Angeles, CA Houston, TX New York, NY Philadelphia, PA Chicago, IL
Five Cities With the Most Inquiries Since January 2012Year-over-Year Change in October Inquiries
2016 YoY % Change 2017 YoY % Change
Note: The market for each city is defined as a 15-mile radius around the population center of its CBSA.
617.366.2838 www.GrayAssociates.com 22
GRAY For more information please contact Gray Associates.
Email: [email protected]
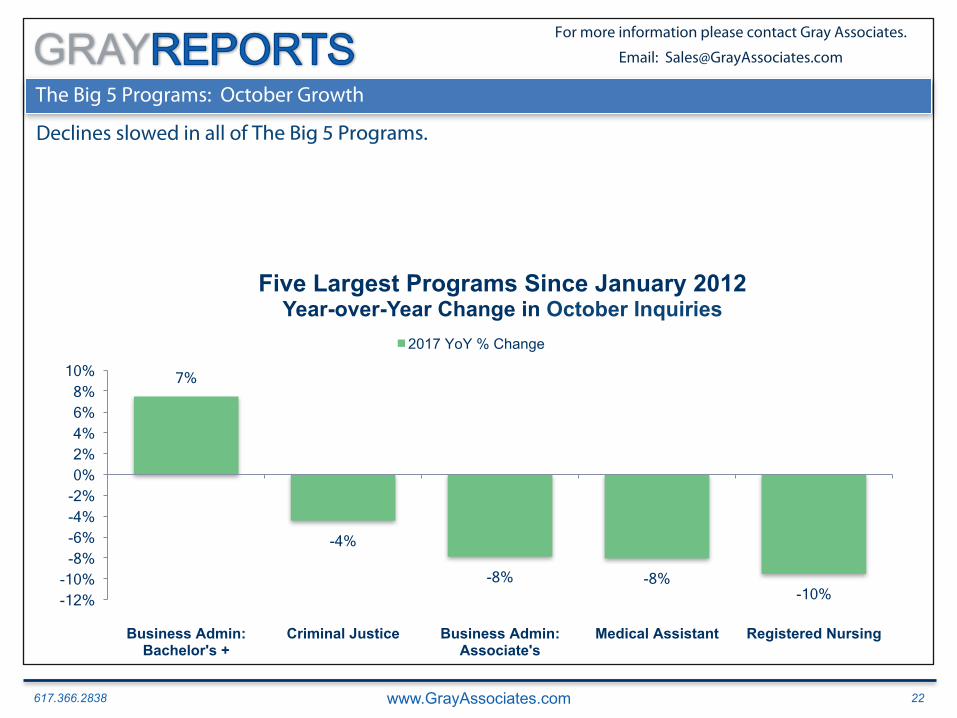
The Big 5 Programs: October Growth
Declines slowed in all of The Big 5 Programs.
7%
-4%
-8% -8% -10% -12%
-10% -8% -6% -4% -2% 0% 2% 4% 6% 8%
10%
Business Admin: Bachelor's +
Criminal Justice Business Admin: Associate's
Medical Assistant Registered Nursing
Five Largest Programs Since January 2012Year-over-Year Change in October Inquiries
2017 YoY % Change
617.366.2838 www.GrayAssociates.com 23
GRAY For more information please contact Gray Associates.
Email: [email protected]
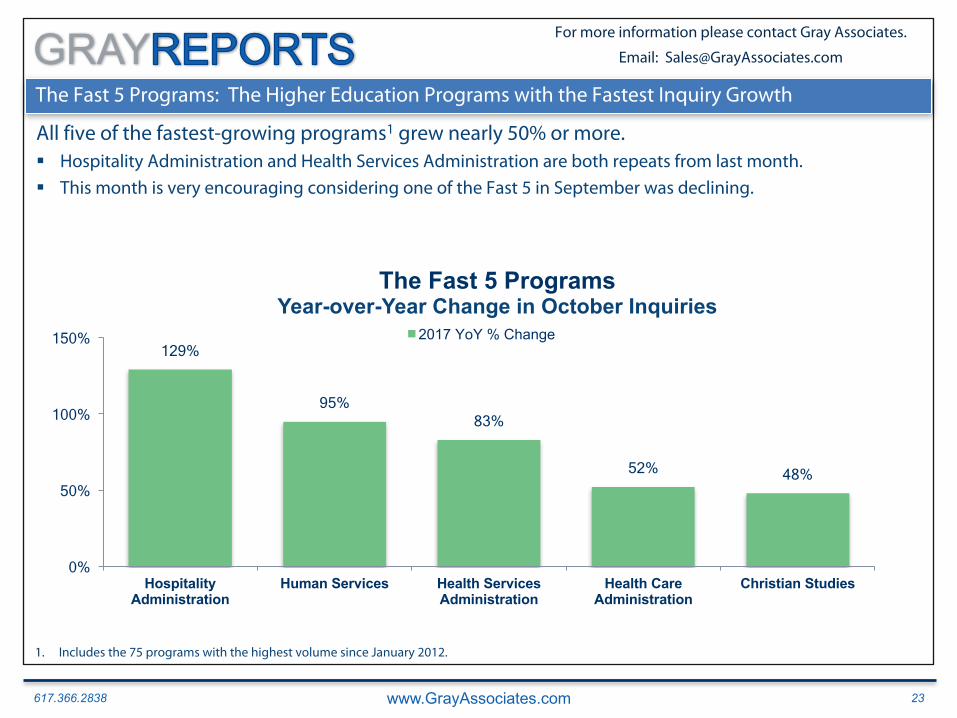
129%
95% 83%
52% 48%
0%
50%
100%
150%
Hospitality Administration
Human Services Health Services Administration
Health Care Administration
Christian Studies
The Fast 5 ProgramsYear-over-Year Change in October Inquiries
2017 YoY % Change
The Fast 5 Programs: The Higher Education Programs with the Fastest Inquiry Growth
All five of the fastest-growing programs1 grew nearly 50% or more.§ Hospitality Administration and Health Services Administration are both repeats from last month.
§ This month is very encouraging considering one of the Fast 5 in September was declining.
1. Includes the 75 programs with the highest volume since January 2012.
617.366.2838 www.GrayAssociates.com 24
GRAY For more information please contact Gray Associates.
Email: [email protected]
Agenda
1. Student Demand Trends: Inquiries, Conversions, and Searches
1. National
2. Online and On-Campus
3. Degree Level
4. City and Program
2. Emerging Programs
3. Program of the Month: Human Services
4. Summary
617.366.2838 www.GrayAssociates.com 25
GRAY For more information please contact Gray Associates.
Email: [email protected]
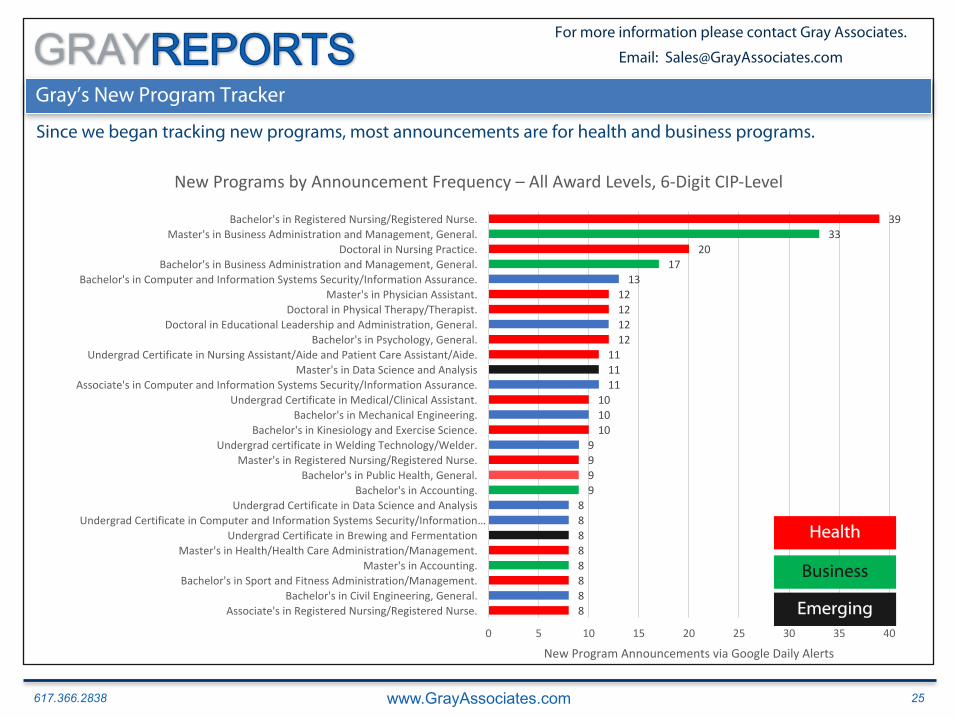
Gray’s New Program Tracker
Since we began tracking new programs, most announcements are for health and business programs.
8888888899991010101111111212121213
1720
3339
0 5 10 15 20 25 30 35 40
Associate'sinRegisteredNursing/RegisteredNurse.Bachelor'sinCivilEngineering,General.
Bachelor'sinSportandFitnessAdministration/Management.Master'sinAccounting.
Master'sinHealth/HealthCareAdministration/Management.UndergradCertificateinBrewingandFermentation
UndergradCertificateinComputerandInformationSystemsSecurity/Information…UndergradCertificateinDataScienceandAnalysis
Bachelor'sinAccounting.Bachelor'sinPublicHealth,General.
Master'sinRegisteredNursing/RegisteredNurse.UndergradcertificateinWeldingTechnology/Welder.
Bachelor'sinKinesiologyandExerciseScience.Bachelor'sinMechanicalEngineering.
UndergradCertificateinMedical/ClinicalAssistant.Associate'sinComputerandInformationSystemsSecurity/InformationAssurance.
Master'sinDataScienceandAnalysisUndergradCertificateinNursingAssistant/AideandPatientCareAssistant/Aide.
Bachelor'sinPsychology,General.DoctoralinEducationalLeadershipandAdministration,General.
DoctoralinPhysicalTherapy/Therapist.Master'sinPhysicianAssistant.
Bachelor'sinComputerandInformationSystemsSecurity/InformationAssurance.Bachelor'sinBusinessAdministrationandManagement,General.
DoctoralinNursingPractice.Master'sinBusinessAdministrationandManagement,General.
Bachelor'sinRegisteredNursing/RegisteredNurse.
NewProgramAnnouncementsviaGoogleDailyAlerts
NewProgramsbyAnnouncementFrequency– AllAwardLevels,6-DigitCIP-Level
Health
Business
Emerging
617.366.2838 www.GrayAssociates.com 26
GRAY For more information please contact Gray Associates.
Email: [email protected]
Agenda
1. Student Demand Trends: Inquiries, Conversions, and Searches
1. National
2. Online and On-Campus
3. Degree Level
4. City and Program
2. Emerging Programs
3. Program of the Month: Human Services
4. Summary
617.366.2838 www.GrayAssociates.com 27
GRAY For more information please contact Gray Associates.
Email: [email protected]
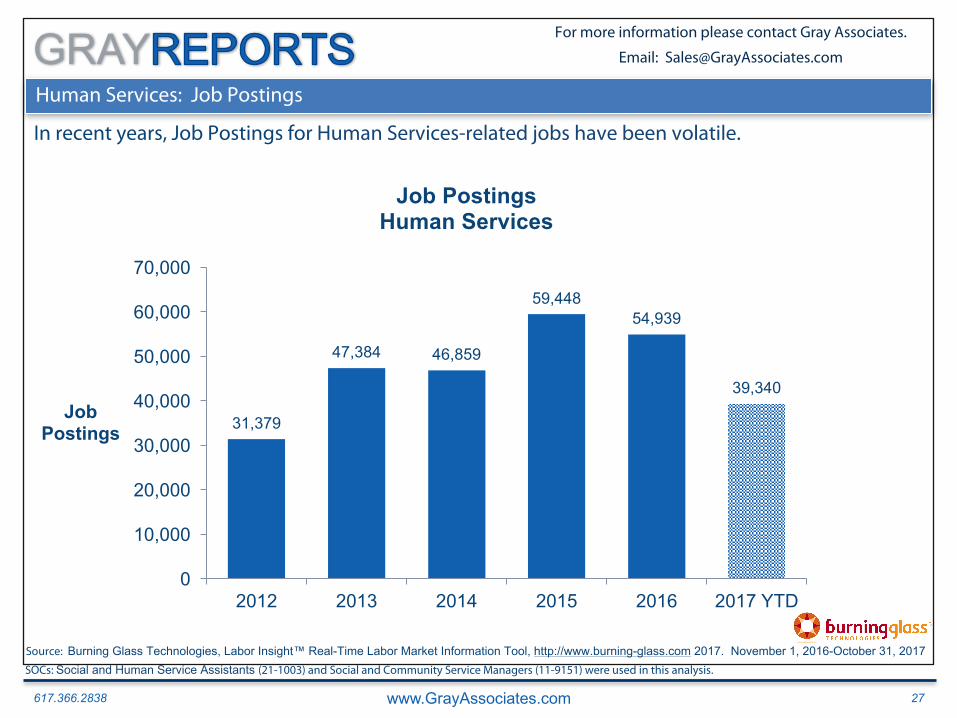
Human Services: Job Postings
In recent years, Job Postings for Human Services-related jobs have been volatile.
31,379
47,384 46,859
59,44854,939
39,340
0
10,000
20,000
30,000
40,000
50,000
60,000
70,000
2012 2013 2014 2015 2016 2017 YTD
Job Postings
Job PostingsHuman Services
Source: Burning Glass Technologies, Labor Insight™ Real-Time Labor Market Information Tool, http://www.burning-glass.com 2017. November 1, 2016-October 31, 2017SOCs: Social and Human Service Assistants (21-1003) and Social and Community Service Managers (11-9151) were used in this analysis.
617.366.2838 www.GrayAssociates.com 28
GRAY For more information please contact Gray Associates.
Email: [email protected]
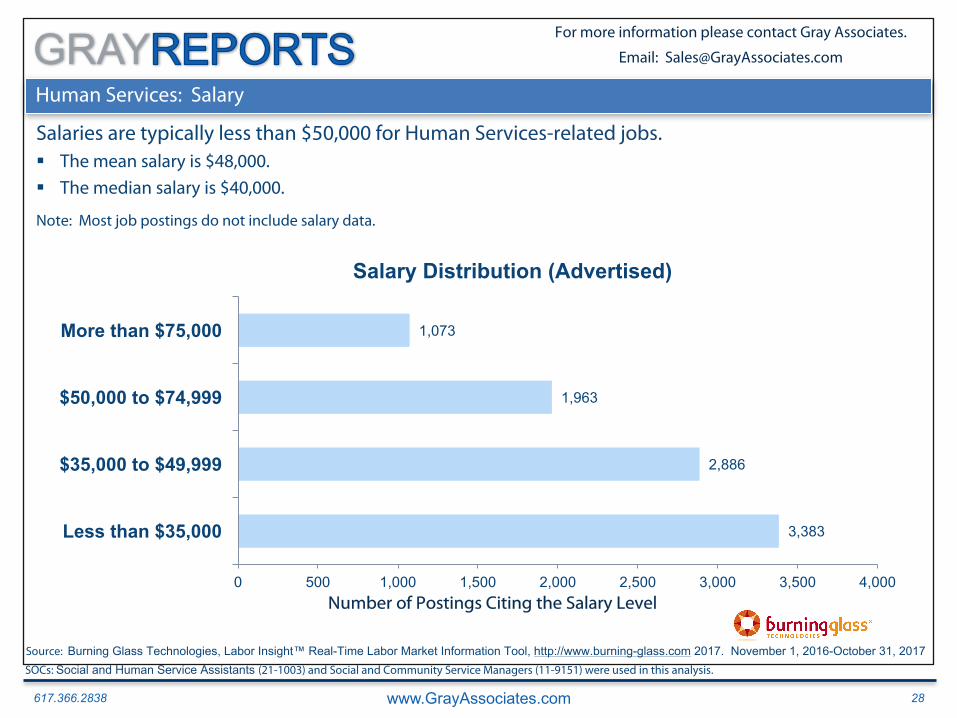
Human Services: Salary
Salaries are typically less than $50,000 for Human Services-related jobs.
3,383
2,886
1,963
1,073
0 500 1,000 1,500 2,000 2,500 3,000 3,500 4,000
Less than $35,000
$35,000 to $49,999
$50,000 to $74,999
More than $75,000
Salary Distribution (Advertised)
§ The mean salary is $48,000.
§ The median salary is $40,000.
Note: Most job postings do not include salary data.
Number of Postings Citing the Salary Level
Source: Burning Glass Technologies, Labor Insight™ Real-Time Labor Market Information Tool, http://www.burning-glass.com 2017. November 1, 2016-October 31, 2017SOCs: Social and Human Service Assistants (21-1003) and Social and Community Service Managers (11-9151) were used in this analysis.
617.366.2838 www.GrayAssociates.com 29
GRAY For more information please contact Gray Associates.
Email: [email protected]
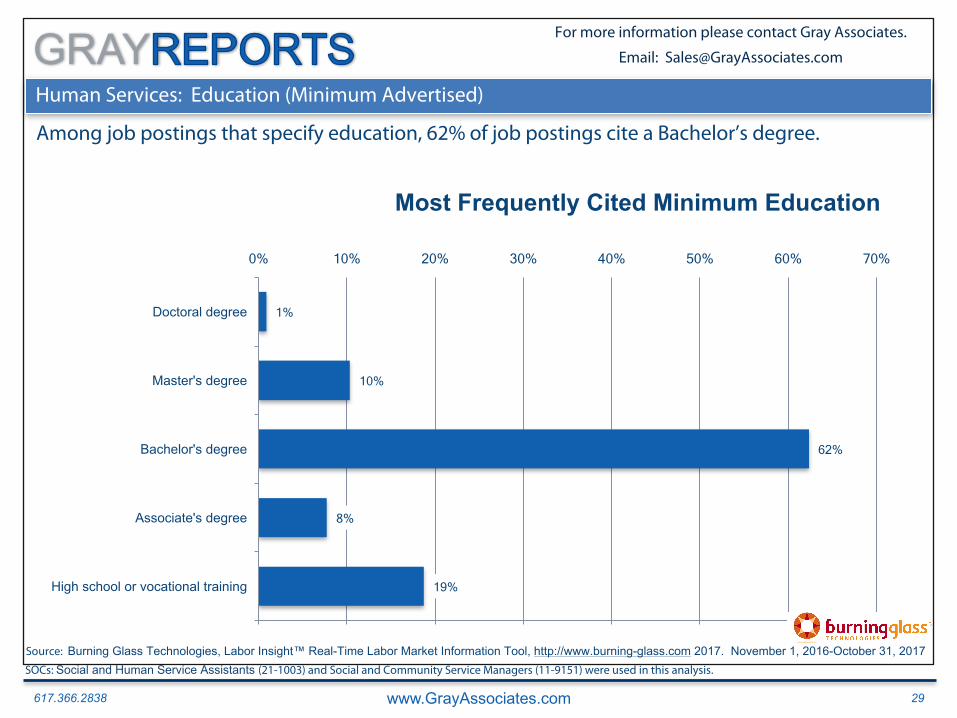
Human Services: Education (Minimum Advertised)
Among job postings that specify education, 62% of job postings cite a Bachelor’s degree.
19%
8%
62%
10%
1%
0% 10% 20% 30% 40% 50% 60% 70%
High school or vocational training
Associate's degree
Bachelor's degree
Master's degree
Doctoral degree
Most Frequently Cited Minimum Education
Source: Burning Glass Technologies, Labor Insight™ Real-Time Labor Market Information Tool, http://www.burning-glass.com 2017. November 1, 2016-October 31, 2017SOCs: Social and Human Service Assistants (21-1003) and Social and Community Service Managers (11-9151) were used in this analysis.
617.366.2838 www.GrayAssociates.com 30
GRAY For more information please contact Gray Associates.
Email: [email protected]
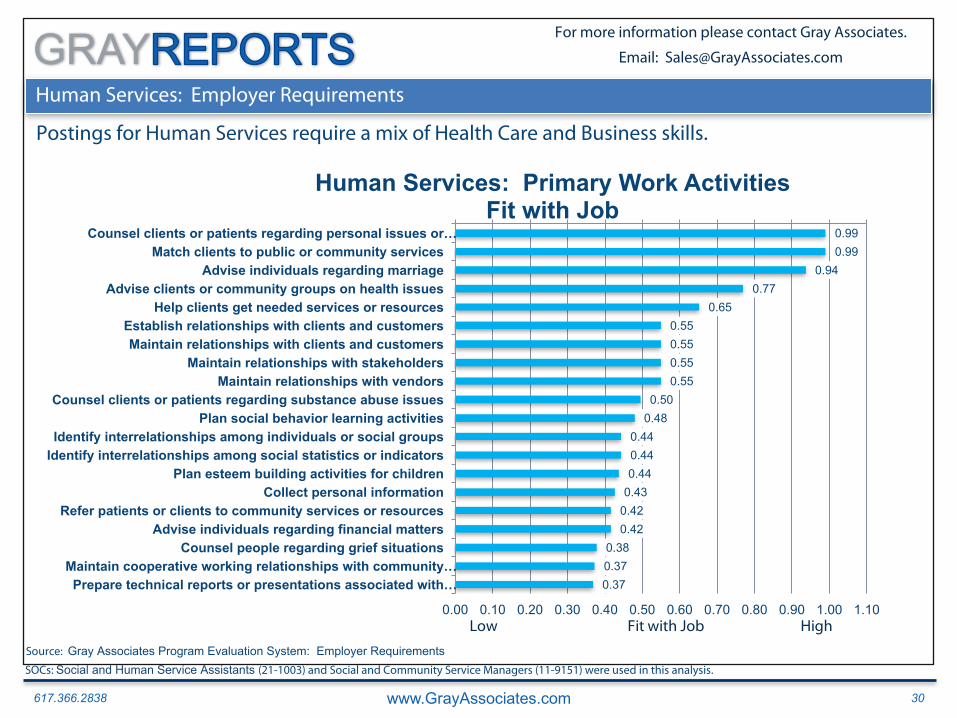
Human Services: Employer Requirements
Postings for Human Services require a mix of Health Care and Business skills.
0.990.99
0.940.77
0.650.550.550.550.55
0.500.48
0.440.440.44
0.430.420.42
0.380.370.37
0.00 0.10 0.20 0.30 0.40 0.50 0.60 0.70 0.80 0.90 1.00 1.10
Counsel clients or patients regarding personal issues or …Match clients to public or community services
Advise individuals regarding marriageAdvise clients or community groups on health issues
Help clients get needed services or resourcesEstablish relationships with clients and customersMaintain relationships with clients and customers
Maintain relationships with stakeholdersMaintain relationships with vendors
Counsel clients or patients regarding substance abuse issuesPlan social behavior learning activities
Identify interrelationships among individuals or social groupsIdentify interrelationships among social statistics or indicators
Plan esteem building activities for childrenCollect personal information
Refer patients or clients to community services or resourcesAdvise individuals regarding financial matters
Counsel people regarding grief situationsMaintain cooperative working relationships with community …Prepare technical reports or presentations associated with …
Human Services: Primary Work ActivitiesFit with Job
Source: Gray Associates Program Evaluation System: Employer RequirementsSOCs: Social and Human Service Assistants (21-1003) and Social and Community Service Managers (11-9151) were used in this analysis.
Low Fit with Job High
617.366.2838 www.GrayAssociates.com 31
GRAY For more information please contact Gray Associates.
Email: [email protected]
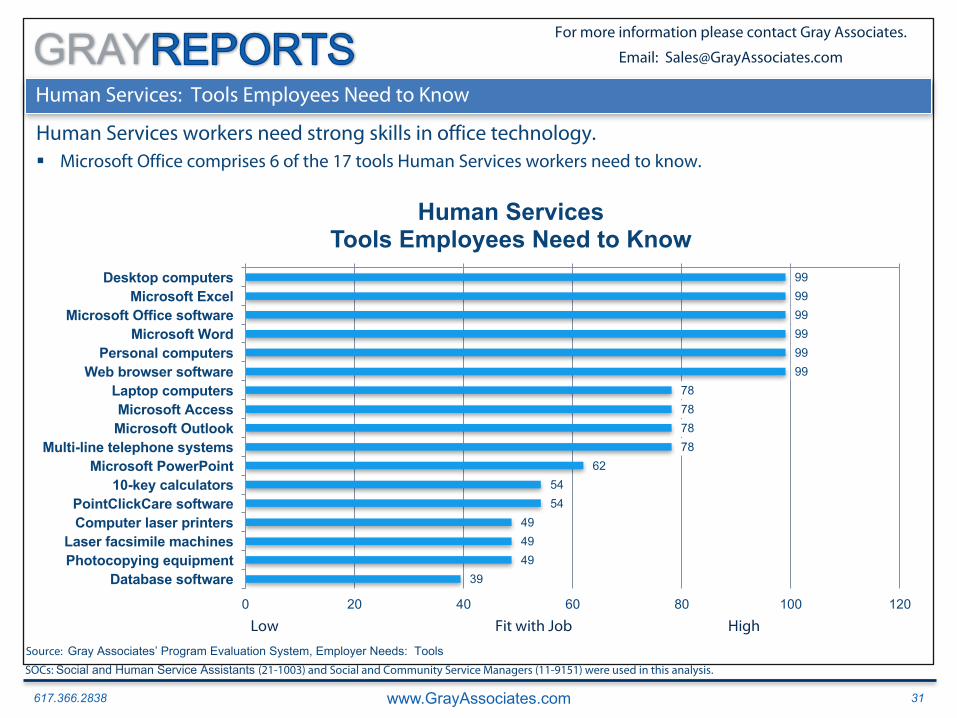
Human Services: Tools Employees Need to Know
Human Services workers need strong skills in office technology. § Microsoft Office comprises 6 of the 17 tools Human Services workers need to know.
999999999999
78787878
625454
494949
39
0 20 40 60 80 100 120
Desktop computersMicrosoft Excel
Microsoft Office softwareMicrosoft Word
Personal computersWeb browser software
Laptop computersMicrosoft AccessMicrosoft Outlook
Multi-line telephone systemsMicrosoft PowerPoint
10-key calculatorsPointClickCare softwareComputer laser printers
Laser facsimile machinesPhotocopying equipment
Database software
Human ServicesTools Employees Need to Know
Source: Gray Associates’ Program Evaluation System, Employer Needs: ToolsSOCs: Social and Human Service Assistants (21-1003) and Social and Community Service Managers (11-9151) were used in this analysis.
Low Fit with Job High
617.366.2838 www.GrayAssociates.com 32
GRAY For more information please contact Gray Associates.
Email: [email protected]
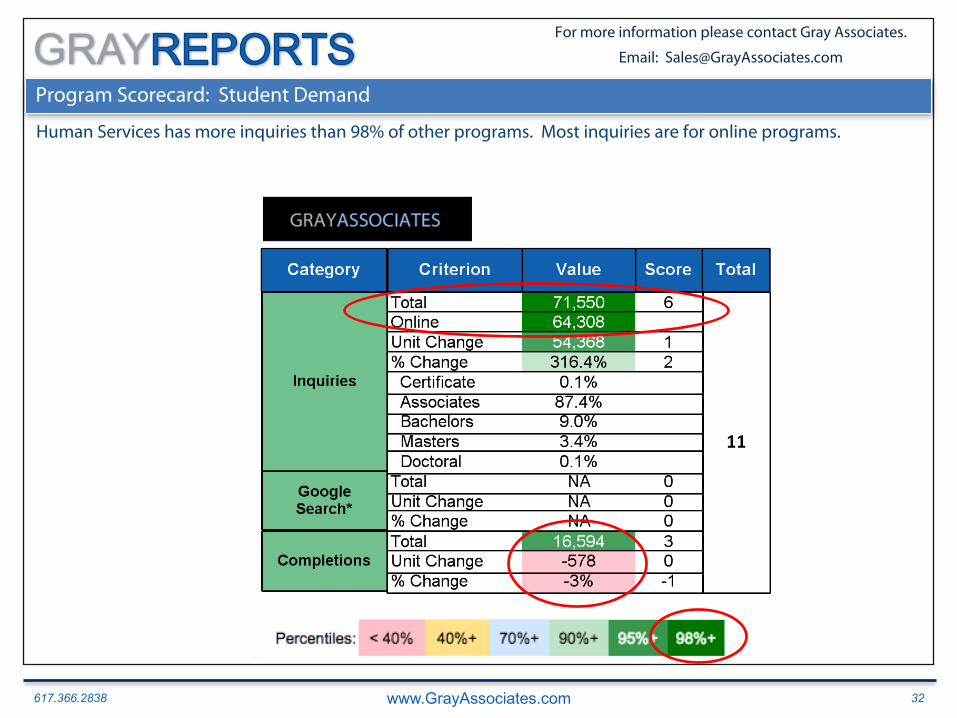
Program Scorecard: Student Demand
Human Services has more inquiries than 98% of other programs. Most inquiries are for online programs.

617.366.2838 www.GrayAssociates.com 33
GRAY For more information please contact Gray Associates.
Email: [email protected]
Program Scorecard: Competition
Most programs have fewer competitors.
617.366.2838 www.GrayAssociates.com 34
GRAY For more information please contact Gray Associates.
Email: [email protected]
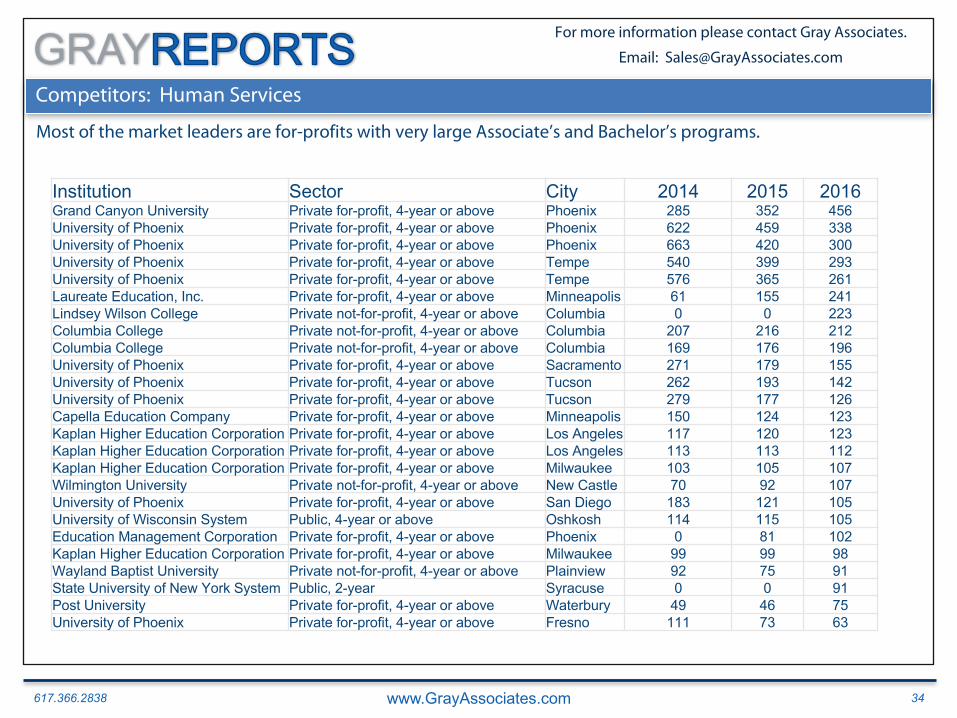
Competitors: Human Services
Most of the market leaders are for-profits with very large Associate’s and Bachelor’s programs.
Institution Sector City 2014 2015 2016 Grand Canyon University Private for-profit, 4-year or above Phoenix 285 352 456University of Phoenix Private for-profit, 4-year or above Phoenix 622 459 338University of Phoenix Private for-profit, 4-year or above Phoenix 663 420 300University of Phoenix Private for-profit, 4-year or above Tempe 540 399 293University of Phoenix Private for-profit, 4-year or above Tempe 576 365 261Laureate Education, Inc. Private for-profit, 4-year or above Minneapolis 61 155 241Lindsey Wilson College Private not-for-profit, 4-year or above Columbia 0 0 223Columbia College Private not-for-profit, 4-year or above Columbia 207 216 212Columbia College Private not-for-profit, 4-year or above Columbia 169 176 196University of Phoenix Private for-profit, 4-year or above Sacramento 271 179 155University of Phoenix Private for-profit, 4-year or above Tucson 262 193 142University of Phoenix Private for-profit, 4-year or above Tucson 279 177 126Capella Education Company Private for-profit, 4-year or above Minneapolis 150 124 123Kaplan Higher Education Corporation Private for-profit, 4-year or above Los Angeles 117 120 123Kaplan Higher Education Corporation Private for-profit, 4-year or above Los Angeles 113 113 112Kaplan Higher Education Corporation Private for-profit, 4-year or above Milwaukee 103 105 107Wilmington University Private not-for-profit, 4-year or above New Castle 70 92 107University of Phoenix Private for-profit, 4-year or above San Diego 183 121 105University of Wisconsin System Public, 4-year or above Oshkosh 114 115 105Education Management Corporation Private for-profit, 4-year or above Phoenix 0 81 102Kaplan Higher Education Corporation Private for-profit, 4-year or above Milwaukee 99 99 98Wayland Baptist University Private not-for-profit, 4-year or above Plainview 92 75 91State University of New York System Public, 2-year Syracuse 0 0 91Post University Private for-profit, 4-year or above Waterbury 49 46 75University of Phoenix Private for-profit, 4-year or above Fresno 111 73 63
617.366.2838 www.GrayAssociates.com 35
GRAY For more information please contact Gray Associates.
Email: [email protected]
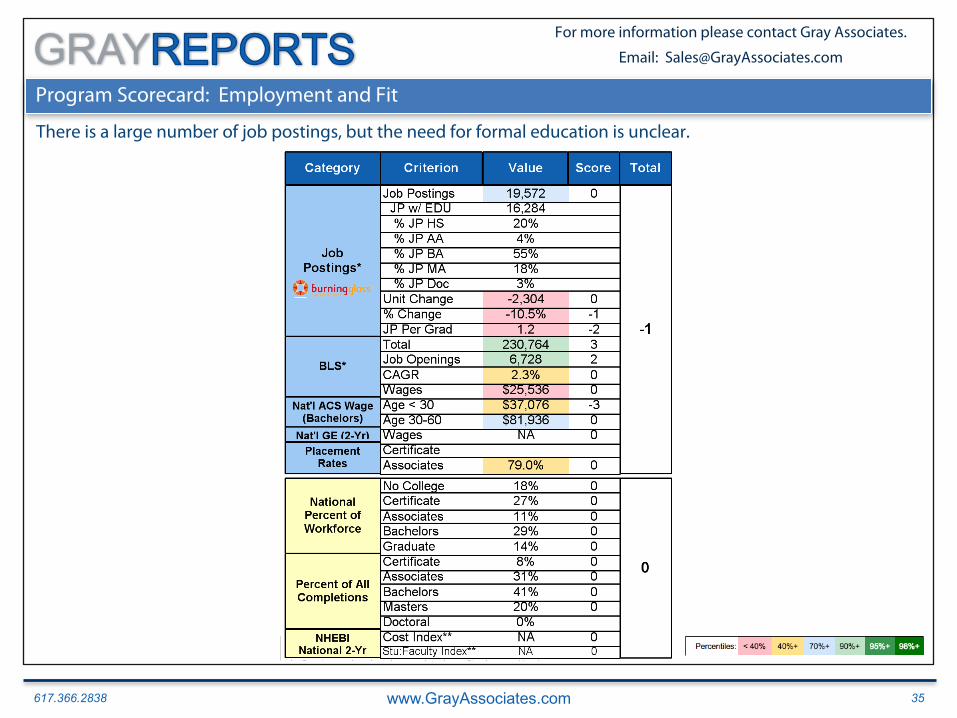
Program Scorecard: Employment and Fit
There is a large number of job postings, but the need for formal education is unclear.
617.366.2838 www.GrayAssociates.com 36
GRAY For more information please contact Gray Associates.
Email: [email protected]
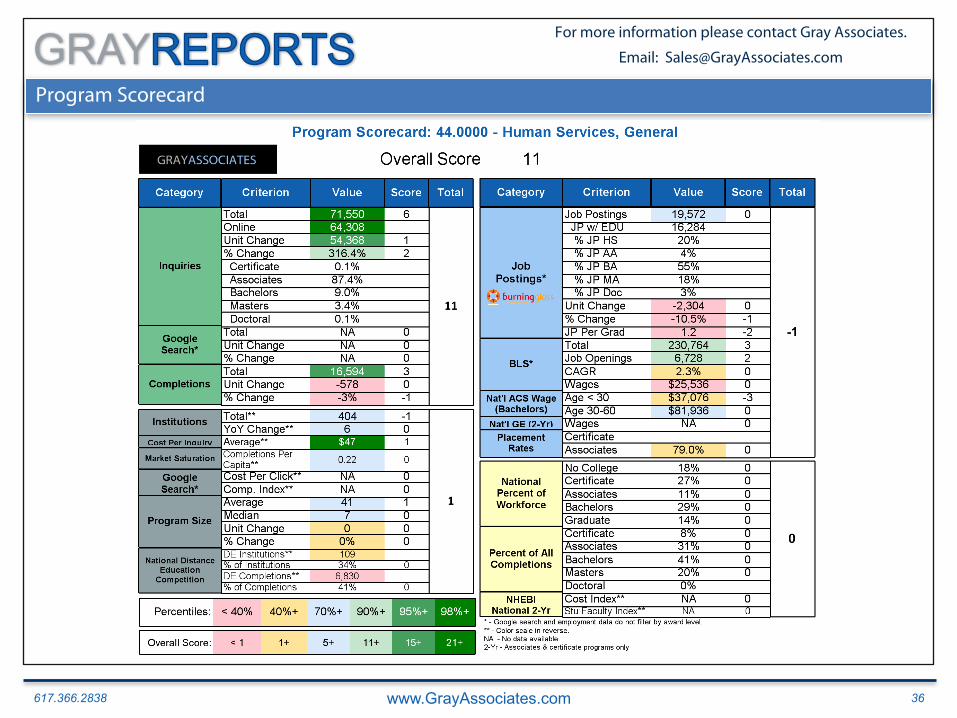
Program Scorecard
617.366.2838 www.GrayAssociates.com 37
GRAY For more information please contact Gray Associates.
Email: [email protected]
Agenda
1. Student Demand Trends: Inquiries, Conversions, and Searches
1. National
2. Online and On-Campus
3. Degree Level
4. City and Program
2. Emerging Programs
3. Program of the Month: Human Services
4. Summary
617.366.2838 www.GrayAssociates.com 38
GRAY For more information please contact Gray Associates.
Email: [email protected]
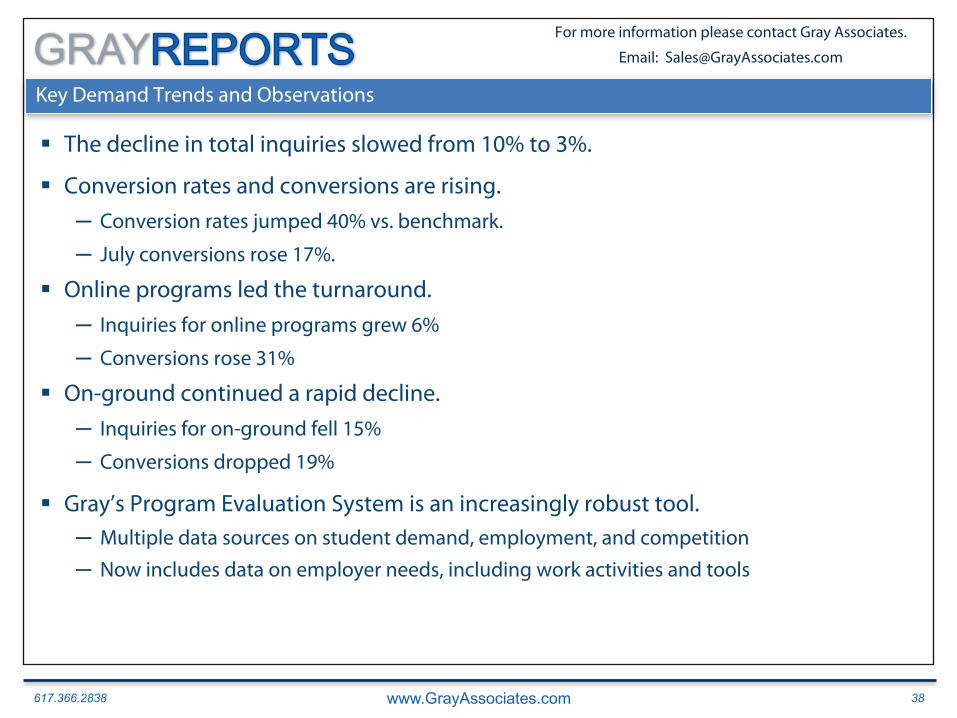
Key Demand Trends and Observations
§ The decline in total inquiries slowed from 10% to 3%.
§ Conversion rates and conversions are rising.
─ Conversion rates jumped 40% vs. benchmark.
─ July conversions rose 17%.
§ Online programs led the turnaround.
─ Inquiries for online programs grew 6%
─ Conversions rose 31%
§ On-ground continued a rapid decline.
─ Inquiries for on-ground fell 15%
─ Conversions dropped 19%
§ Gray’s Program Evaluation System is an increasingly robust tool.─ Multiple data sources on student demand, employment, and competition
─ Now includes data on employer needs, including work activities and tools
617.366.2838 www.GrayAssociates.com 39
GRAY For more information please contact Gray Associates.
Email: [email protected]
Questions and Contacts
Please feel free to contact:Bob Atkins
CEOGray Associates, Inc.
[email protected]@Gray_Associates
617.366.2836

617.366.2838 www.GrayAssociates.com 40
GRAY For more information please contact Gray Associates.
Email: [email protected]
Upcoming Gray Associates’ Webcast
Please join us next month!
December Webcast(November Results)
Wednesday, December 20th at 2:00 PM ET