2017 november grayreports - demand trends for higher education
TRANSCRIPT

GRAYREPORTSDemand for Higher Education Programs
www.GrayAssociates.com
Results through November 2017
617.366.2838 www.GrayAssociates.com 2
GRAY For more information please contact Gray Associates.
Email: [email protected]
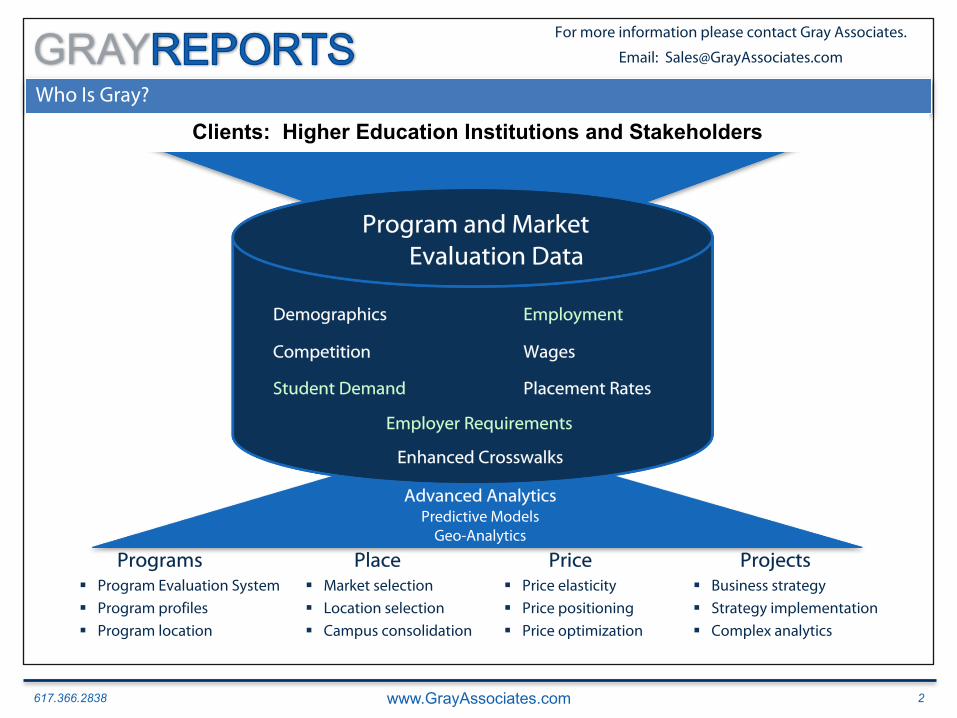
Who Is Gray?
Program and Market Evaluation Data
Employment
Placement RatesStudent Demand
Demographics
Wages
Programs Price ProjectsPlace§ Program Evaluation System
§ Program profiles
§ Program location
§ Market selection
§ Location selection
§ Campus consolidation
§ Price elasticity
§ Price positioning
§ Price optimization
§ Business strategy
§ Strategy implementation
§ Complex analytics
Advanced AnalyticsPredictive Models
Geo-Analytics
Clients: Higher Education Institutions and Stakeholders
Competition
Enhanced Crosswalks
Employer Requirements

617.366.2838 www.GrayAssociates.com 3
GRAY For more information please contact Gray Associates.
Email: [email protected]
Agenda
1. Student Demand Trends: Inquiries, Conversions, and Searches
1. National
2. Online and On-Campus
3. Degree Level
4. City and Program
2. Emerging Programs
3. Program of the Month: Medical Insurance Specialist
4. Summary
617.366.2838 www.GrayAssociates.com 4
GRAY For more information please contact Gray Associates.
Email: [email protected]
0
100,000
200,000
300,000
400,000
500,000
600,000
700,000
800,000
900,000
1,000,000
Jan Feb Mar Apr May Jun Jul Aug Sep Oct Nov Dec
National InquiriesAll Programs and Award Levels
2015 2016 2017
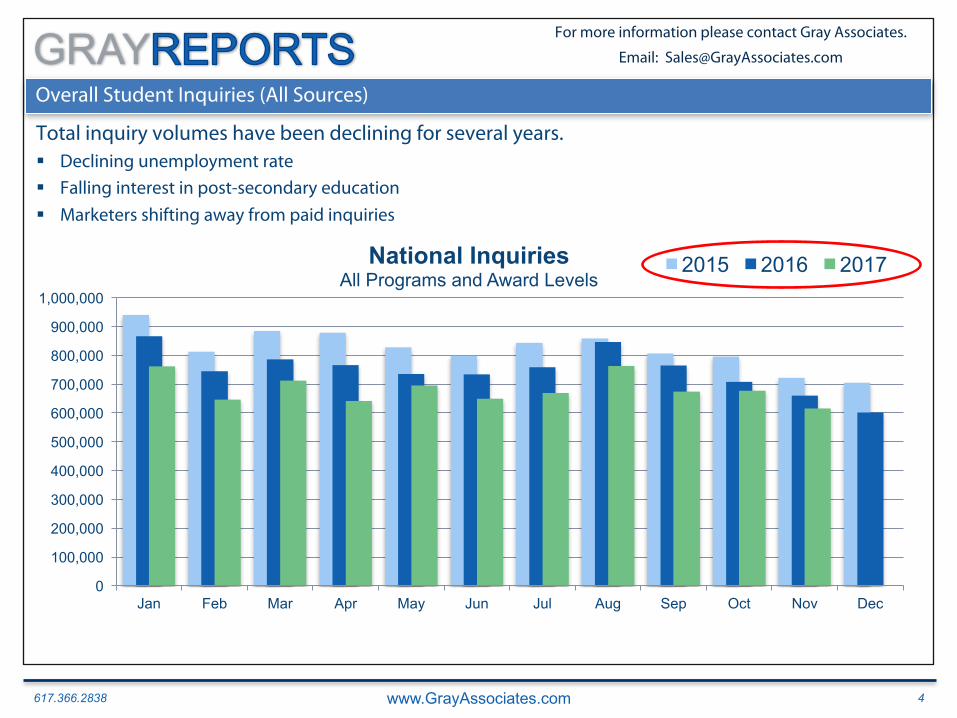
Overall Student Inquiries (All Sources)
Total inquiry volumes have been declining for several years.§ Declining unemployment rate
§ Falling interest in post-secondary education
§ Marketers shifting away from paid inquiries
617.366.2838 www.GrayAssociates.com 5
GRAY For more information please contact Gray Associates.
Email: [email protected]
0
100,000
200,000
300,000
400,000
500,000
600,000
700,000
800,000
900,000
1,000,000
Jan Feb Mar Apr May Jun Jul Aug Sep Oct Nov Dec
National InquiriesAll Programs and Award Levels
2015 2016 2017
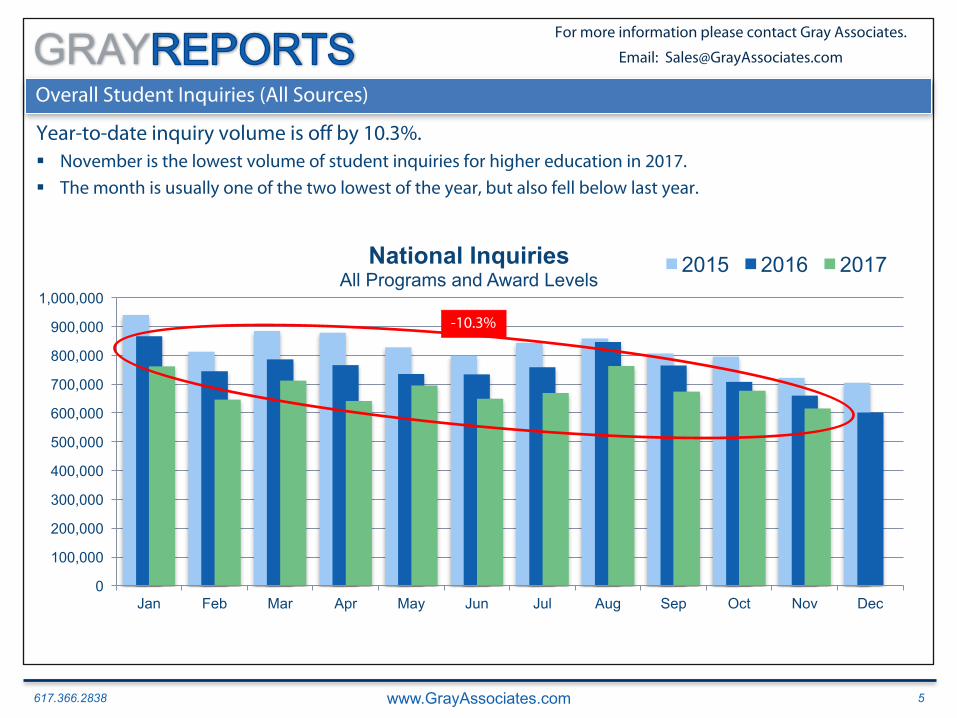
Overall Student Inquiries (All Sources)
Year-to-date inquiry volume is off by 10.3%. § November is the lowest volume of student inquiries for higher education in 2017.
§ The month is usually one of the two lowest of the year, but also fell below last year.
-10.3%

617.366.2838 www.GrayAssociates.com 6
GRAY For more information please contact Gray Associates.
Email: [email protected]
0
100,000
200,000
300,000
400,000
500,000
600,000
700,000
800,000
900,000
1,000,000
Jan Feb Mar Apr May Jun Jul Aug Sep Oct Nov Dec
National InquiriesAll Programs and Award Levels
2015 2016 2017
Overall Student Inquiries (All Sources)
Year-over-year student inquiry volumes fell 7% in November 2017.
-7%

617.366.2838 www.GrayAssociates.com 7
GRAY For more information please contact Gray Associates.
Email: [email protected]
80
90
100
110
120
130
140
150
Q1 2014
Q2 2014
Q3 2014
Q4 2014
Q1 2015
Q2 2015
Q3 2015
Q4 2015
Q1 2016
Q2 2016
Q3 2016
Q4 2016
Q1 2017
Q2 2017
Q3 2017
Overall Inquiry Conversion Rates: Trends(Indexed to Q1 2014)
Inquiry to Application: Overall Conversion Rates
In 2017, conversion rates are well above our 2014 baseline.§ Q2 2017 beat the baseline by 30%.
§ Despite being immature, Q3 2017 is already 45% above the baseline.
1. Applications are counted in the month in which the inquiry is received (i.e., an inquiry that is received in January and converts in March is counted as a January inquiry). Typically, the application rate will rise for three months or more after the month in which the inquiries were received.
2. Total includes unknown source type.
+45
617.366.2838 www.GrayAssociates.com 8
GRAY For more information please contact Gray Associates.
Email: [email protected]
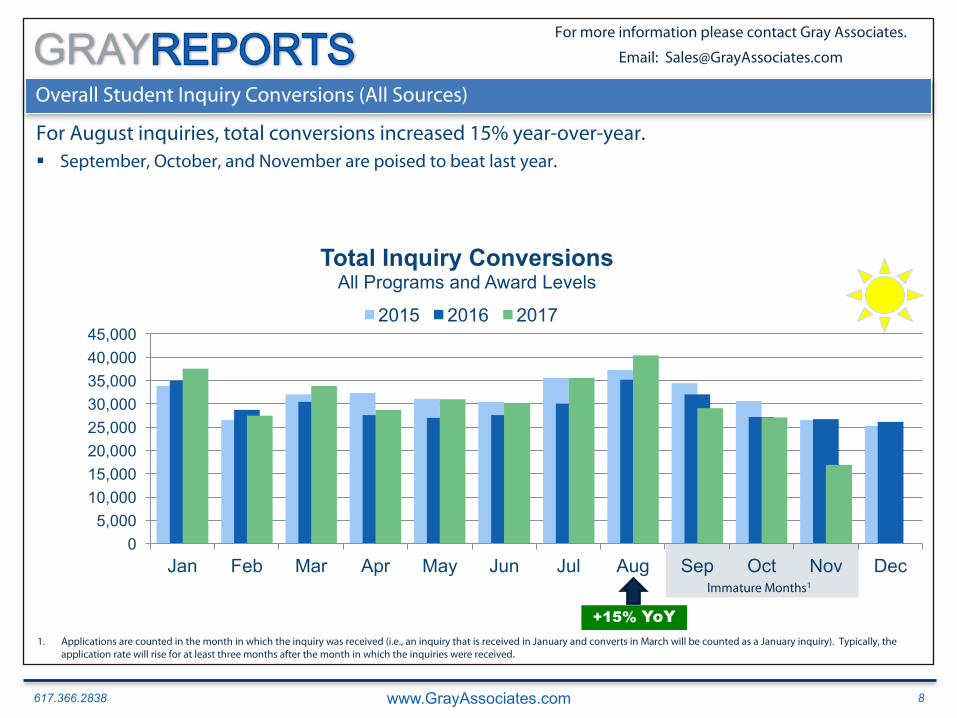
Overall Student Inquiry Conversions (All Sources)
For August inquiries, total conversions increased 15% year-over-year.§ September, October, and November are poised to beat last year.
1. Applications are counted in the month in which the inquiry was received (i.e., an inquiry that is received in January and converts in March will be counted as a January inquiry). Typically, the application rate will rise for at least three months after the month in which the inquiries were received.
05,000
10,00015,00020,00025,00030,00035,00040,00045,000
Jan Feb Mar Apr May Jun Jul Aug Sep Oct Nov Dec
Total Inquiry ConversionsAll Programs and Award Levels
2015 2016 2017
+15% YoY
Immature Months1
617.366.2838 www.GrayAssociates.com 9
GRAY For more information please contact Gray Associates.
Email: [email protected]
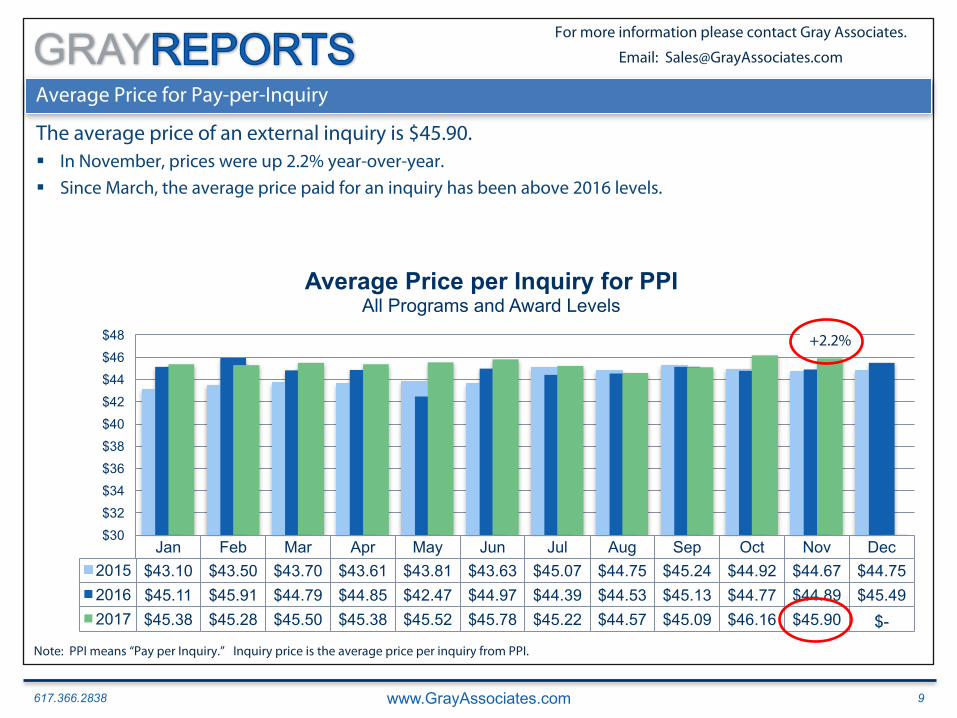
Jan Feb Mar Apr May Jun Jul Aug Sep Oct Nov Dec2015 $43.10 $43.50 $43.70 $43.61 $43.81 $43.63 $45.07 $44.75 $45.24 $44.92 $44.67 $44.752016 $45.11 $45.91 $44.79 $44.85 $42.47 $44.97 $44.39 $44.53 $45.13 $44.77 $44.89 $45.492017 $45.38 $45.28 $45.50 $45.38 $45.52 $45.78 $45.22 $44.57 $45.09 $46.16 $45.90 $-
$30$32$34$36$38$40$42$44$46$48
Average Price per Inquiry for PPIAll Programs and Award Levels
Average Price for Pay-per-Inquiry
The average price of an external inquiry is $45.90.§ In November, prices were up 2.2% year-over-year.
§ Since March, the average price paid for an inquiry has been above 2016 levels.
Note: PPI means “Pay per Inquiry.” Inquiry price is the average price per inquiry from PPI.
+2.2%
617.366.2838 www.GrayAssociates.com 10
GRAY For more information please contact Gray Associates.
Email: [email protected]
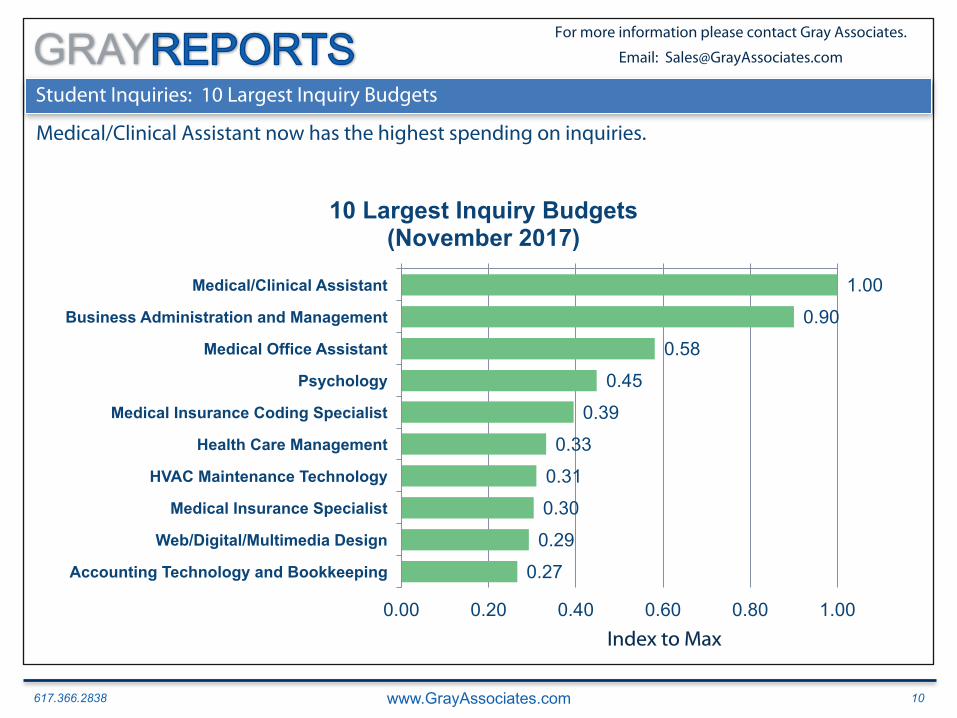
Student Inquiries: 10 Largest Inquiry Budgets
1.00
0.90
0.58
0.45
0.39
0.33
0.31
0.30
0.29
0.27
0.00 0.20 0.40 0.60 0.80 1.00
Medical/Clinical Assistant
Business Administration and Management
Medical Office Assistant
Psychology
Medical Insurance Coding Specialist
Health Care Management
HVAC Maintenance Technology
Medical Insurance Specialist
Web/Digital/Multimedia Design
Accounting Technology and Bookkeeping
10 Largest Inquiry Budgets(November 2017)
Medical/Clinical Assistant now has the highest spending on inquiries.
Index to Max
617.366.2838 www.GrayAssociates.com 11
GRAY For more information please contact Gray Associates.
Email: [email protected]
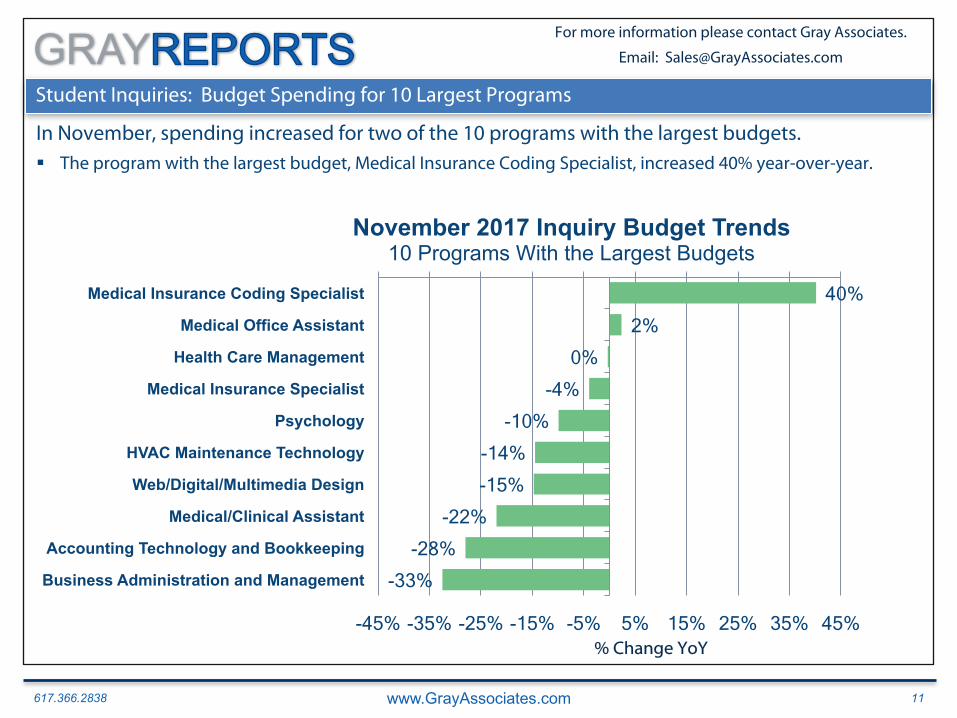
Student Inquiries: Budget Spending for 10 Largest Programs
40% 2%
0% -4%
-10% -14% -15%
-22% -28%
-33%
-45% -35% -25% -15% -5% 5% 15% 25% 35% 45%
Medical Insurance Coding Specialist
Medical Office Assistant
Health Care Management
Medical Insurance Specialist
Psychology
HVAC Maintenance Technology
Web/Digital/Multimedia Design
Medical/Clinical Assistant
Accounting Technology and Bookkeeping
Business Administration and Management
November 2017 Inquiry Budget Trends10 Programs With the Largest Budgets
§ The program with the largest budget, Medical Insurance Coding Specialist, increased 40% year-over-year.
In November, spending increased for two of the 10 programs with the largest budgets.
% Change YoY
617.366.2838 www.GrayAssociates.com 12
GRAY For more information please contact Gray Associates.
Email: [email protected]
Agenda
1. Student Demand Trends: Inquiries, Conversions, and Searches
1. National
2. Online and On-Campus
3. Degree Level
4. City and Program
2. Emerging Programs
3. Program of the Month: Medical Insurance Specialist
4. Summary
617.366.2838 www.GrayAssociates.com 13
GRAY For more information please contact Gray Associates.
Email: [email protected]
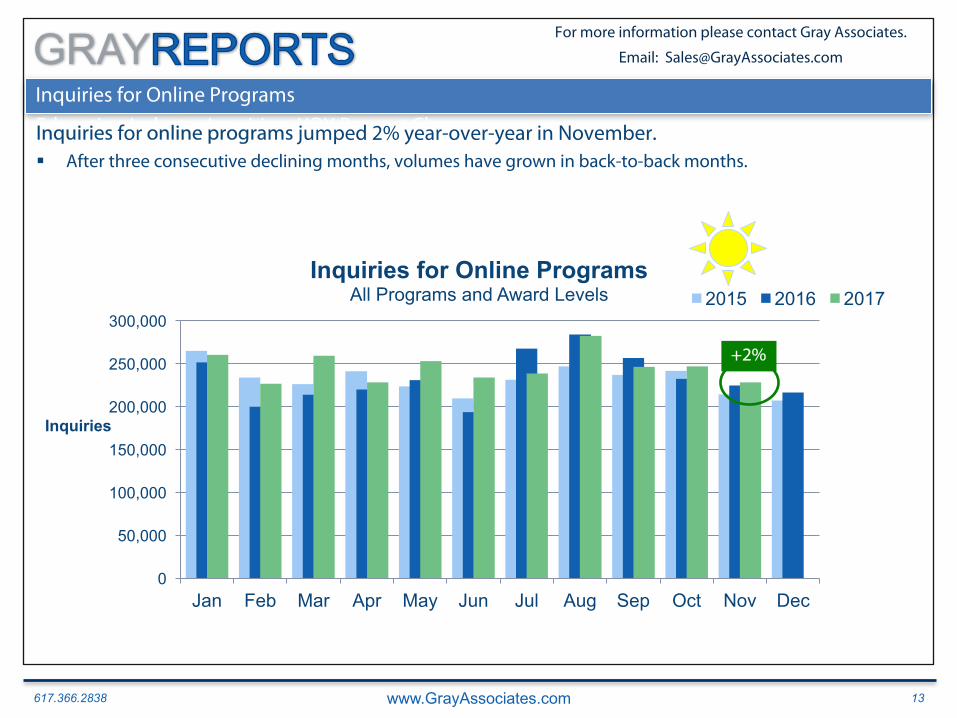
Inquiries for Online Programs
Education Industry Inquiries: YOY Percent ChangeInquiries for online programs jumped 2% year-over-year in November.§ After three consecutive declining months, volumes have grown in back-to-back months.
0
50,000
100,000
150,000
200,000
250,000
300,000
Jan Feb Mar Apr May Jun Jul Aug Sep Oct Nov Dec
Inquiries
Inquiries for Online ProgramsAll Programs and Award Levels 2015 2016 2017
+2%
617.366.2838 www.GrayAssociates.com 14
GRAY For more information please contact Gray Associates.
Email: [email protected]
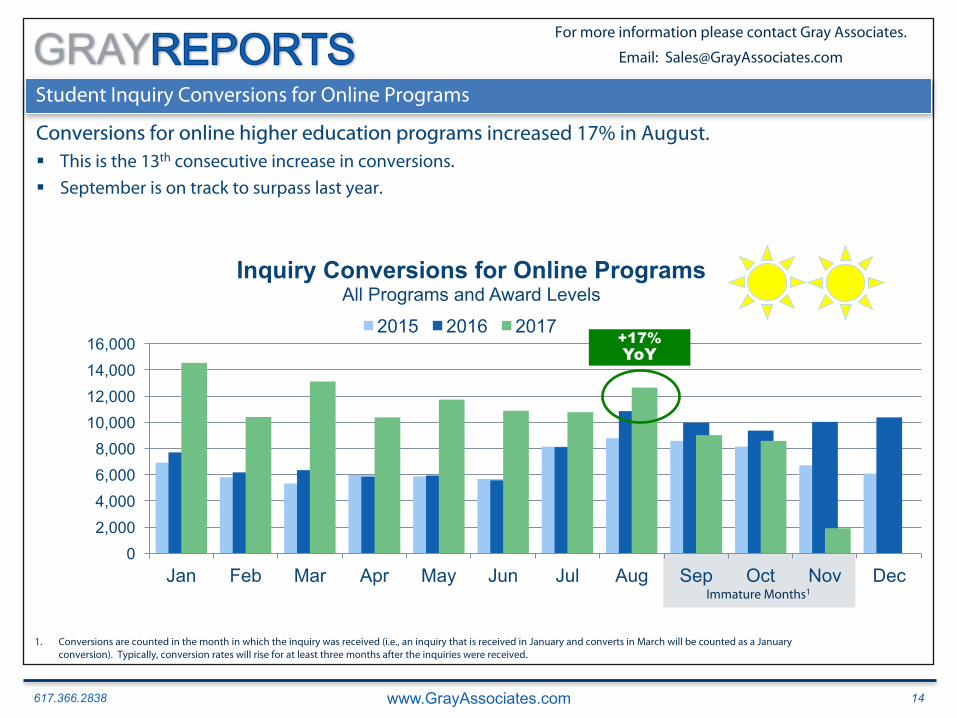
Student Inquiry Conversions for Online Programs
Conversions for online higher education programs increased 17% in August.§ This is the 13th consecutive increase in conversions.
§ September is on track to surpass last year.
1. Conversions are counted in the month in which the inquiry was received (i.e., an inquiry that is received in January and converts in March will be counted as a January conversion). Typically, conversion rates will rise for at least three months after the inquiries were received.
Immature Months1
02,0004,0006,0008,000
10,00012,00014,00016,000
Jan Feb Mar Apr May Jun Jul Aug Sep Oct Nov Dec
Inquiry Conversions for Online ProgramsAll Programs and Award Levels
2015 2016 2017+17% YoY
617.366.2838 www.GrayAssociates.com 15
GRAY For more information please contact Gray Associates.
Email: [email protected]
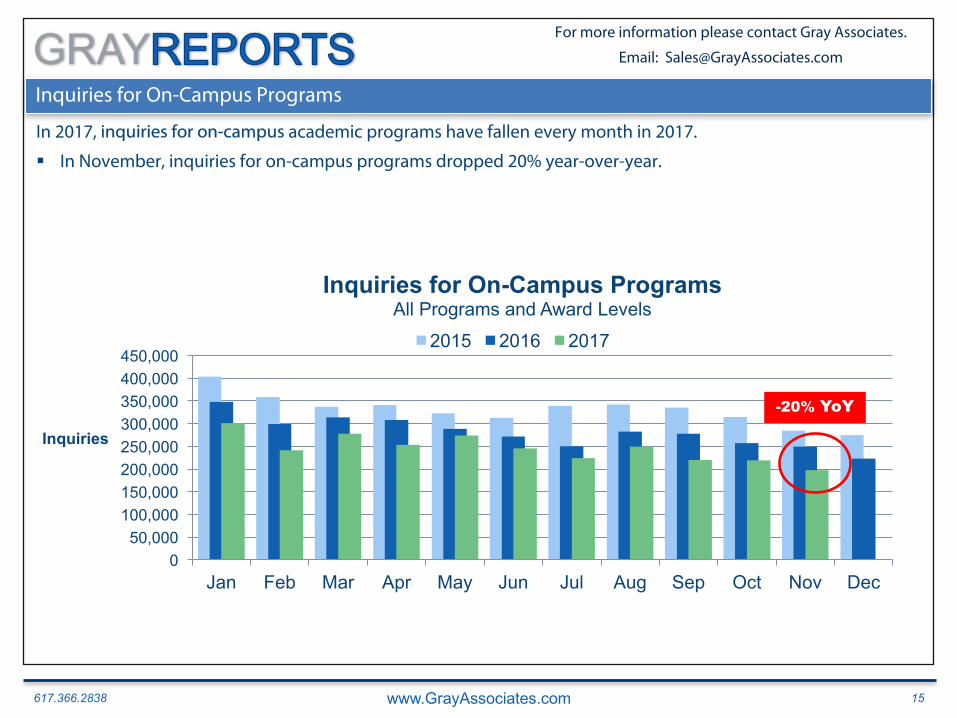
Inquiries for On-Campus Programs
In 2017, inquiries for on-campus academic programs have fallen every month in 2017.
§ In November, inquiries for on-campus programs dropped 20% year-over-year.
2012
050,000
100,000150,000200,000250,000300,000350,000400,000450,000
Jan Feb Mar Apr May Jun Jul Aug Sep Oct Nov Dec
Inquiries
Inquiries for On-Campus ProgramsAll Programs and Award Levels
2015 2016 2017
-20% YoY
617.366.2838 www.GrayAssociates.com 16
GRAY For more information please contact Gray Associates.
Email: [email protected]
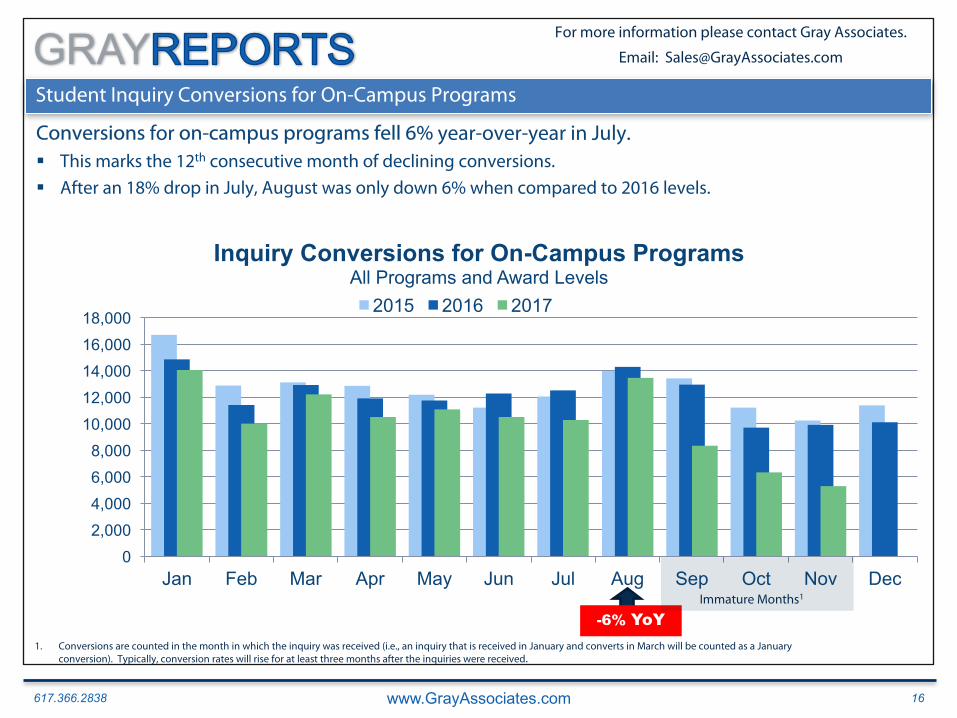
Student Inquiry Conversions for On-Campus Programs
Conversions for on-campus programs fell 6% year-over-year in July.§ This marks the 12th consecutive month of declining conversions.
§ After an 18% drop in July, August was only down 6% when compared to 2016 levels.
02,0004,0006,0008,000
10,00012,00014,00016,00018,000
Jan Feb Mar Apr May Jun Jul Aug Sep Oct Nov Dec
Inquiry Conversions for On-Campus ProgramsAll Programs and Award Levels
2015 2016 2017
-6% YoY1. Conversions are counted in the month in which the inquiry was received (i.e., an inquiry that is received in January and converts in March will be counted as a January
conversion). Typically, conversion rates will rise for at least three months after the inquiries were received.
Immature Months1
617.366.2838 www.GrayAssociates.com 17
GRAY For more information please contact Gray Associates.
Email: [email protected]
Agenda
1. Student Demand Trends: Inquiries, Conversions, and Searches
1. National
2. Online and On-Campus
3. Degree Level
4. City and Program
2. Emerging Programs
3. Program of the Month: Medical Insurance Specialist
4. Summary

617.366.2838 www.GrayAssociates.com 18
GRAY For more information please contact Gray Associates.
Email: [email protected]
Inquiry Volumes by Degree – Year-Over-Year Change
Bachelor’s degrees were the fastest-growing degree level.§ The higher degree levels continued to outperform lower-level degrees.
-30%
-17%
3%
7%
24%
-35% -25% -15% -5% 5% 15% 25%
Associate's degree
Undergraduate certificate
Master's degree
Doctor's degree
Bachelor's degree
Change in InquiriesNovember 2017 YoY
617.366.2838 www.GrayAssociates.com 19
GRAY For more information please contact Gray Associates.
Email: [email protected]
Agenda
1. Student Demand Trends: Inquiries, Conversions, and Searches
1. National
2. Online and On-Campus
3. Degree Level
4. City and Program
2. Emerging Programs
3. Program of the Month: Medical Insurance Specialist
4. Summary
617.366.2838 www.GrayAssociates.com 20
GRAY For more information please contact Gray Associates.
Email: [email protected]
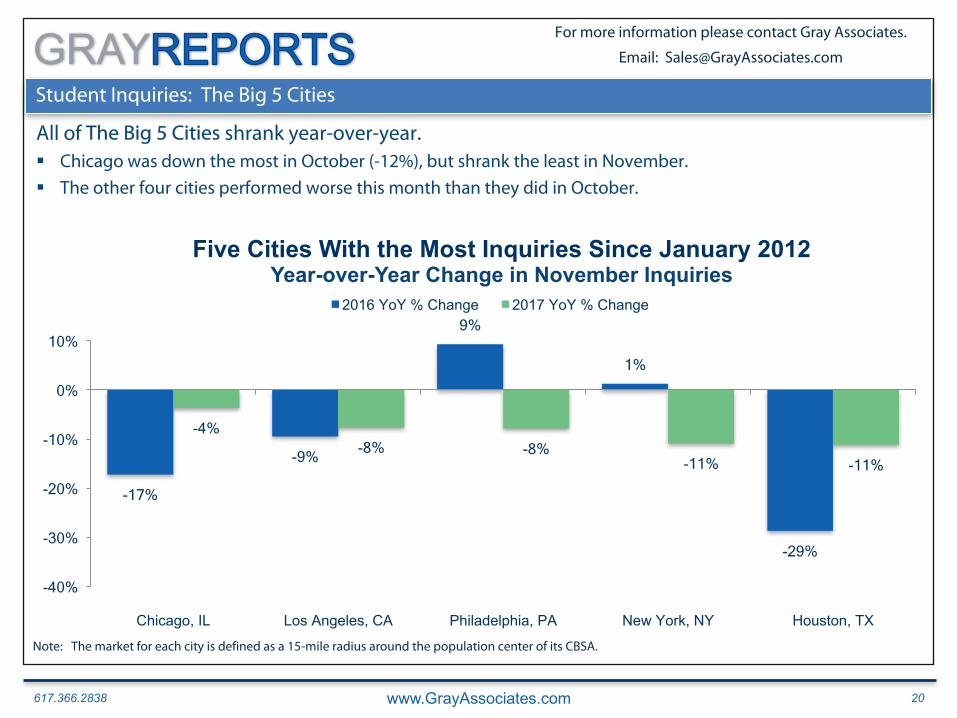
Student Inquiries: The Big 5 Cities
All of The Big 5 Cities shrank year-over-year.§ Chicago was down the most in October (-12%), but shrank the least in November.
§ The other four cities performed worse this month than they did in October.
-17%
-9%
9%
1%
-29%
-4% -8% -8%
-11% -11%
-40%
-30%
-20%
-10%
0%
10%
Chicago, IL Los Angeles, CA Philadelphia, PA New York, NY Houston, TX
Five Cities With the Most Inquiries Since January 2012Year-over-Year Change in November Inquiries
2016 YoY % Change 2017 YoY % Change
Note: The market for each city is defined as a 15-mile radius around the population center of its CBSA.
617.366.2838 www.GrayAssociates.com 21
GRAY For more information please contact Gray Associates.
Email: [email protected]
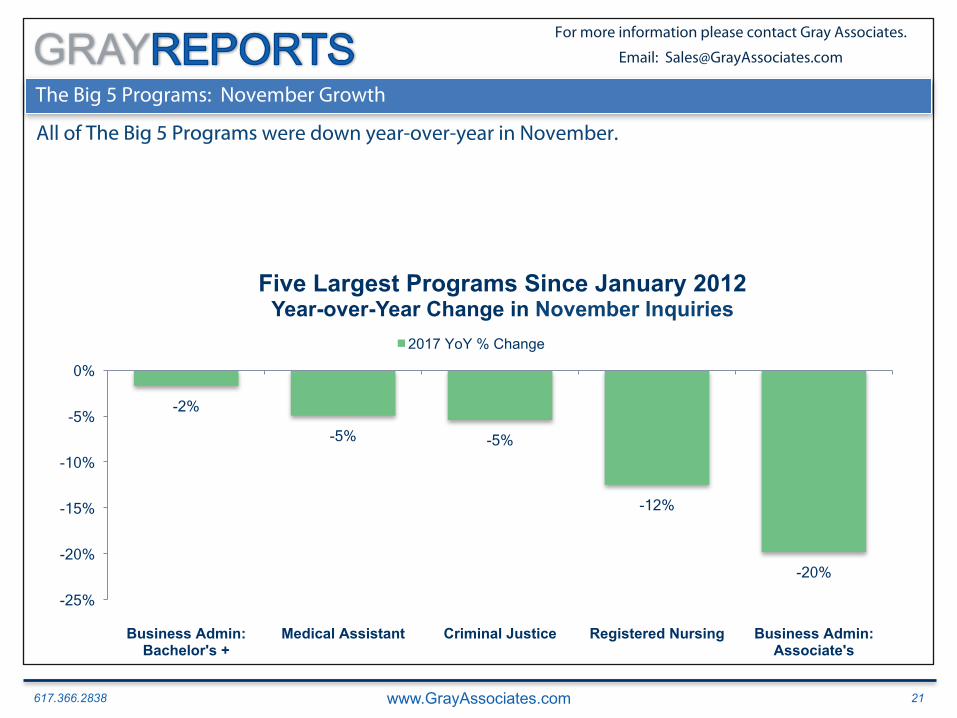
The Big 5 Programs: November Growth
All of The Big 5 Programs were down year-over-year in November.
-2%
-5% -5%
-12%
-20%
-25%
-20%
-15%
-10%
-5%
0%
Business Admin: Bachelor's +
Medical Assistant Criminal Justice Registered Nursing Business Admin: Associate's
Five Largest Programs Since January 2012Year-over-Year Change in November Inquiries
2017 YoY % Change
617.366.2838 www.GrayAssociates.com 22
GRAY For more information please contact Gray Associates.
Email: [email protected]
84%
41% 31%
26% 20%
0%
50%
100%
Human Services Medical Insurance Coding Specialist
Counseling Psychology
Health Sciences, General
Christian Studies
The Fast 5 ProgramsYear-over-Year Change in November Inquiries
2017 YoY % Change
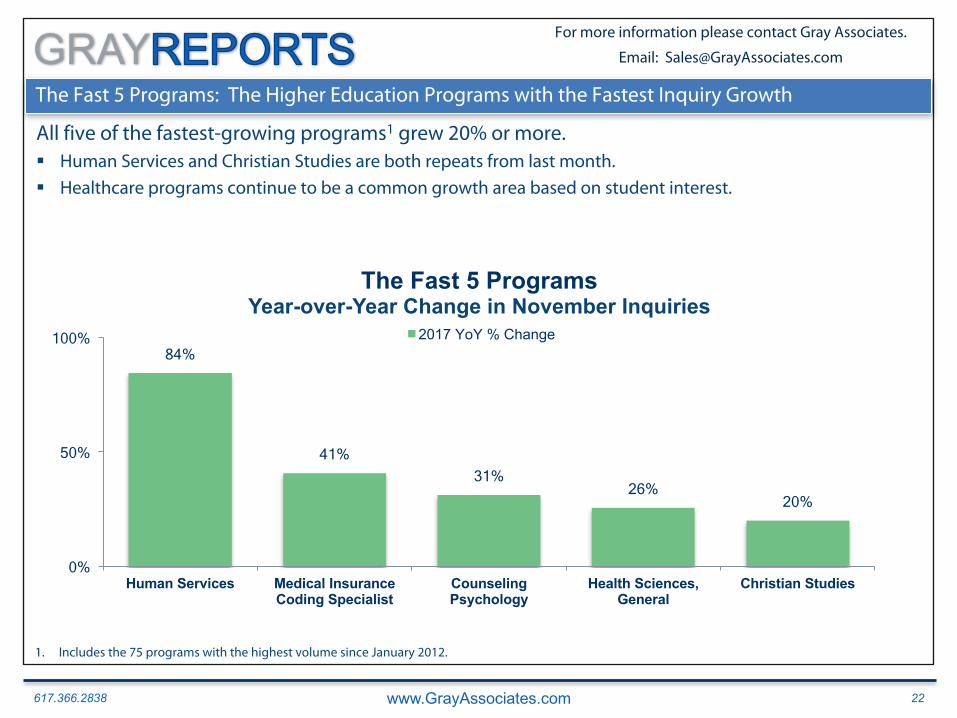
The Fast 5 Programs: The Higher Education Programs with the Fastest Inquiry Growth
All five of the fastest-growing programs1 grew 20% or more.§ Human Services and Christian Studies are both repeats from last month.
§ Healthcare programs continue to be a common growth area based on student interest.
1. Includes the 75 programs with the highest volume since January 2012.
617.366.2838 www.GrayAssociates.com 23
GRAY For more information please contact Gray Associates.
Email: [email protected]
Agenda
1. Student Demand Trends: Inquiries, Conversions, and Searches
1. National
2. Online and On-Campus
3. Degree Level
4. City and Program
2. Emerging Programs
3. Program of the Month: Medical Insurance Specialist
4. Summary
617.366.2838 www.GrayAssociates.com 24
GRAY For more information please contact Gray Associates.
Email: [email protected]
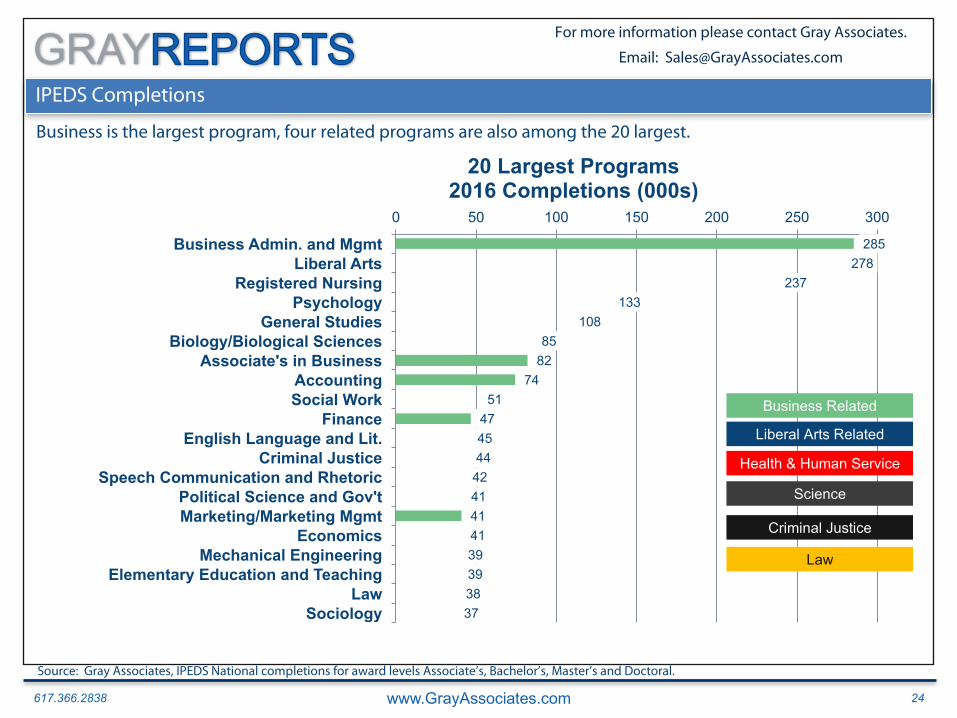
IPEDS Completions
Business is the largest program, four related programs are also among the 20 largest.
285278
237133
10885
8274
514745444241414139393837
0 50 100 150 200 250 300
Business Admin. and MgmtLiberal Arts
Registered NursingPsychology
General StudiesBiology/Biological Sciences
Associate's in BusinessAccountingSocial Work
FinanceEnglish Language and Lit.
Criminal JusticeSpeech Communication and Rhetoric
Political Science and Gov'tMarketing/Marketing Mgmt
EconomicsMechanical Engineering
Elementary Education and TeachingLaw
Sociology
20 Largest Programs 2016 Completions (000s)
Business Related
Health & Human Service
Science
Liberal Arts Related
Criminal Justice
Law
Source: Gray Associates, IPEDS National completions for award levels Associate’s, Bachelor’s, Master’s and Doctoral.
617.366.2838 www.GrayAssociates.com 25
GRAY For more information please contact Gray Associates.
Email: [email protected]
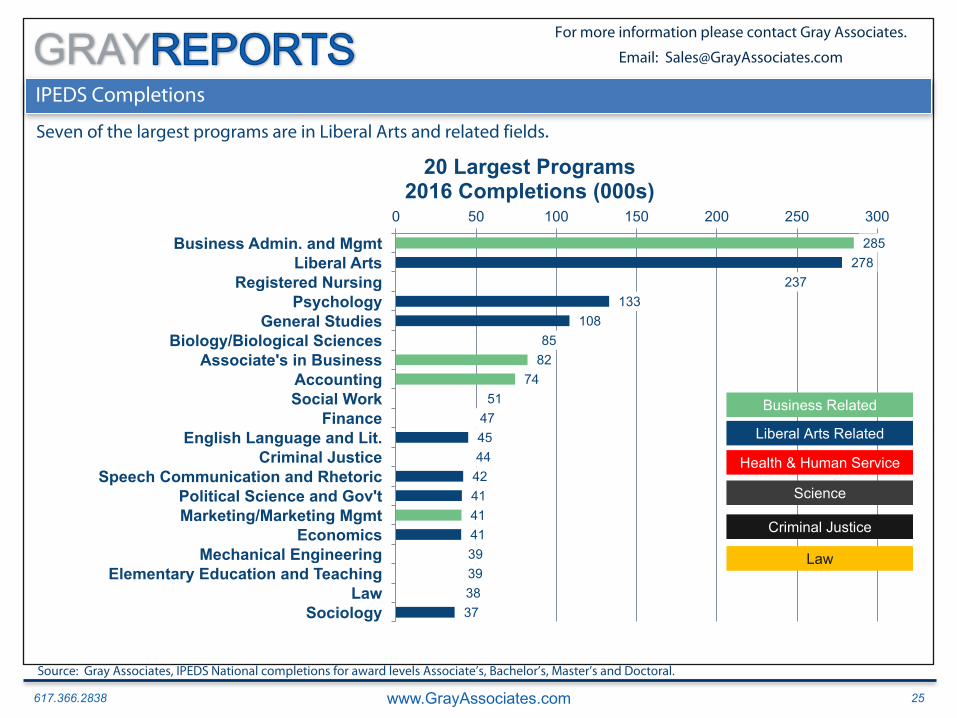
IPEDS Completions
Seven of the largest programs are in Liberal Arts and related fields.
285278
237133
10885
8274
514745444241414139393837
0 50 100 150 200 250 300
Business Admin. and MgmtLiberal Arts
Registered NursingPsychology
General StudiesBiology/Biological Sciences
Associate's in BusinessAccountingSocial Work
FinanceEnglish Language and Lit.
Criminal JusticeSpeech Communication and Rhetoric
Political Science and Gov'tMarketing/Marketing Mgmt
EconomicsMechanical Engineering
Elementary Education and TeachingLaw
Sociology
20 Largest Programs 2016 Completions (000s)
Business Related
Health & Human Service
Science
Liberal Arts Related
Criminal Justice
Law
Source: Gray Associates, IPEDS National completions for award levels Associate’s, Bachelor’s, Master’s and Doctoral.
617.366.2838 www.GrayAssociates.com 26
GRAY For more information please contact Gray Associates.
Email: [email protected]
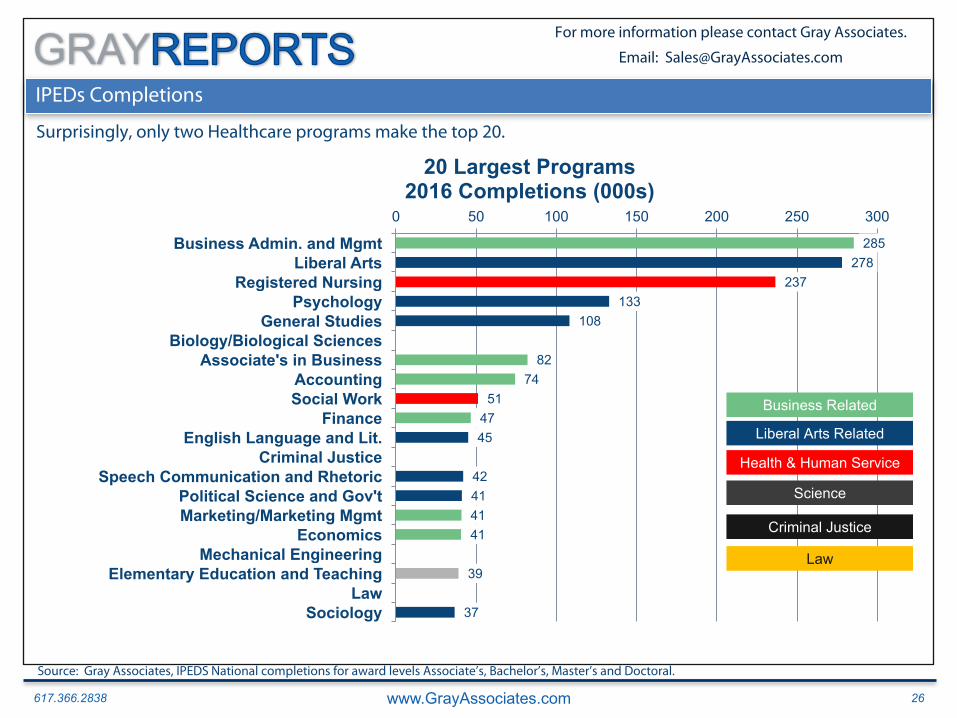
IPEDs Completions
Surprisingly, only two Healthcare programs make the top 20.
285278
237133
108
8274
514745
42414141
39
37
0 50 100 150 200 250 300
Business Admin. and MgmtLiberal Arts
Registered NursingPsychology
General StudiesBiology/Biological Sciences
Associate's in BusinessAccountingSocial Work
FinanceEnglish Language and Lit.
Criminal JusticeSpeech Communication and Rhetoric
Political Science and Gov'tMarketing/Marketing Mgmt
EconomicsMechanical Engineering
Elementary Education and TeachingLaw
Sociology
20 Largest Programs 2016 Completions (000s)
Business Related
Health & Human Service
Science
Liberal Arts Related
Criminal Justice
Law
Source: Gray Associates, IPEDS National completions for award levels Associate’s, Bachelor’s, Master’s and Doctoral.
617.366.2838 www.GrayAssociates.com 27
GRAY For more information please contact Gray Associates.
Email: [email protected]
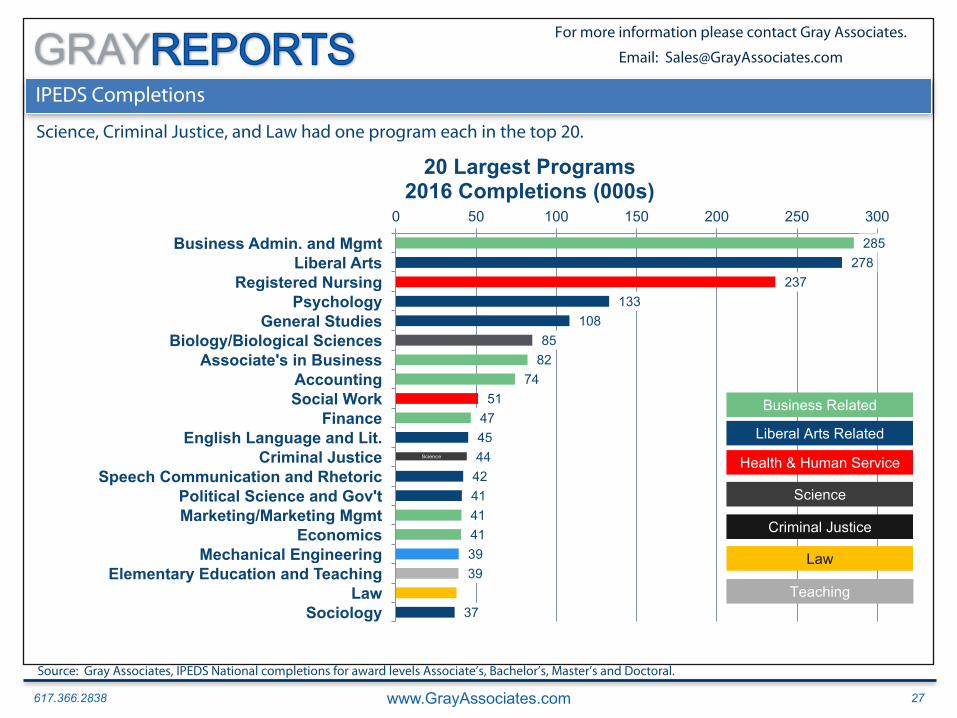
IPEDS Completions
Science, Criminal Justice, and Law had one program each in the top 20.
Science
285278
237133
10885
8274
51474544424141413939
37
0 50 100 150 200 250 300
Business Admin. and MgmtLiberal Arts
Registered NursingPsychology
General StudiesBiology/Biological Sciences
Associate's in BusinessAccountingSocial Work
FinanceEnglish Language and Lit.
Criminal JusticeSpeech Communication and Rhetoric
Political Science and Gov'tMarketing/Marketing Mgmt
EconomicsMechanical Engineering
Elementary Education and TeachingLaw
Sociology
20 Largest Programs2016 Completions (000s)
Business Related
Health & Human Service
Science
Liberal Arts Related
Criminal Justice
Law
Source: Gray Associates, IPEDS National completions for award levels Associate’s, Bachelor’s, Master’s and Doctoral.
Teaching
617.366.2838 www.GrayAssociates.com 28
GRAY For more information please contact Gray Associates.
Email: [email protected]
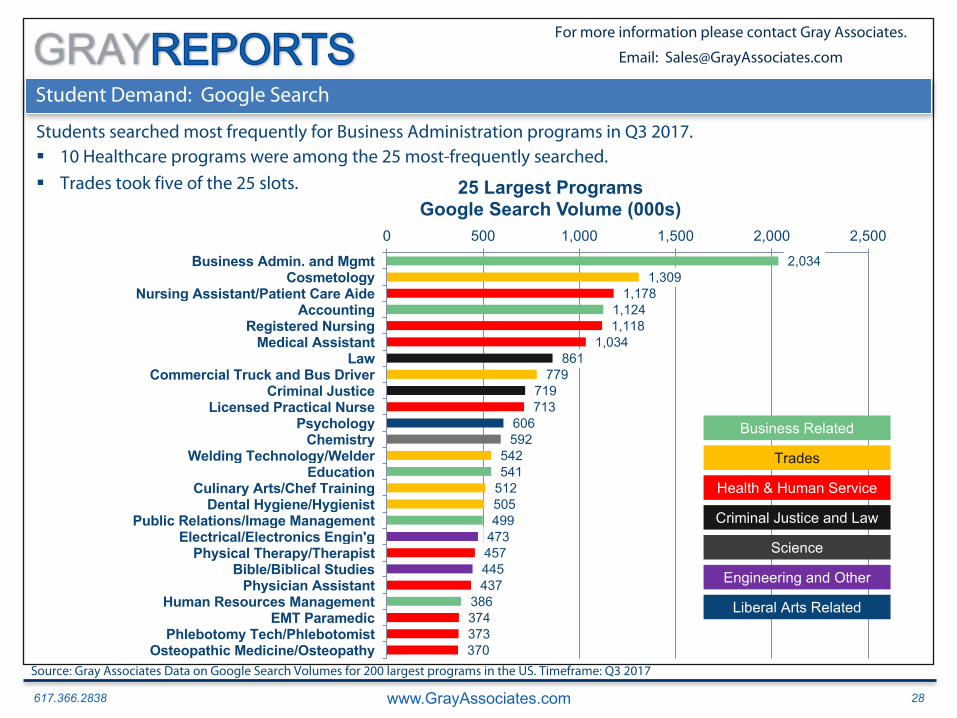
Student Demand: Google Search
Students searched most frequently for Business Administration programs in Q3 2017.§ 10 Healthcare programs were among the 25 most-frequently searched.
§ Trades took five of the 25 slots.
2,0341,309
1,1781,1241,118
1,034861
779719713
606592
542541
512505499
473457445437
386374373370
0 500 1,000 1,500 2,000 2,500
Business Admin. and MgmtCosmetology
Nursing Assistant/Patient Care AideAccounting
Registered NursingMedical Assistant
LawCommercial Truck and Bus Driver
Criminal JusticeLicensed Practical Nurse
PsychologyChemistry
Welding Technology/WelderEducation
Culinary Arts/Chef TrainingDental Hygiene/Hygienist
Public Relations/Image ManagementElectrical/Electronics Engin'g
Physical Therapy/TherapistBible/Biblical Studies
Physician AssistantHuman Resources Management
EMT ParamedicPhlebotomy Tech/Phlebotomist
Osteopathic Medicine/Osteopathy
25 Largest Programs Google Search Volume (000s)
Source: Gray Associates Data on Google Search Volumes for 200 largest programs in the US. Timeframe: Q3 2017
Business Related
Health & Human Service
Science
Liberal Arts Related
Criminal Justice and Law
Trades
Engineering and Other
617.366.2838 www.GrayAssociates.com 29
GRAY For more information please contact Gray Associates.
Email: [email protected]
Agenda
1. Student Demand Trends: Inquiries, Conversions, and Searches
1. National
2. Online and On-Campus
3. Degree Level
4. City and Program
2. Emerging Programs
3. Program of the Month: Medical Insurance Specialist
4. Summary
617.366.2838 www.GrayAssociates.com 30
GRAY For more information please contact Gray Associates.
Email: [email protected]
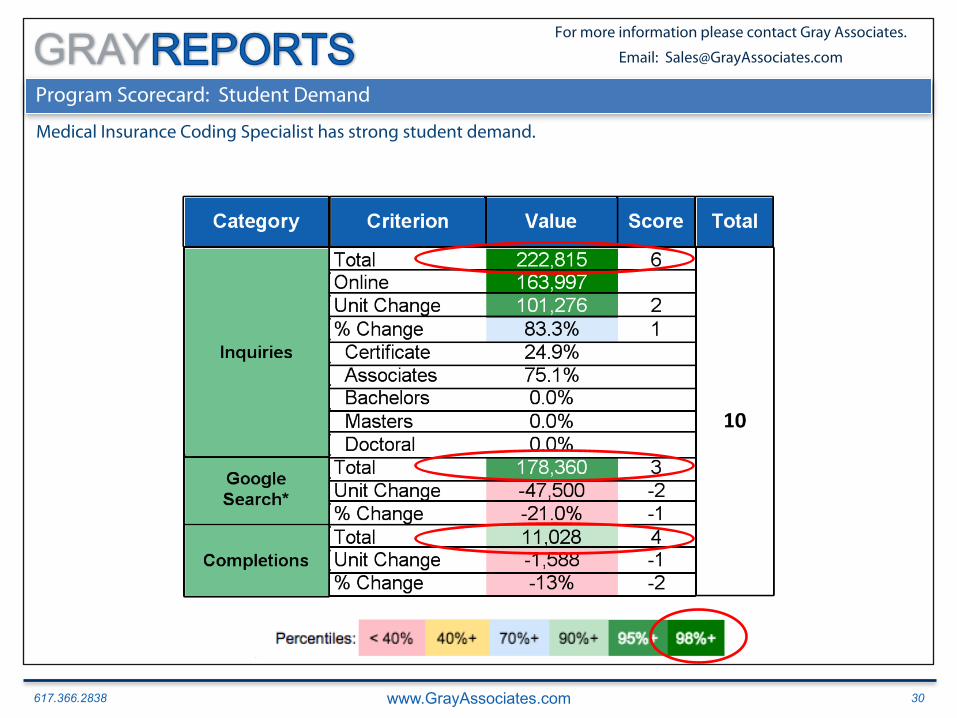
Program Scorecard: Student Demand
Medical Insurance Coding Specialist has strong student demand.
617.366.2838 www.GrayAssociates.com 31
GRAY For more information please contact Gray Associates.
Email: [email protected]
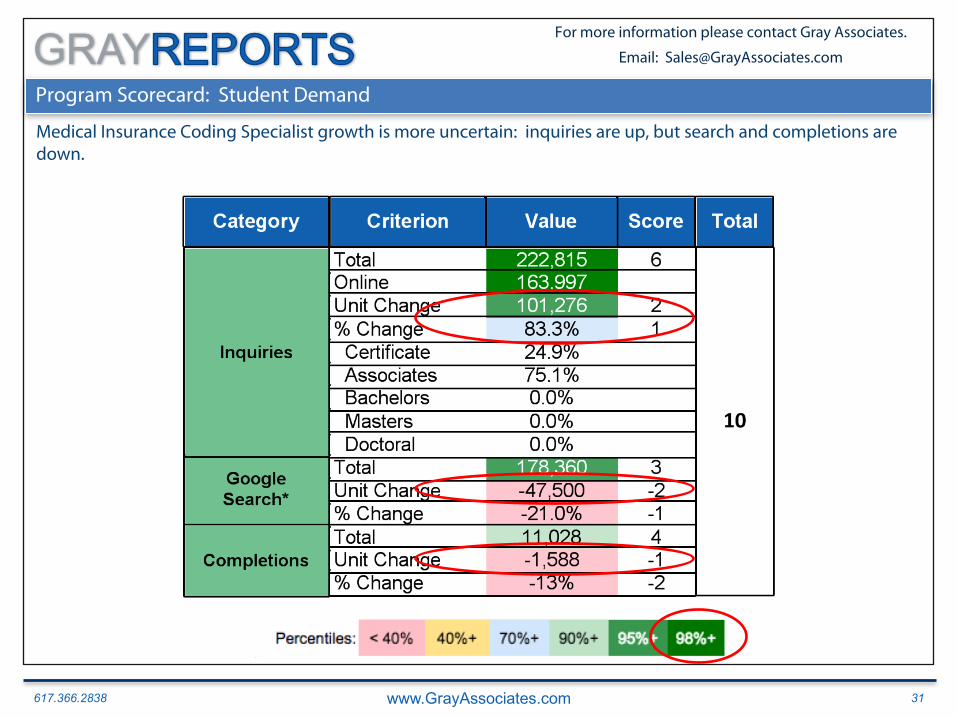
Program Scorecard: Student Demand
Medical Insurance Coding Specialist growth is more uncertain: inquiries are up, but search and completions are down.
617.366.2838 www.GrayAssociates.com 32
GRAY For more information please contact Gray Associates.
Email: [email protected]
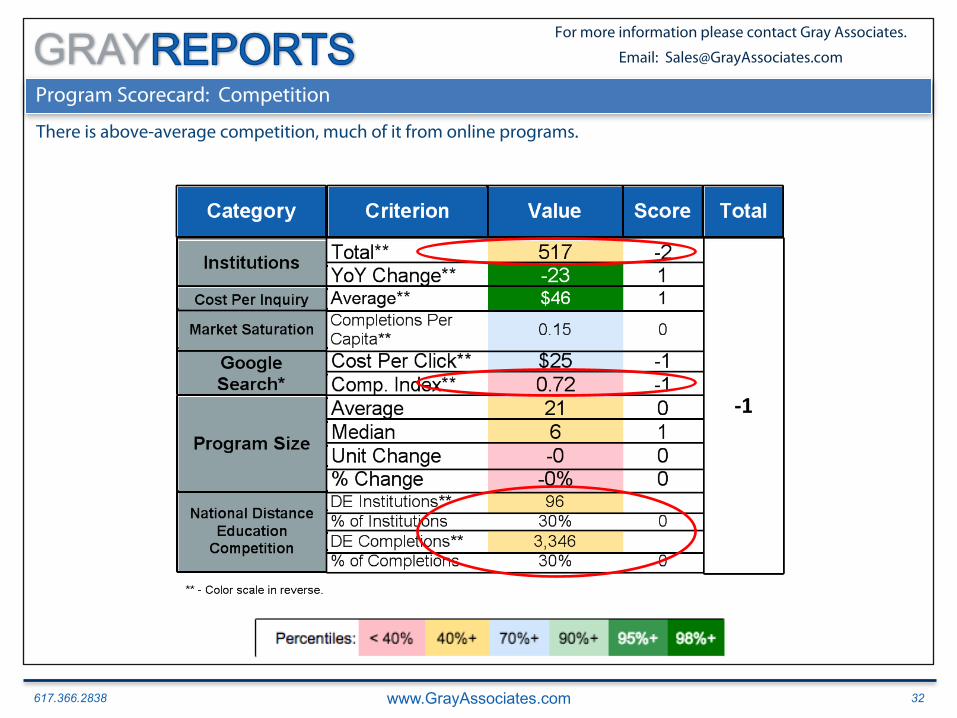
Program Scorecard: Competition
There is above-average competition, much of it from online programs.
617.366.2838 www.GrayAssociates.com 33
GRAY For more information please contact Gray Associates.
Email: [email protected]
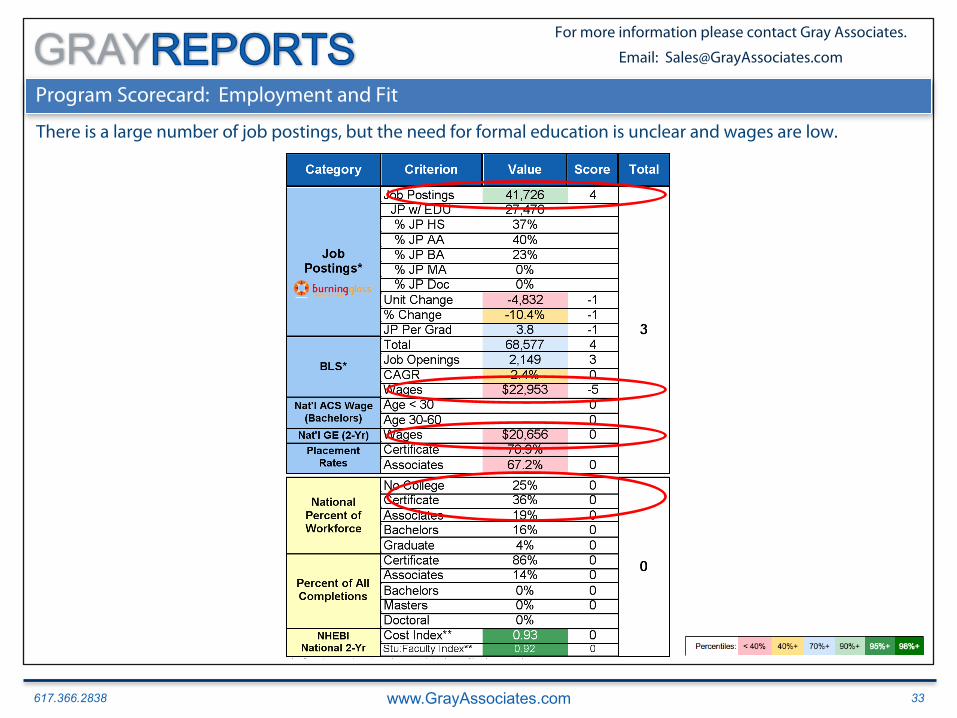
Program Scorecard: Employment and Fit
There is a large number of job postings, but the need for formal education is unclear and wages are low.
617.366.2838 www.GrayAssociates.com 34
GRAY For more information please contact Gray Associates.
Email: [email protected]
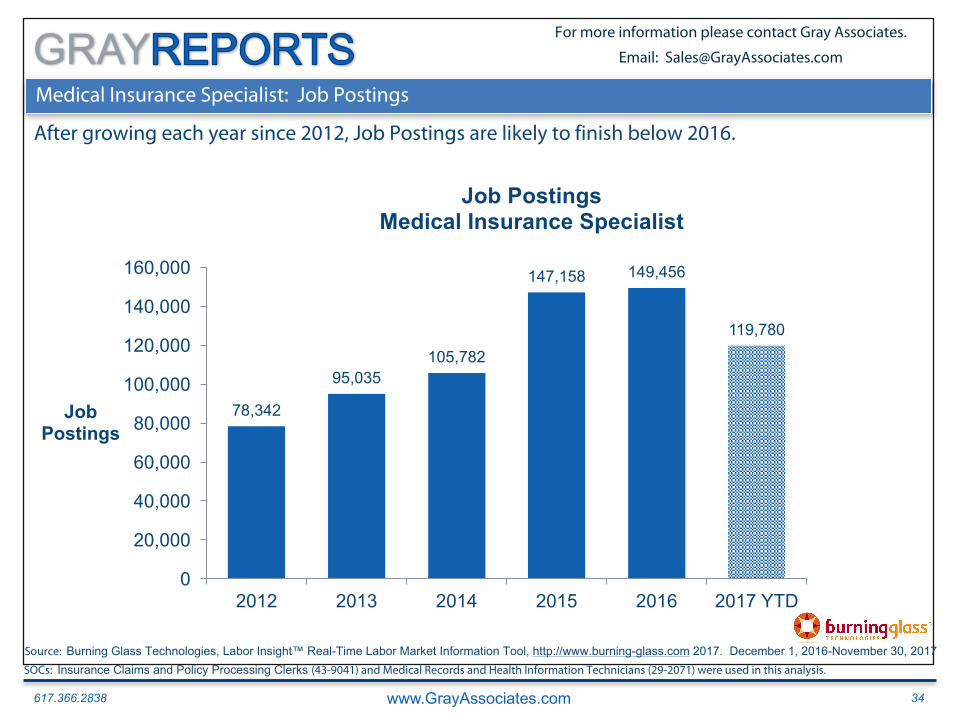
Medical Insurance Specialist: Job Postings
After growing each year since 2012, Job Postings are likely to finish below 2016.
78,342
95,035105,782
147,158 149,456
119,780
0
20,000
40,000
60,000
80,000
100,000
120,000
140,000
160,000
2012 2013 2014 2015 2016 2017 YTD
Job Postings
Job PostingsMedical Insurance Specialist
Source: Burning Glass Technologies, Labor Insight™ Real-Time Labor Market Information Tool, http://www.burning-glass.com 2017. December 1, 2016-November 30, 2017SOCs: Insurance Claims and Policy Processing Clerks (43-9041) and Medical Records and Health Information Technicians (29-2071) were used in this analysis.
617.366.2838 www.GrayAssociates.com 35
GRAY For more information please contact Gray Associates.
Email: [email protected]
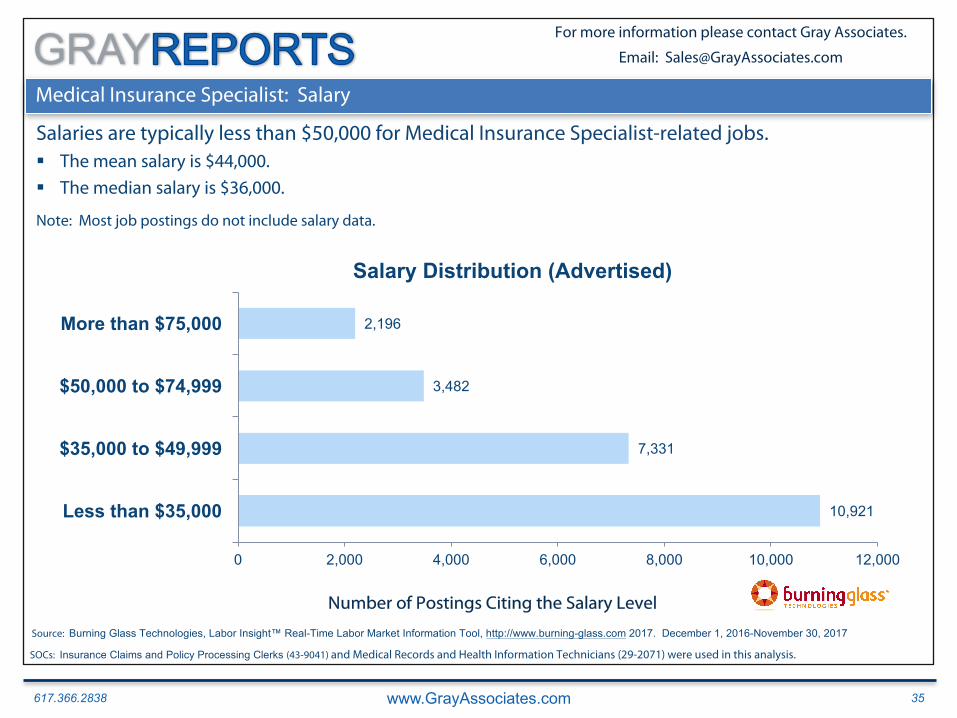
Medical Insurance Specialist: Salary
Salaries are typically less than $50,000 for Medical Insurance Specialist-related jobs.
10,921
7,331
3,482
2,196
0 2,000 4,000 6,000 8,000 10,000 12,000
Less than $35,000
$35,000 to $49,999
$50,000 to $74,999
More than $75,000
Salary Distribution (Advertised)
§ The mean salary is $44,000.
§ The median salary is $36,000.
Note: Most job postings do not include salary data.
Number of Postings Citing the Salary Level
Source: Burning Glass Technologies, Labor Insight™ Real-Time Labor Market Information Tool, http://www.burning-glass.com 2017. December 1, 2016-November 30, 2017
SOCs: Insurance Claims and Policy Processing Clerks (43-9041) and Medical Records and Health Information Technicians (29-2071) were used in this analysis.
617.366.2838 www.GrayAssociates.com 36
GRAY For more information please contact Gray Associates.
Email: [email protected]
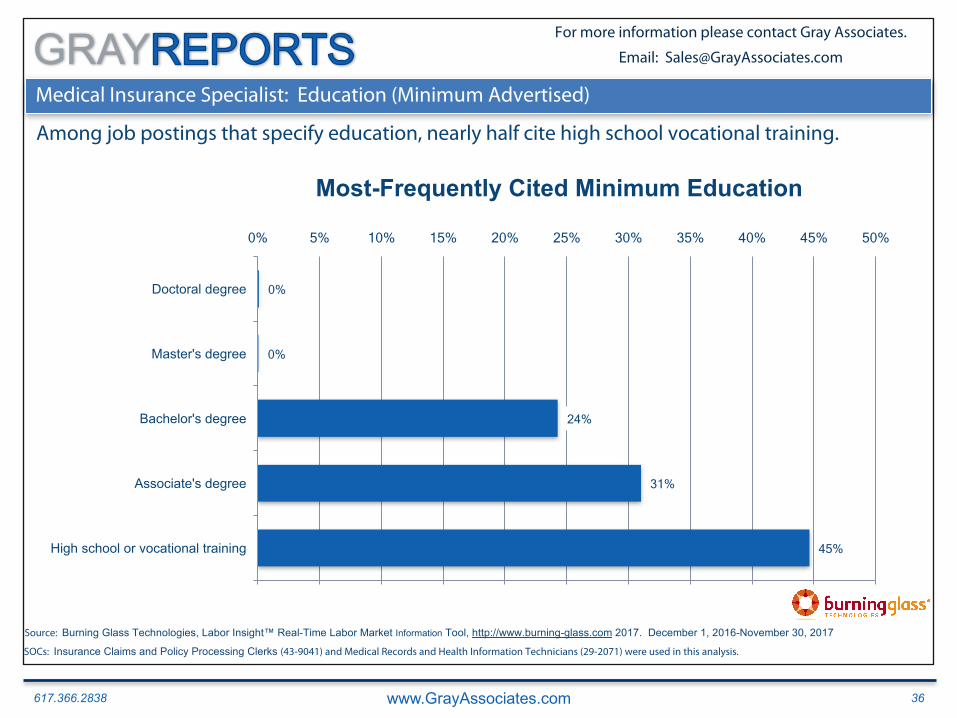
Medical Insurance Specialist: Education (Minimum Advertised)
Among job postings that specify education, nearly half cite high school vocational training.
45%
31%
24%
0%
0%
0% 5% 10% 15% 20% 25% 30% 35% 40% 45% 50%
High school or vocational training
Associate's degree
Bachelor's degree
Master's degree
Doctoral degree
Most-Frequently Cited Minimum Education
Source: Burning Glass Technologies, Labor Insight™ Real-Time Labor Market Information Tool, http://www.burning-glass.com 2017. December 1, 2016-November 30, 2017
SOCs: Insurance Claims and Policy Processing Clerks (43-9041) and Medical Records and Health Information Technicians (29-2071) were used in this analysis.
617.366.2838 www.GrayAssociates.com 37
GRAY For more information please contact Gray Associates.
Email: [email protected]
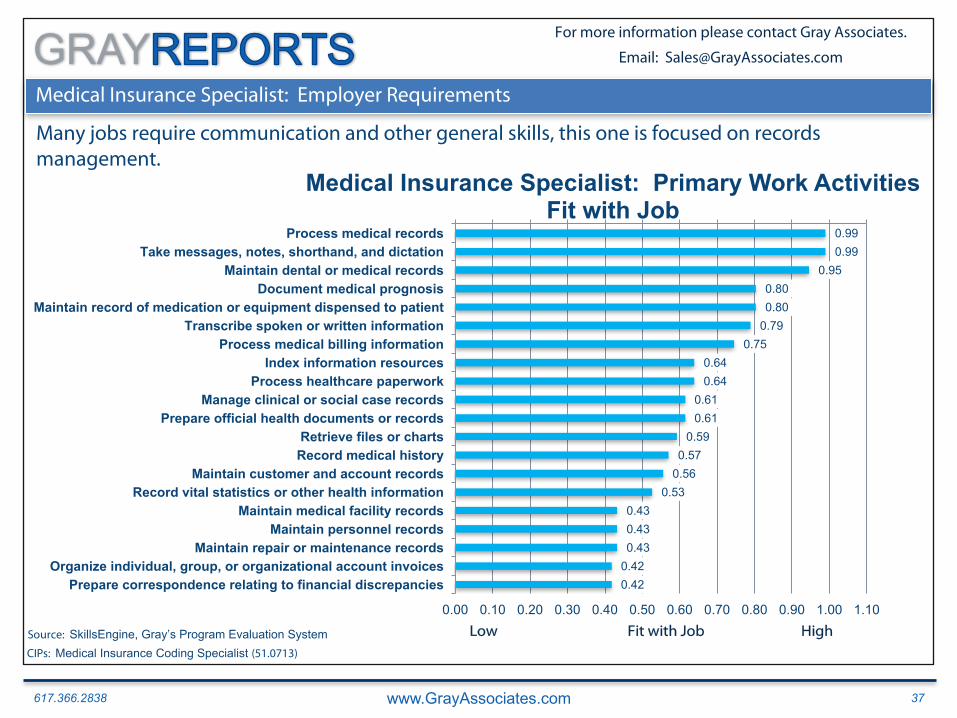
Medical Insurance Specialist: Employer Requirements
Many jobs require communication and other general skills, this one is focused on records management.
0.990.99
0.950.800.80
0.790.75
0.640.64
0.610.61
0.590.57
0.560.53
0.430.430.43
0.420.42
0.00 0.10 0.20 0.30 0.40 0.50 0.60 0.70 0.80 0.90 1.00 1.10
Process medical recordsTake messages, notes, shorthand, and dictation
Maintain dental or medical recordsDocument medical prognosis
Maintain record of medication or equipment dispensed to patientTranscribe spoken or written information
Process medical billing informationIndex information resources
Process healthcare paperworkManage clinical or social case records
Prepare official health documents or recordsRetrieve files or chartsRecord medical history
Maintain customer and account recordsRecord vital statistics or other health information
Maintain medical facility recordsMaintain personnel records
Maintain repair or maintenance recordsOrganize individual, group, or organizational account invoices
Prepare correspondence relating to financial discrepancies
Medical Insurance Specialist: Primary Work ActivitiesFit with Job
Low Fit with Job HighSource: SkillsEngine, Gray’s Program Evaluation SystemCIPs: Medical Insurance Coding Specialist (51.0713)

617.366.2838 www.GrayAssociates.com 38
GRAY For more information please contact Gray Associates.
Email: [email protected]
Medical Insurance Specialist: Tools Employees Need to Know
Medical Insurance Specialist workers need strong skills in office technology. § Microsoft Office comprises five of the 18 tools Medical Insurance Specialist workers need to know.
9999999999
76767676767676767676
737373
0 20 40 60 80 100 120
Healthcare common procedure coding system HCPCS softwareMicrosoft ExcelMicrosoft Word
Web browser softwareWord processing software
Desktop computersLaser facsimile machines
Medical condition coding softwareMedical procedure coding software
MEDITECH softwareMicrosoft Access
Microsoft Office softwareScanners
10-key calculatorsMicrosoft PowerPoint
Billing softwareElectronic medical record EMR software
Tablet computers
Medical Insurance SpecialistTools Employees Need to Know
Low Fit with Job HighSource: SkillsEngine, Gray’s Program Evaluation SystemCIPs: Medical Insurance Coding Specialist (51.0713)
617.366.2838 www.GrayAssociates.com 39
GRAY For more information please contact Gray Associates.
Email: [email protected]
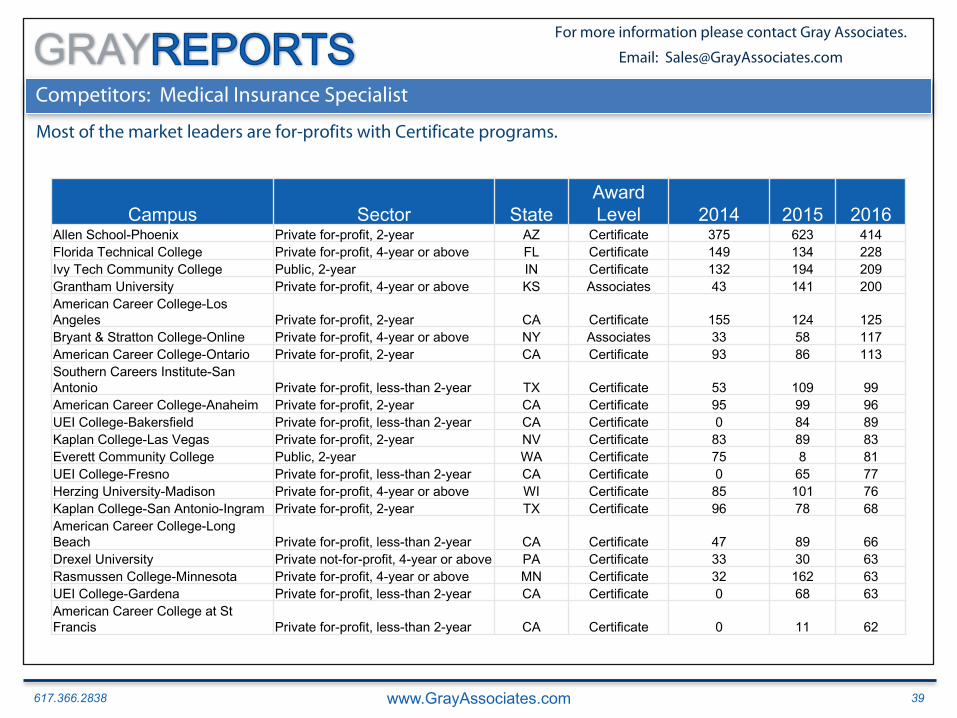
Competitors: Medical Insurance Specialist
Most of the market leaders are for-profits with Certificate programs.
Campus Sector StateAward Level 2014 2015 2016
Allen School-Phoenix Private for-profit, 2-year AZ Certificate 375 623 414Florida Technical College Private for-profit, 4-year or above FL Certificate 149 134 228Ivy Tech Community College Public, 2-year IN Certificate 132 194 209Grantham University Private for-profit, 4-year or above KS Associates 43 141 200American Career College-Los Angeles Private for-profit, 2-year CA Certificate 155 124 125Bryant & Stratton College-Online Private for-profit, 4-year or above NY Associates 33 58 117American Career College-Ontario Private for-profit, 2-year CA Certificate 93 86 113Southern Careers Institute-San Antonio Private for-profit, less-than 2-year TX Certificate 53 109 99American Career College-Anaheim Private for-profit, 2-year CA Certificate 95 99 96UEI College-Bakersfield Private for-profit, less-than 2-year CA Certificate 0 84 89Kaplan College-Las Vegas Private for-profit, 2-year NV Certificate 83 89 83Everett Community College Public, 2-year WA Certificate 75 8 81UEI College-Fresno Private for-profit, less-than 2-year CA Certificate 0 65 77Herzing University-Madison Private for-profit, 4-year or above WI Certificate 85 101 76Kaplan College-San Antonio-Ingram Private for-profit, 2-year TX Certificate 96 78 68American Career College-Long Beach Private for-profit, less-than 2-year CA Certificate 47 89 66Drexel University Private not-for-profit, 4-year or above PA Certificate 33 30 63Rasmussen College-Minnesota Private for-profit, 4-year or above MN Certificate 32 162 63UEI College-Gardena Private for-profit, less-than 2-year CA Certificate 0 68 63American Career College at St Francis Private for-profit, less-than 2-year CA Certificate 0 11 62
617.366.2838 www.GrayAssociates.com 40
GRAY For more information please contact Gray Associates.
Email: [email protected]
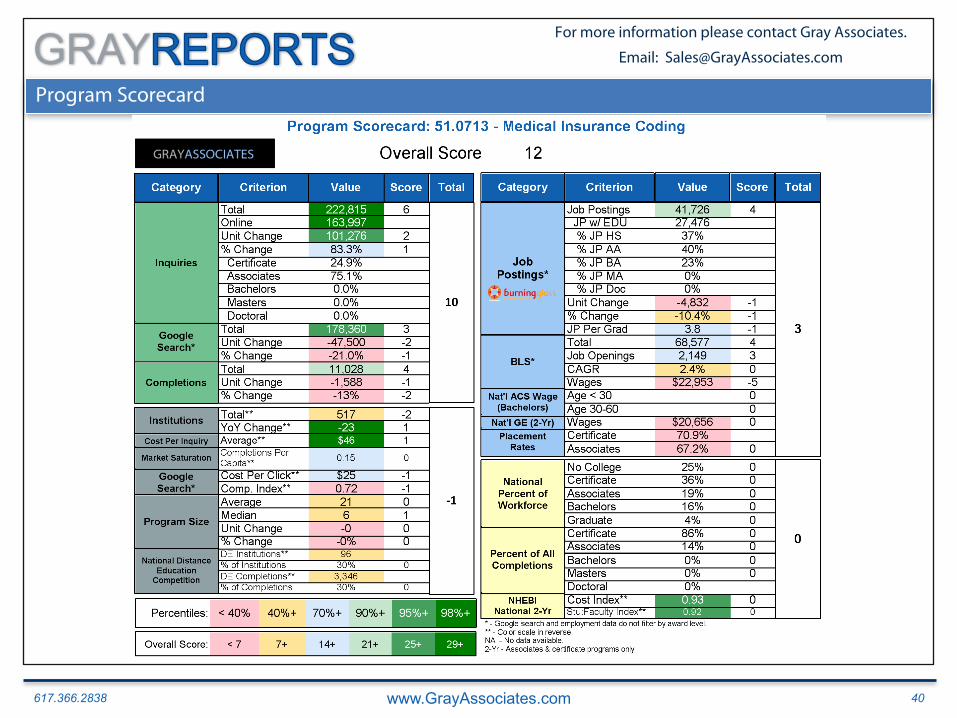
Program Scorecard
617.366.2838 www.GrayAssociates.com 41
GRAY For more information please contact Gray Associates.
Email: [email protected]
Agenda
1. Student Demand Trends: Inquiries, Conversions, and Searches
1. National
2. Online and On-Campus
3. Degree Level
4. City and Program
2. Emerging Programs
3. Program of the Month: Medical Insurance Specialist
4. Summary
617.366.2838 www.GrayAssociates.com 42
GRAY For more information please contact Gray Associates.
Email: [email protected]
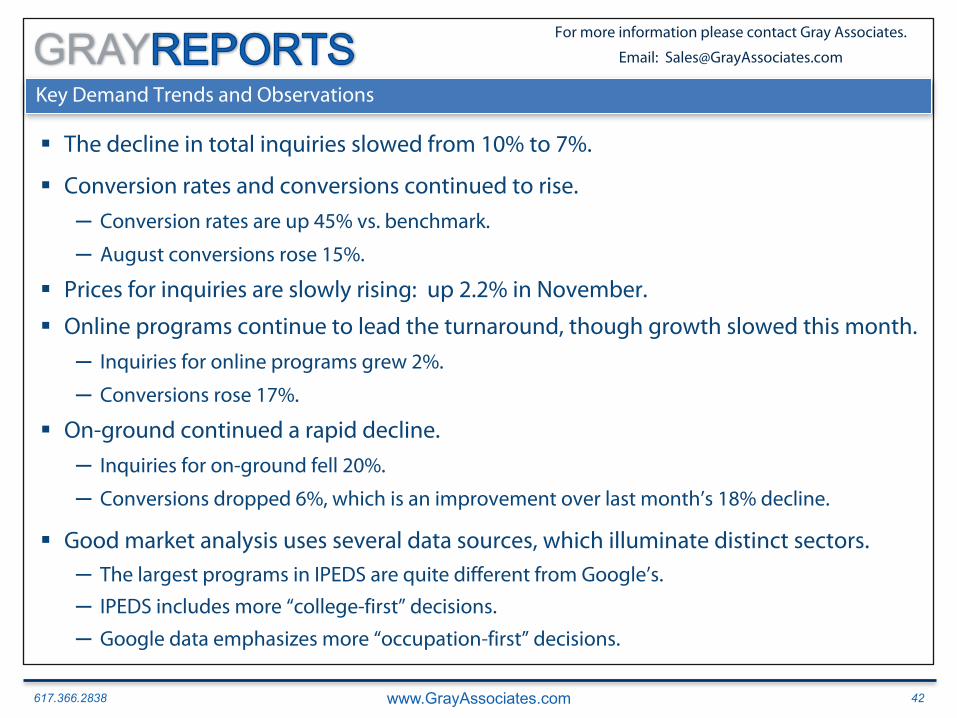
Key Demand Trends and Observations
§ The decline in total inquiries slowed from 10% to 7%.
§ Conversion rates and conversions continued to rise.
─ Conversion rates are up 45% vs. benchmark.
─ August conversions rose 15%.
§ Prices for inquiries are slowly rising: up 2.2% in November.
§ Online programs continue to lead the turnaround, though growth slowed this month.
─ Inquiries for online programs grew 2%.
─ Conversions rose 17%.
§ On-ground continued a rapid decline.
─ Inquiries for on-ground fell 20%.
─ Conversions dropped 6%, which is an improvement over last month’s 18% decline.
§ Good market analysis uses several data sources, which illuminate distinct sectors.─ The largest programs in IPEDS are quite different from Google’s.
─ IPEDS includes more “college-first” decisions.
─ Google data emphasizes more “occupation-first” decisions.
617.366.2838 www.GrayAssociates.com 43
GRAY For more information please contact Gray Associates.
Email: [email protected]
Questions and Contacts
Please feel free to contact:Bob Atkins
CEOGray Associates, Inc.
[email protected]@Gray_Associates
617.366.2836

617.366.2838 www.GrayAssociates.com 44
GRAY For more information please contact Gray Associates.
Email: [email protected]
Upcoming Gray Associates’ Webcast
Please join us next month!
January Webcast(December Results)
Wednesday, January 25th at 2:00 PM ET