2014 february grayreports - student semand trends
TRANSCRIPT

GRAYREPORTS Demand for Educational Programs
www.GrayAssociates.com
Results through February 2014
617.401.7662 www.GrayAssociates.com 2
GRAYFor more information please contact Bob Atkins.
Email: [email protected]
Contents
1. About Gray and GrayReports
2. National Overview of Inquiry Volumes
3. Trends by City and Program
4. Example of Local Analysis: Greater Miami
5. Question and Answer
617.401.7662 www.GrayAssociates.com 3
GRAYFor more information please contact Bob Atkins.
Email: [email protected]
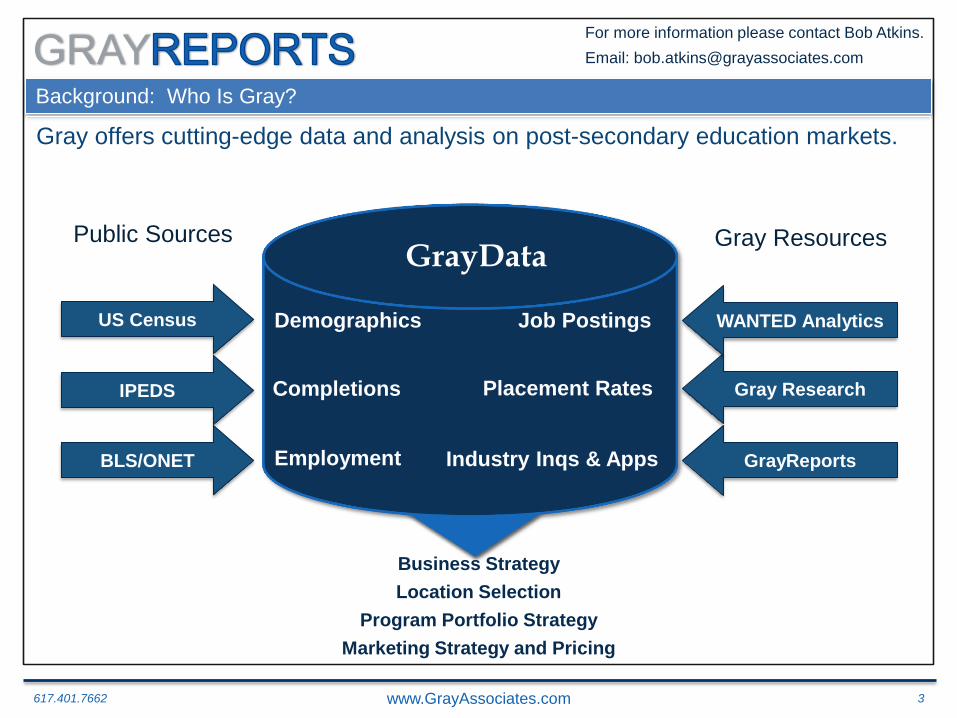
Background: Who Is Gray?
Gray offers cutting-edge data and analysis on post-secondary education markets.
GrayReports
Completions
Employment
GrayData
Placement Rates
Industry Inqs & Apps
Demographics
BLS/ONET
Business Strategy
Location Selection
Program Portfolio Strategy
Marketing Strategy and Pricing
Gray Research
Job Postings
IPEDS
US Census WANTED Analytics
Public Sources Public Sources Gray Resources

617.401.7662 www.GrayAssociates.com 4
GRAYFor more information please contact Bob Atkins.
Email: [email protected]
Background: What is GrayReports?
Over 30 million qualified inquiries
January 2012 to the present
~1.0 million new inquiries per month
149 programs with over 10,000 inquiries
257 cities with over 10,000 inquiries
617.401.7662 www.GrayAssociates.com 5
GRAYFor more information please contact Bob Atkins.
Email: [email protected]
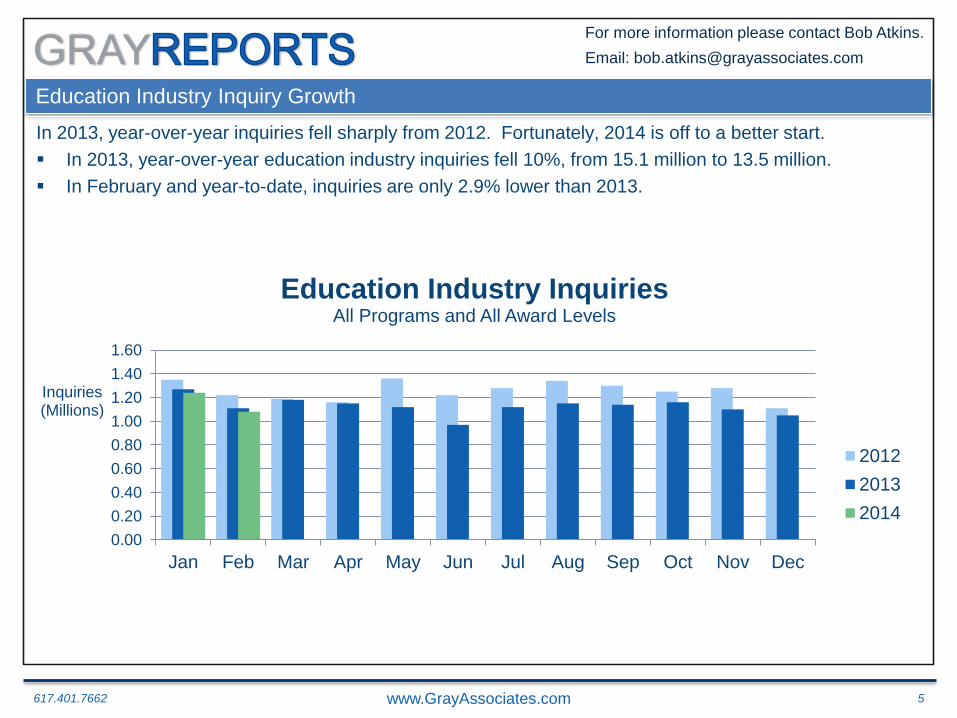
Education Industry Inquiry Growth
In 2013, year-over-year inquiries fell sharply from 2012. Fortunately, 2014 is off to a better start.
In 2013, year-over-year education industry inquiries fell 10%, from 15.1 million to 13.5 million.
In February and year-to-date, inquiries are only 2.9% lower than 2013.
2012
0.00
0.20
0.40
0.60
0.80
1.00
1.20
1.40
1.60
Jan Feb Mar Apr May Jun Jul Aug Sep Oct Nov Dec
Inquiries (Millions)
Education Industry Inquiries All Programs and All Award Levels
2012
2013
2014
617.401.7662 www.GrayAssociates.com 6
GRAYFor more information please contact Bob Atkins.
Email: [email protected]
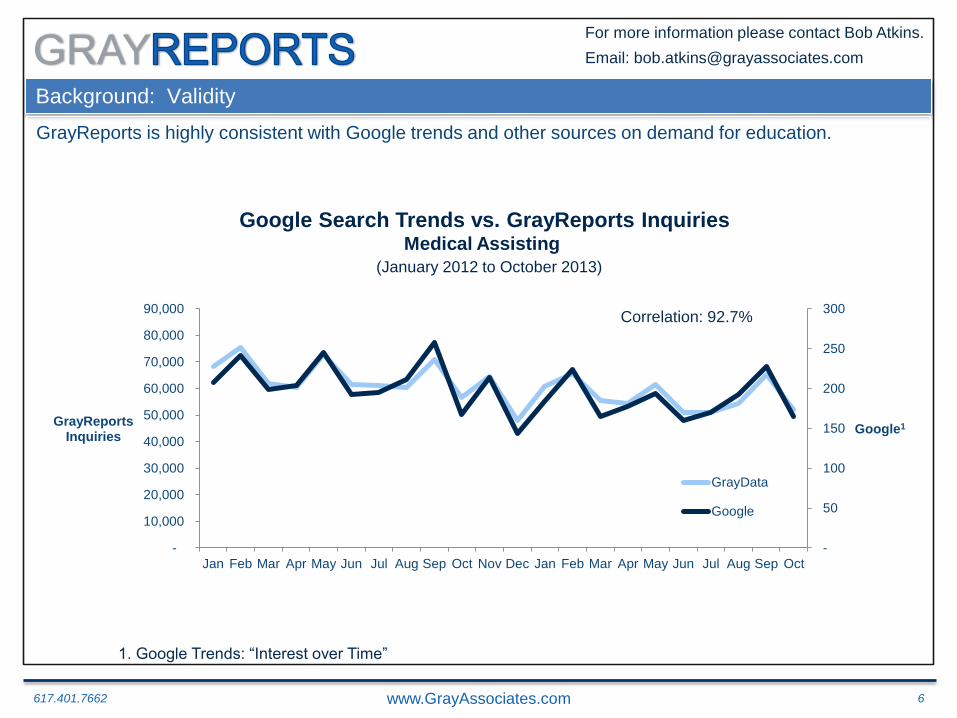
Background: Validity
GrayReports is highly consistent with Google trends and other sources on demand for education.
-
50
100
150
200
250
300
-
10,000
20,000
30,000
40,000
50,000
60,000
70,000
80,000
90,000
Jan Feb Mar Apr May Jun Jul Aug Sep Oct Nov Dec Jan Feb Mar Apr May Jun Jul Aug Sep Oct
Google1 GrayReports
Inquiries
GrayData
Google Search Trends vs. GrayReports Inquiries Medical Assisting
(January 2012 to October 2013)
1. Google Trends: “Interest over Time”
Correlation: 92.7%
617.401.7662 www.GrayAssociates.com 7
GRAYFor more information please contact Bob Atkins.
Email: [email protected]
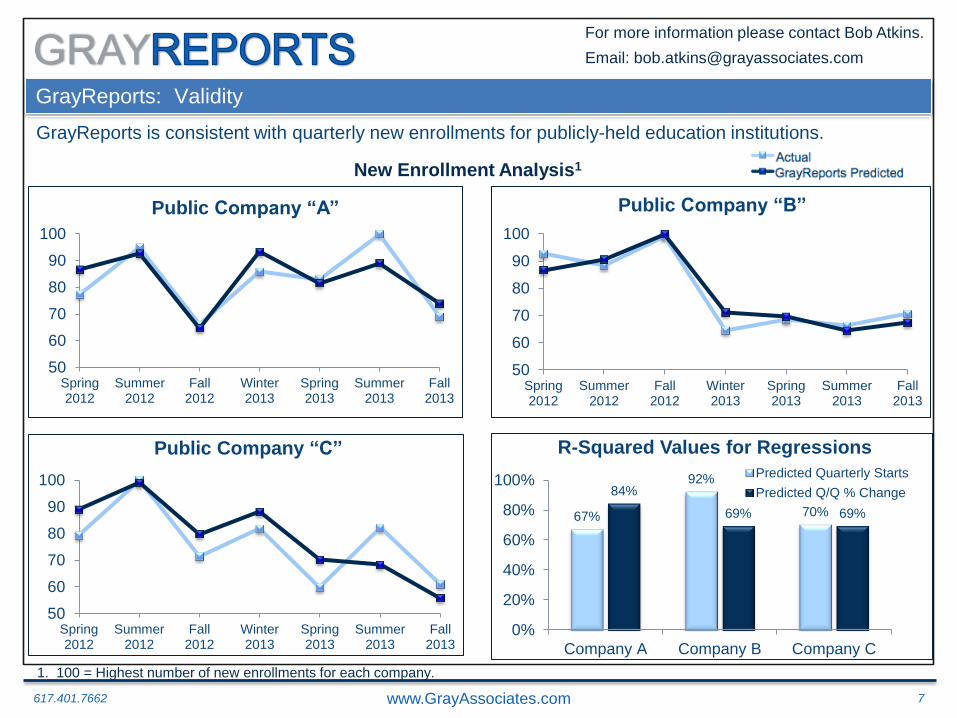
GrayReports: Validity
GrayReports is consistent with quarterly new enrollments for publicly-held education institutions.
50
60
70
80
90
100
Spring2012
Summer2012
Fall2012
Winter2013
Spring2013
Summer2013
Fall2013
Public Company “A”
50
60
70
80
90
100
Spring2012
Summer2012
Fall2012
Winter2013
Spring2013
Summer2013
Fall2013
Public Company “B”
50
60
70
80
90
100
Spring2012
Summer2012
Fall2012
Winter2013
Spring2013
Summer2013
Fall2013
Public Company “C”
New Enrollment Analysis1
67%
92%
70%
84%
69% 69%
0%
20%
40%
60%
80%
100%
Company A Company B Company C
R-Squared Values for Regressions
Predicted Quarterly Starts
Predicted Q/Q % Change
1. 100 = Highest number of new enrollments for each company.
617.401.7662 www.GrayAssociates.com 8
GRAYFor more information please contact Bob Atkins.
Email: [email protected]
0%
10%
20%
30%
40%
50%
60%
70%
Jan Feb Mar Apr May Jun Jul Aug Sep Oct Nov Dec
Percent On-line
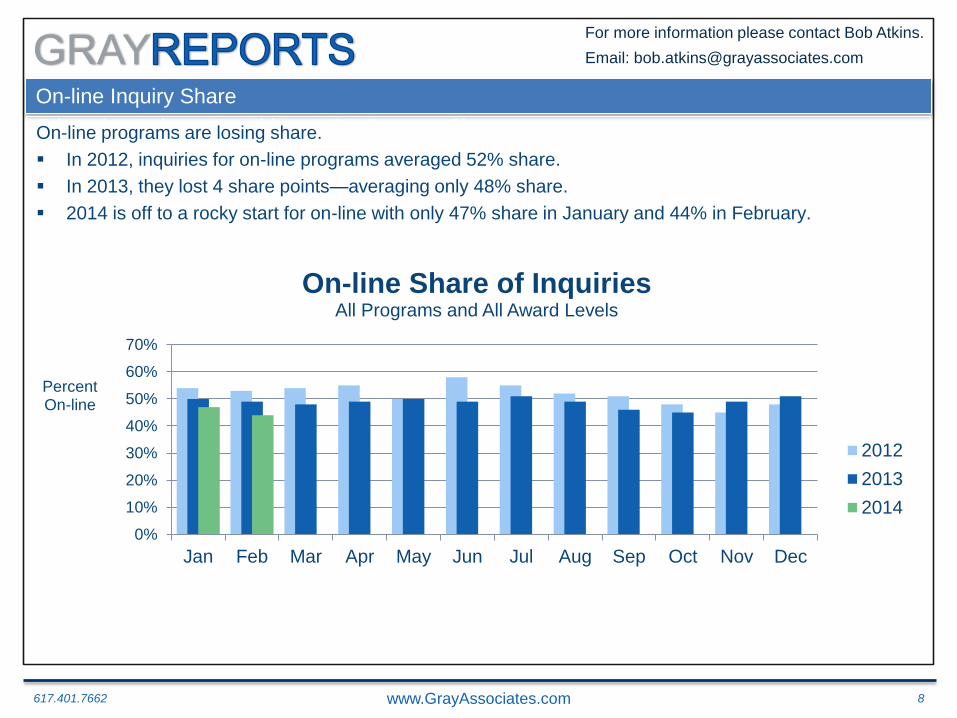
On-line Share of Inquiries All Programs and All Award Levels
2012
2013
2014
On-line Inquiry Share
Education Industry Inquiries: YOY Percent Change On-line programs are losing share.
In 2012, inquiries for on-line programs averaged 52% share.
In 2013, they lost 4 share points—averaging only 48% share.
2014 is off to a rocky start for on-line with only 47% share in January and 44% in February.
617.401.7662 www.GrayAssociates.com 9
GRAYFor more information please contact Bob Atkins.
Email: [email protected]
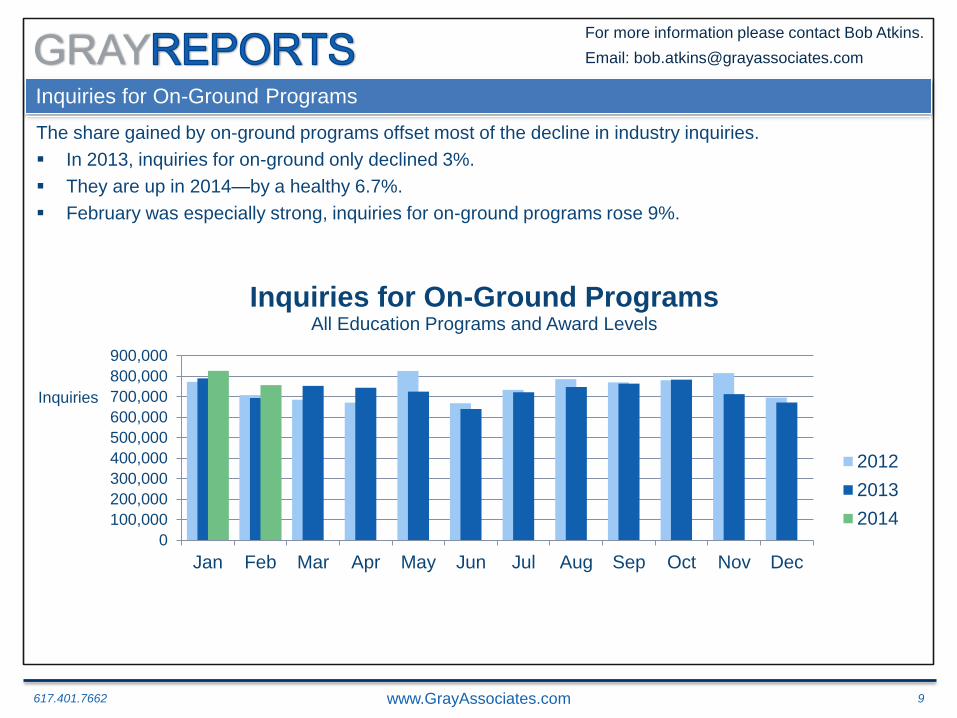
Inquiries for On-Ground Programs
The share gained by on-ground programs offset most of the decline in industry inquiries.
In 2013, inquiries for on-ground only declined 3%.
They are up in 2014—by a healthy 6.7%.
February was especially strong, inquiries for on-ground programs rose 9%.
2012
0
100,000
200,000
300,000
400,000
500,000
600,000
700,000
800,000
900,000
Jan Feb Mar Apr May Jun Jul Aug Sep Oct Nov Dec
Inquiries
Inquiries for On-Ground Programs All Education Programs and Award Levels
2012
2013
2014
617.401.7662 www.GrayAssociates.com 10
GRAYFor more information please contact Bob Atkins.
Email: [email protected]
2.7
%
2.3
%
2.3
%
2.4
%
2.5
%
2.6
%
2.5
% 2
.9%
2.6
%
2.5
%
2.1
%
2.3
%
2.8
%
2.6
%
2.9
%
2.7
%
2.8
% 3
.3%
3.1
%
3.0
%
2.7
%
2.8
%
2.6
%
2.5
%
2.3
%
1.2
%
0.0%
0.5%
1.0%
1.5%
2.0%
2.5%
3.0%
3.5%
Jan Feb Mar Apr May Jun Jul Aug Sep Oct Nov Dec
Applic
ation R
ate
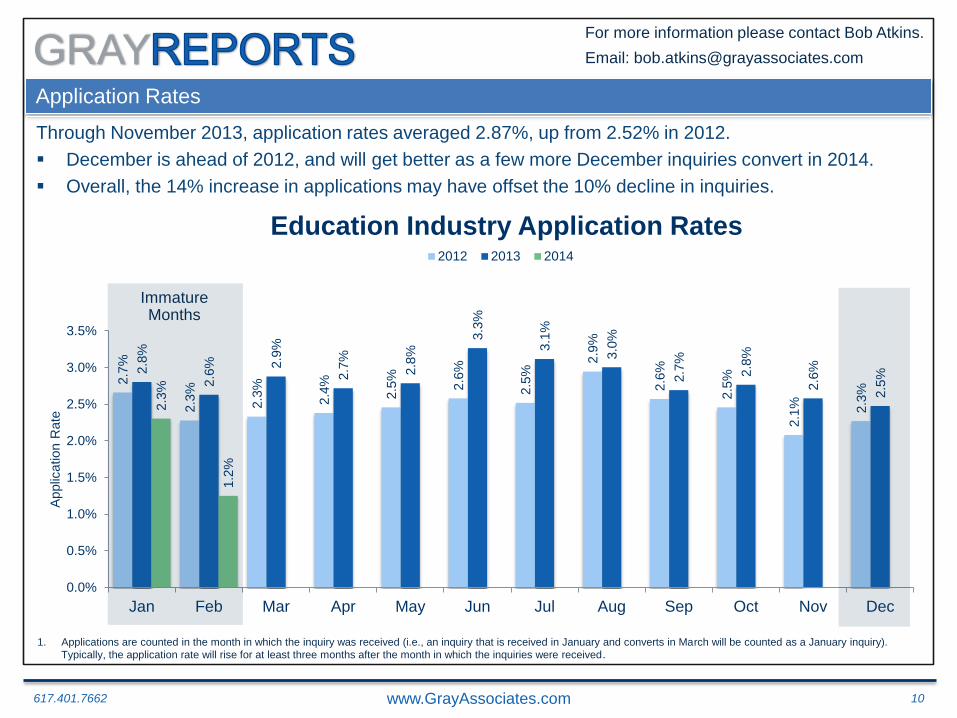
Education Industry Application Rates 2012 2013 2014
Application Rates
Immature Months
Through November 2013, application rates averaged 2.87%, up from 2.52% in 2012.
December is ahead of 2012, and will get better as a few more December inquiries convert in 2014.
Overall, the 14% increase in applications may have offset the 10% decline in inquiries.
1. Applications are counted in the month in which the inquiry was received (i.e., an inquiry that is received in January and converts in March will be counted as a January inquiry).
Typically, the application rate will rise for at least three months after the month in which the inquiries were received.
617.401.7662 www.GrayAssociates.com 11
GRAYFor more information please contact Bob Atkins.
Email: [email protected]
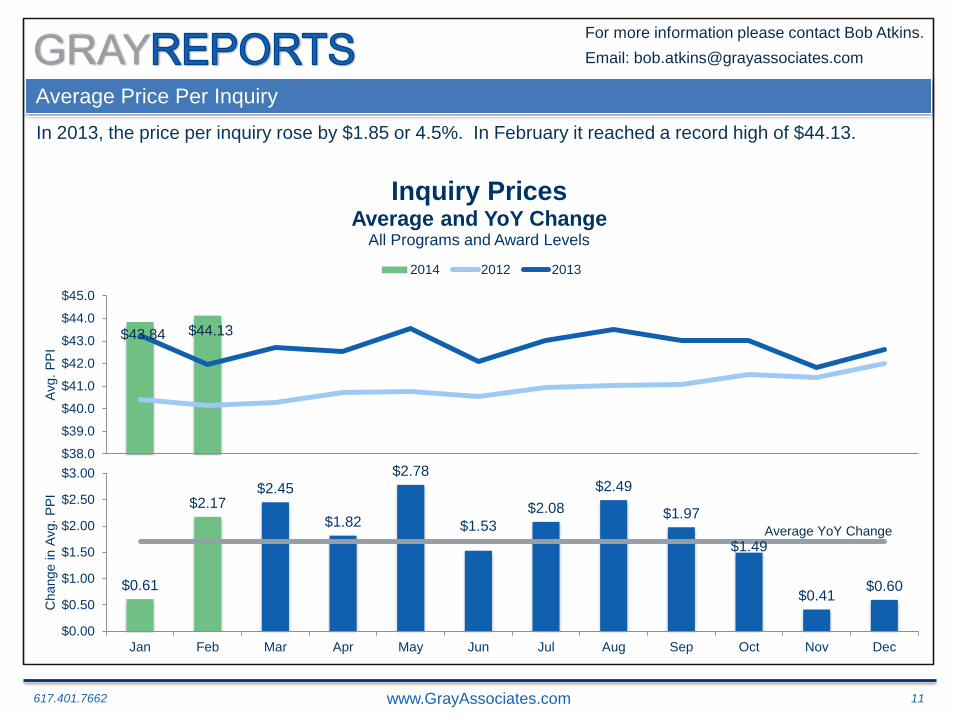
Average Price Per Inquiry
In 2013, the price per inquiry rose by $1.85 or 4.5%. In February it reached a record high of $44.13.
$38.0
$39.0
$40.0
$41.0
$42.0
$43.0
$44.0
$45.0
Avg.
PP
I
Inquiry Prices Average and YoY Change
All Programs and Award Levels
2014 2012 2013
$0.61
$2.17 $2.45
$1.82
$2.78
$1.53
$2.08
$2.49
$1.97
$1.49
$0.41 $0.60
$0.00
$0.50
$1.00
$1.50
$2.00
$2.50
$3.00
Jan Feb Mar Apr May Jun Jul Aug Sep Oct Nov Dec
Change in A
vg.
PP
I
Average YoY Change
$43.84 $44.13
617.401.7662 www.GrayAssociates.com 12
GRAYFor more information please contact Bob Atkins.
Email: [email protected]
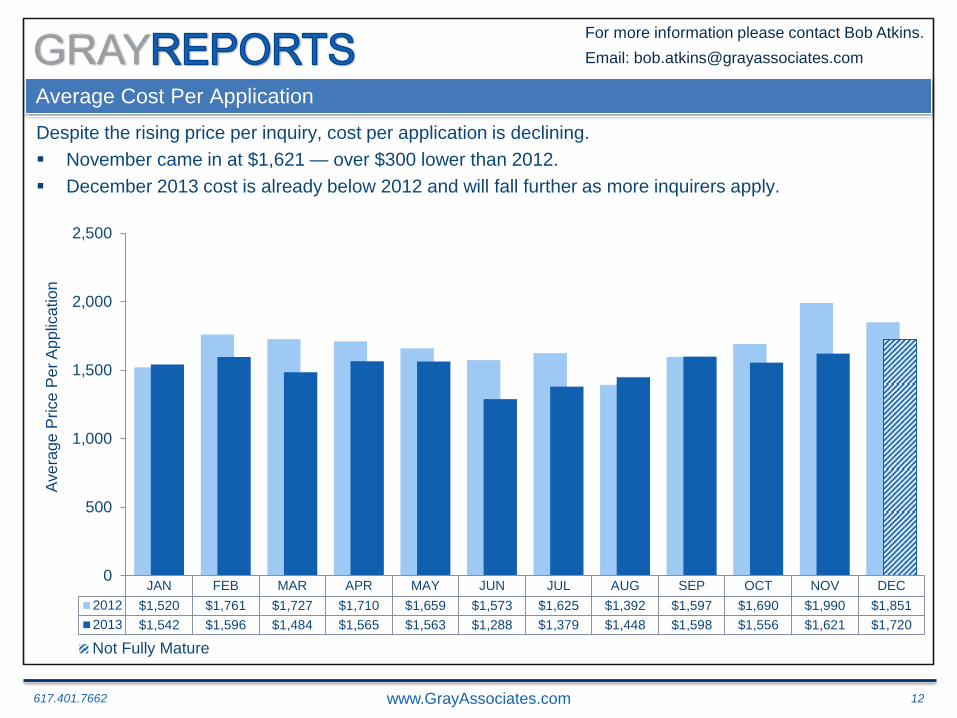
Average Cost Per Application
Despite the rising price per inquiry, cost per application is declining.
November came in at $1,621 — over $300 lower than 2012.
December 2013 cost is already below 2012 and will fall further as more inquirers apply.
JAN FEB MAR APR MAY JUN JUL AUG SEP OCT NOV DEC
2012 $1,520 $1,761 $1,727 $1,710 $1,659 $1,573 $1,625 $1,392 $1,597 $1,690 $1,990 $1,851
2013 $1,542 $1,596 $1,484 $1,565 $1,563 $1,288 $1,379 $1,448 $1,598 $1,556 $1,621 $1,720
0
500
1,000
1,500
2,000
2,500
Ave
rage
Price
Pe
r A
pp
lica
tio
n
Not Fully Mature
617.401.7662 www.GrayAssociates.com 13
GRAYFor more information please contact Bob Atkins.
Email: [email protected]
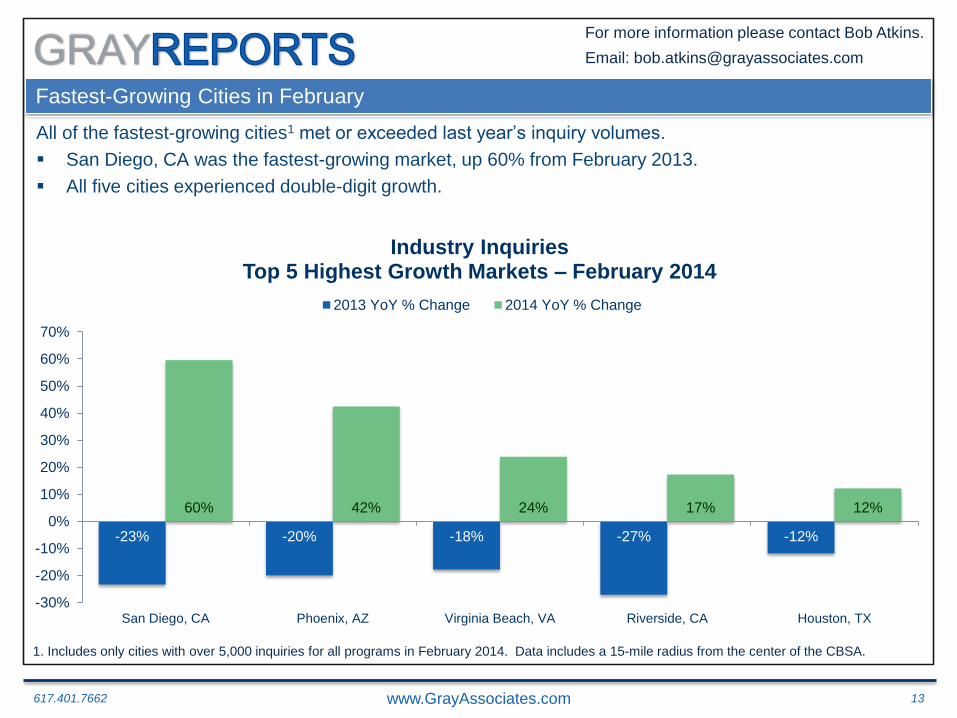
Fastest-Growing Cities in February
All of the fastest-growing cities1 met or exceeded last year’s inquiry volumes.
San Diego, CA was the fastest-growing market, up 60% from February 2013.
All five cities experienced double-digit growth.
-23% -20% -18% -27% -12%
60% 42% 24% 17% 12%
-30%
-20%
-10%
0%
10%
20%
30%
40%
50%
60%
70%
San Diego, CA Phoenix, AZ Virginia Beach, VA Riverside, CA Houston, TX
Industry Inquiries Top 5 Highest Growth Markets – February 2014
2013 YoY % Change 2014 YoY % Change
1. Includes only cities with over 5,000 inquiries for all programs in February 2014. Data includes a 15-mile radius from the center of the CBSA.
617.401.7662 www.GrayAssociates.com 14
GRAYFor more information please contact Bob Atkins.
Email: [email protected]
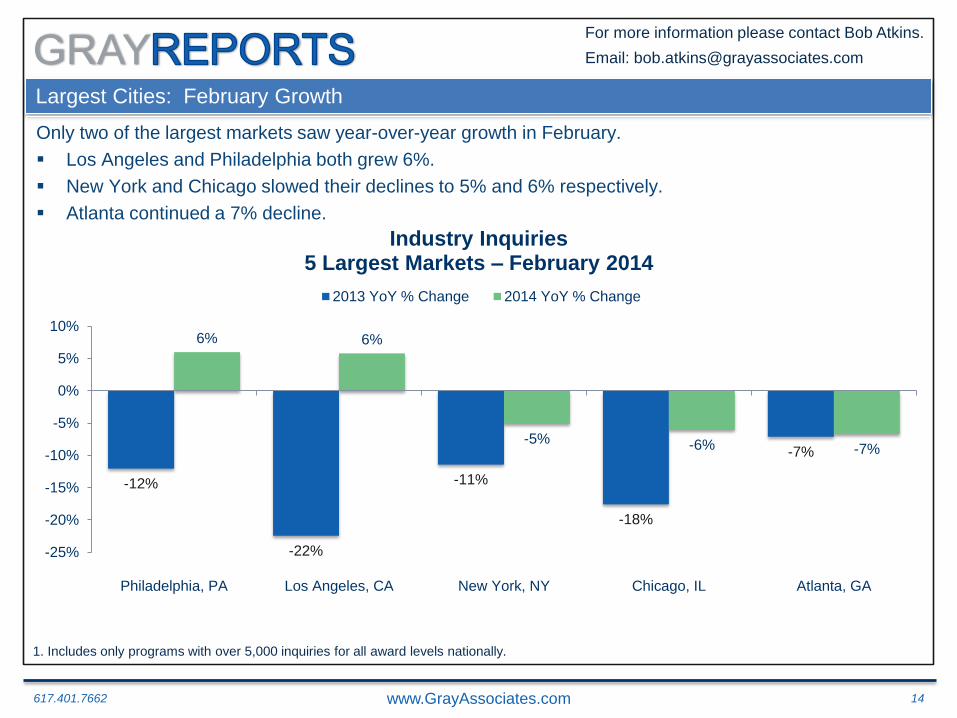
Largest Cities: February Growth
Only two of the largest markets saw year-over-year growth in February.
Los Angeles and Philadelphia both grew 6%.
New York and Chicago slowed their declines to 5% and 6% respectively.
Atlanta continued a 7% decline.
-12%
-22%
-11%
-18%
-7%
6% 6%
-5% -6% -7%
-25%
-20%
-15%
-10%
-5%
0%
5%
10%
Philadelphia, PA Los Angeles, CA New York, NY Chicago, IL Atlanta, GA
Industry Inquiries 5 Largest Markets – February 2014
2013 YoY % Change 2014 YoY % Change
1. Includes only programs with over 5,000 inquiries for all award levels nationally.
617.401.7662 www.GrayAssociates.com 15
GRAYFor more information please contact Bob Atkins.
Email: [email protected]
Fastest Growing Programs in February
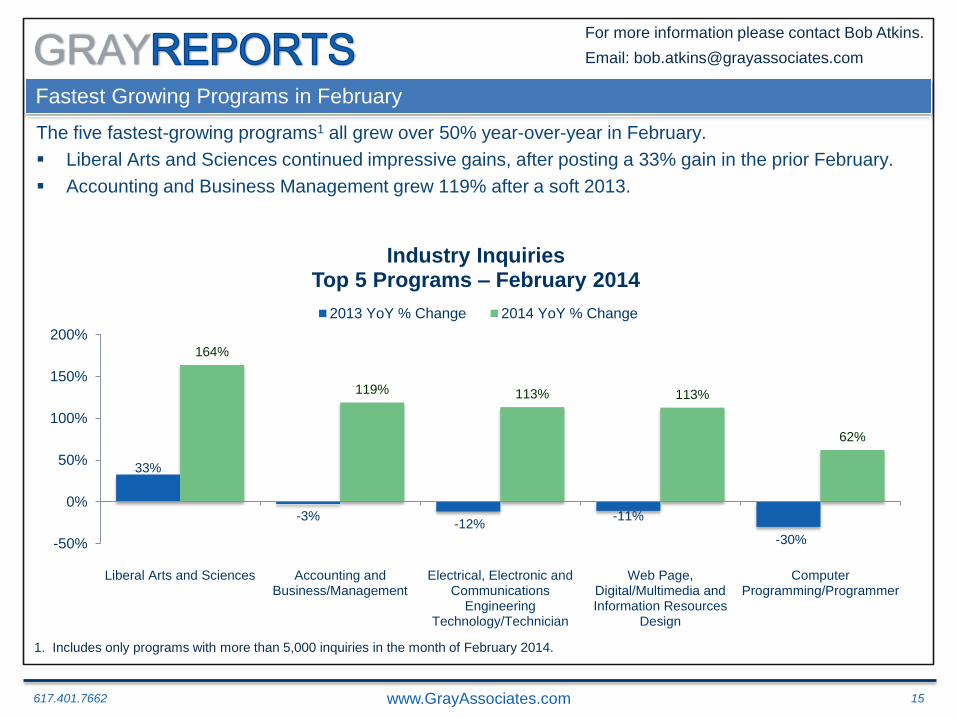
The five fastest-growing programs1 all grew over 50% year-over-year in February.
Liberal Arts and Sciences continued impressive gains, after posting a 33% gain in the prior February.
Accounting and Business Management grew 119% after a soft 2013.
33%
-3% -12%
-11%
-30%
164%
119% 113% 113%
62%
-50%
0%
50%
100%
150%
200%
Liberal Arts and Sciences Accounting andBusiness/Management
Electrical, Electronic andCommunications
EngineeringTechnology/Technician
Web Page,Digital/Multimedia andInformation Resources
Design
ComputerProgramming/Programmer
Industry Inquiries Top 5 Programs – February 2014
2013 YoY % Change 2014 YoY % Change
1. Includes only programs with more than 5,000 inquiries in the month of February 2014.
617.401.7662 www.GrayAssociates.com 16
GRAYFor more information please contact Bob Atkins.
Email: [email protected]
Largest Programs, February Growth
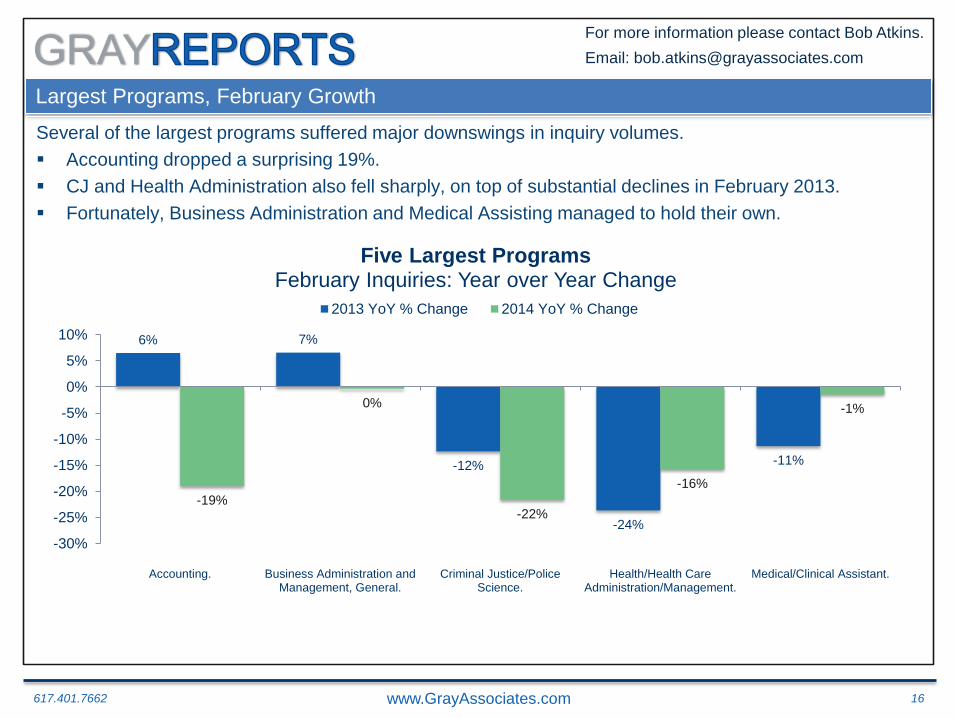
Several of the largest programs suffered major downswings in inquiry volumes.
Accounting dropped a surprising 19%.
CJ and Health Administration also fell sharply, on top of substantial declines in February 2013.
Fortunately, Business Administration and Medical Assisting managed to hold their own.
6% 7%
-12%
-24%
-11%
-19%
0%
-22%
-16%
-1%
-30%
-25%
-20%
-15%
-10%
-5%
0%
5%
10%
Accounting. Business Administration andManagement, General.
Criminal Justice/PoliceScience.
Health/Health CareAdministration/Management.
Medical/Clinical Assistant.
Five Largest Programs February Inquiries: Year over Year Change
2013 YoY % Change 2014 YoY % Change
617.401.7662 www.GrayAssociates.com 17
GRAYFor more information please contact Bob Atkins.
Email: [email protected]
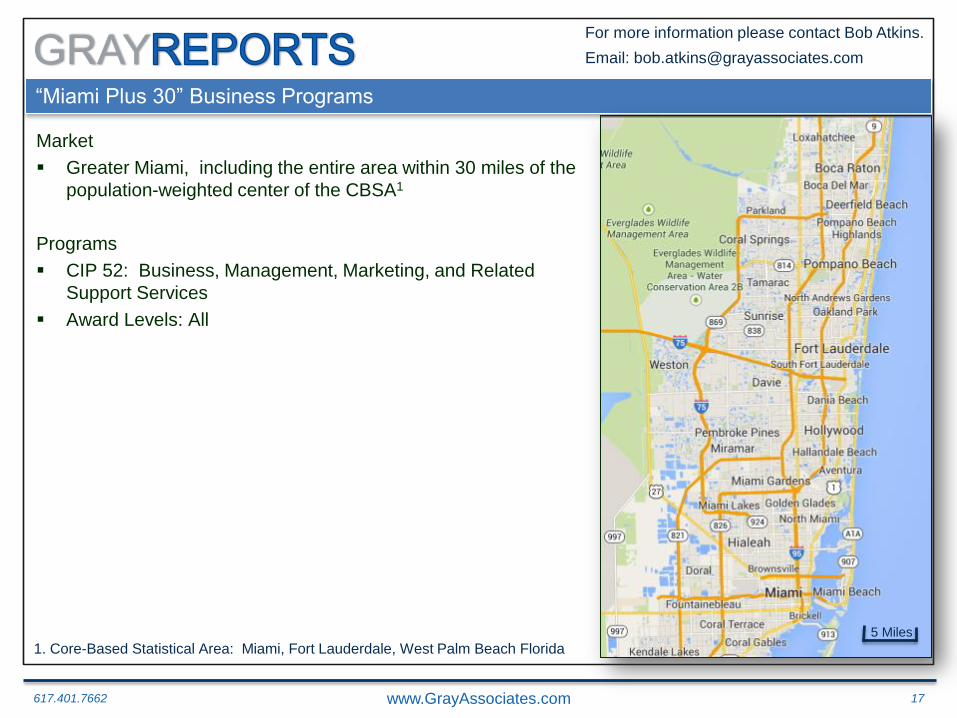
“Miami Plus 30” Business Programs
Market
Greater Miami, including the entire area within 30 miles of the
population-weighted center of the CBSA1
Programs
CIP 52: Business, Management, Marketing, and Related
Support Services
Award Levels: All
5 Miles
1. Core-Based Statistical Area: Miami, Fort Lauderdale, West Palm Beach Florida
617.401.7662 www.GrayAssociates.com 18
GRAYFor more information please contact Bob Atkins.
Email: [email protected]
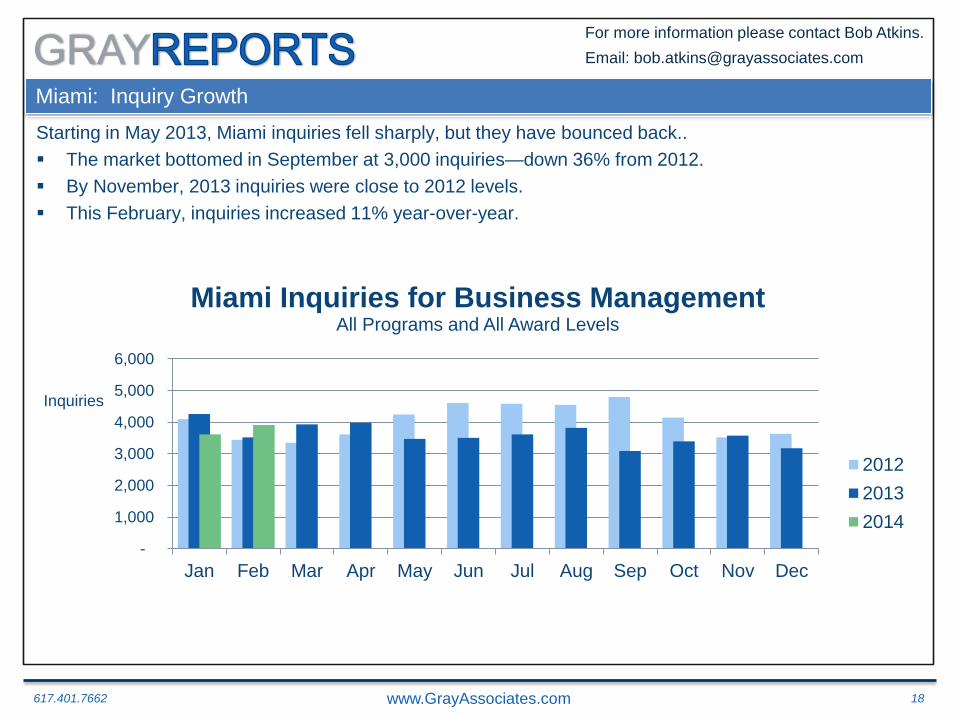
Miami: Inquiry Growth
Starting in May 2013, Miami inquiries fell sharply, but they have bounced back..
The market bottomed in September at 3,000 inquiries—down 36% from 2012.
By November, 2013 inquiries were close to 2012 levels.
This February, inquiries increased 11% year-over-year.
2012
-
1,000
2,000
3,000
4,000
5,000
6,000
Jan Feb Mar Apr May Jun Jul Aug Sep Oct Nov Dec
Inquiries
Miami Inquiries for Business Management All Programs and All Award Levels
2012
2013
2014
617.401.7662 www.GrayAssociates.com 19
GRAYFor more information please contact Bob Atkins.
Email: [email protected]
1.0
%
1.1
%
0.7
%
1.1
%
0.9
%
0.9
%
0.8
%
1.5
%
1.0
%
1.4
%
0.9
%
1.4
%
1.2
%
1.8
%
1.9
%
2.0
%
1.4
%
1.5
%
2.1
%
1.3
% 1.6
%
1.7
%
2.1
%
1.8
%
1.3
%
0.7
%
0.0%
0.5%
1.0%
1.5%
2.0%
2.5%
Jan Feb Mar Apr May Jun Jul Aug Sep Oct Nov Dec
Applic
ation R
ate
Miami Application Rates All Programs and Award Levels
2012 2013 2014
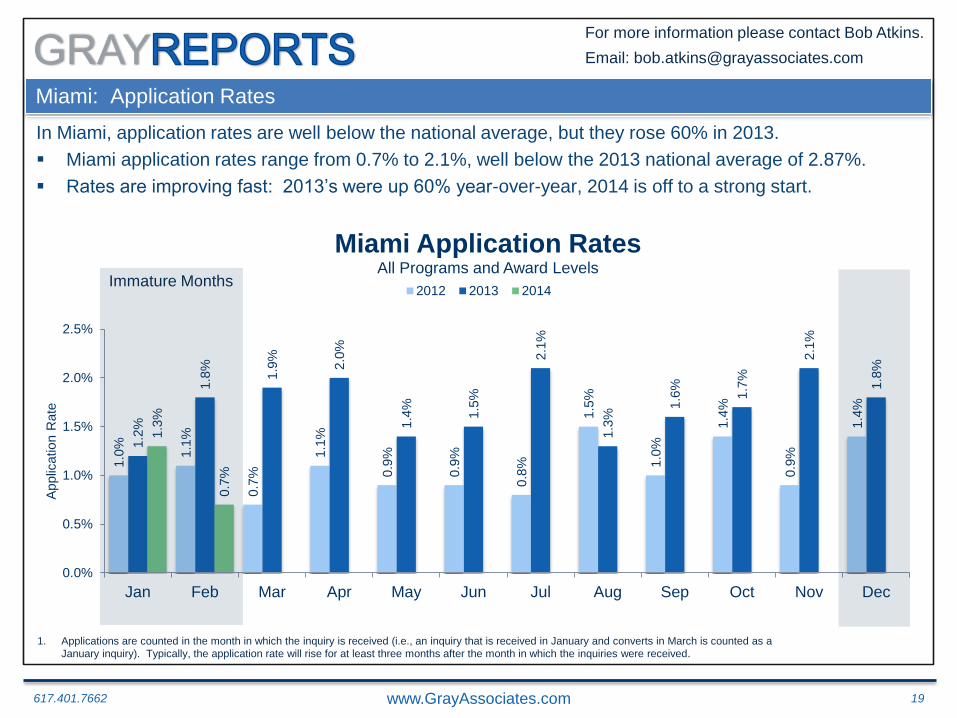
Miami: Application Rates
In Miami, application rates are well below the national average, but they rose 60% in 2013.
Miami application rates range from 0.7% to 2.1%, well below the 2013 national average of 2.87%.
Rates are improving fast: 2013’s were up 60% year-over-year, 2014 is off to a strong start.
1. Applications are counted in the month in which the inquiry is received (i.e., an inquiry that is received in January and converts in March is counted as a
January inquiry). Typically, the application rate will rise for at least three months after the month in which the inquiries were received.
Immature Months

617.401.7662 www.GrayAssociates.com 20
GRAYFor more information please contact Bob Atkins.
Email: [email protected]
Miami: Average Price Per Inquiry
Price rose sharply in Miami for Business inquiries--February prices jumped over $5.00.
$47.00
$45.74
$36.0
$38.0
$40.0
$42.0
$44.0
$46.0
$48.0
Avg.
PP
I
Average Price Per Inquiry and YoY Change All Programs and Award Levels
2014 2012 2013
$3.21
$1.53 $1.33
-$0.36
$5.24 $4.85 $4.55
$3.40
$1.80 $2.43
$4.30
$5.38
-$1.00
$0.00
$1.00
$2.00
$3.00
$4.00
$5.00
$6.00
Ma
rch
April
Ma
y
June
July
Augu
st
Septe
mb
er
Octo
be
r
No
ve
mbe
r
De
ce
mbe
r
Janu
ary
Feb
ruary
Change in A
vg.
PP
I
Average YoY Change
617.401.7662 www.GrayAssociates.com 21
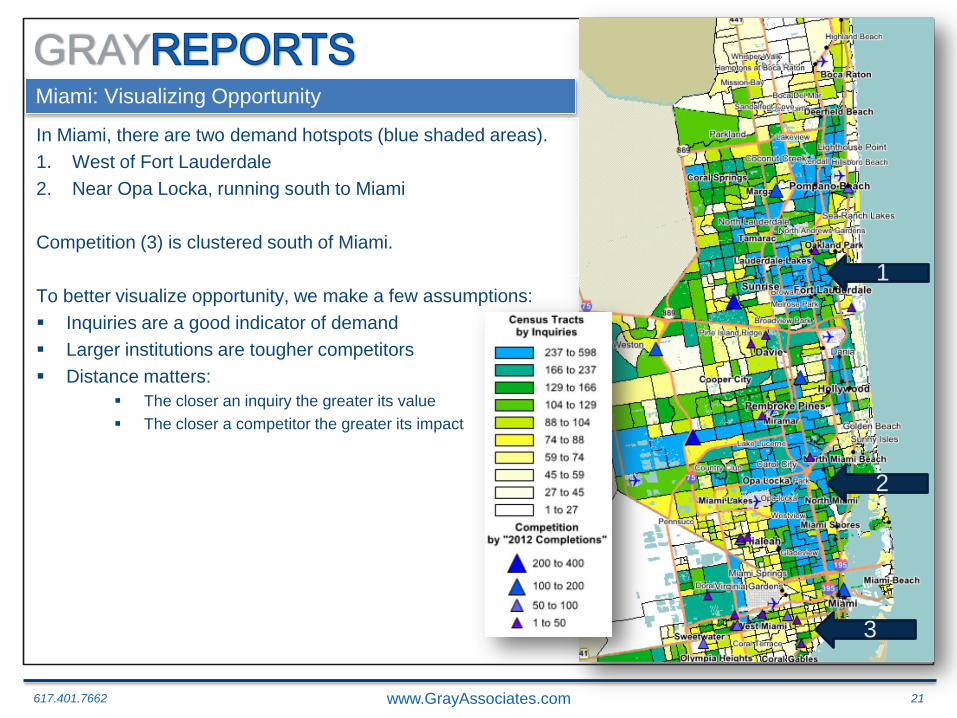
GRAYMiami: Visualizing Opportunity
In Miami, there are two demand hotspots (blue shaded areas).
1. West of Fort Lauderdale
2. Near Opa Locka, running south to Miami
Competition (3) is clustered south of Miami.
To better visualize opportunity, we make a few assumptions:
Inquiries are a good indicator of demand
Larger institutions are tougher competitors
Distance matters:
The closer an inquiry the greater its value
The closer a competitor the greater its impact
2
1
3

617.401.7662 www.GrayAssociates.com 22
GRAYMax Distance Adjusted Demand Index (Max DADI)
We use a simple demand index—Max DADI:
Inquiries from each tract
Weighted by distance to every other tract
This visualization highlights areas that are closest to the most
demand—in this case, just north of Opa Locka.
Max DADI
617.401.7662 www.GrayAssociates.com 23
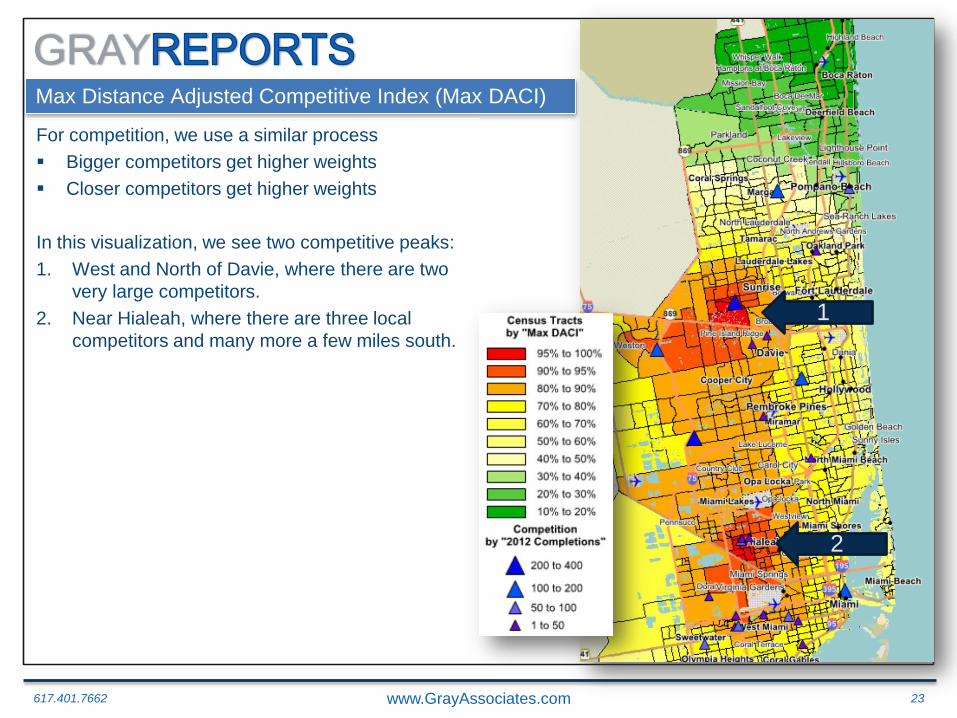
GRAYMax Distance Adjusted Competitive Index (Max DACI)
For competition, we use a similar process
Bigger competitors get higher weights
Closer competitors get higher weights
In this visualization, we see two competitive peaks:
1. West and North of Davie, where there are two
very large competitors.
2. Near Hialeah, where there are three local
competitors and many more a few miles south.
1
2
617.401.7662 www.GrayAssociates.com 24
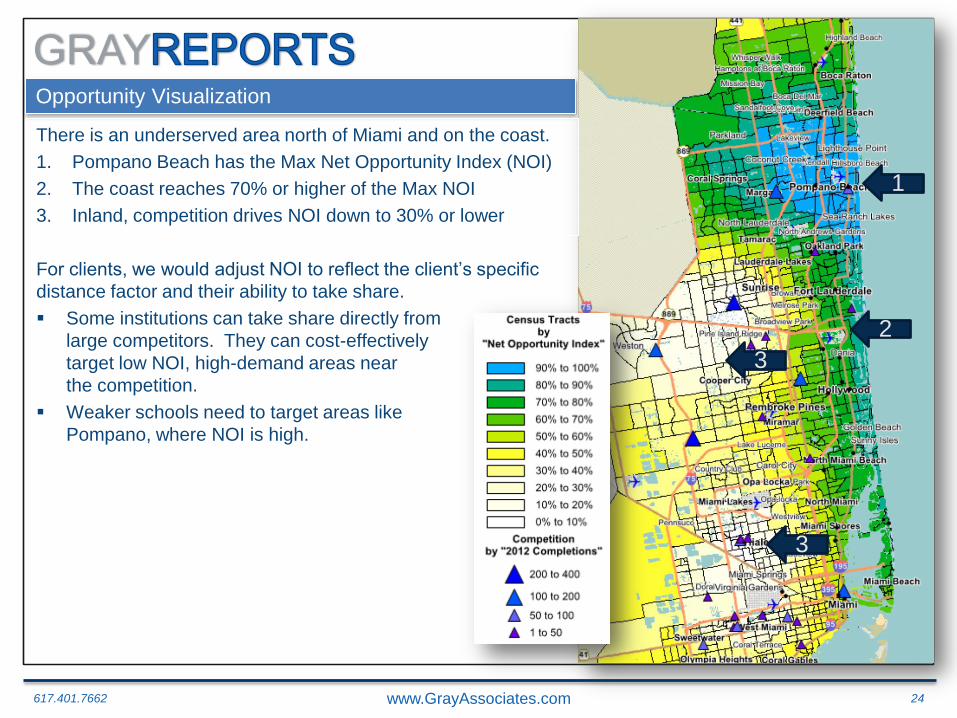
GRAYOpportunity Visualization
There is an underserved area north of Miami and on the coast.
1. Pompano Beach has the Max Net Opportunity Index (NOI)
2. The coast reaches 70% or higher of the Max NOI
3. Inland, competition drives NOI down to 30% or lower
For clients, we would adjust NOI to reflect the client’s specific
distance factor and their ability to take share.
Some institutions can take share directly from
large competitors. They can cost-effectively
target low NOI, high-demand areas near
the competition.
Weaker schools need to target areas like
Pompano, where NOI is high.
1
2
3
3
617.401.7662 www.GrayAssociates.com 25
GRAYFor more information please contact Bob Atkins.
Email: [email protected]
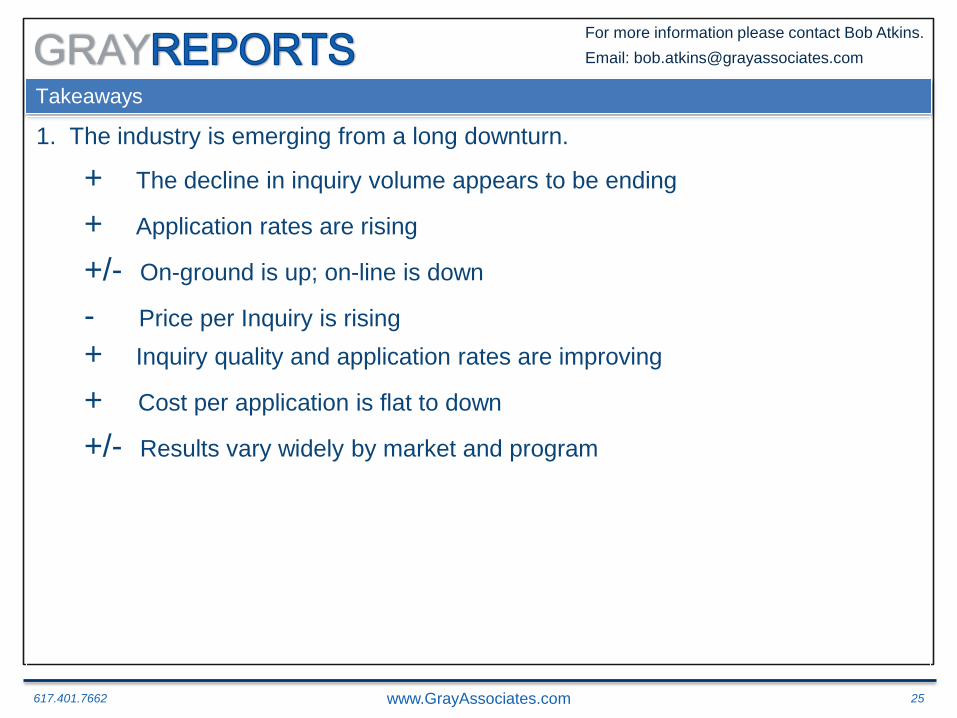
Takeaways
1. The industry is emerging from a long downturn.
+ The decline in inquiry volume appears to be ending
+ Application rates are rising
+/- On-ground is up; on-line is down
- Price per Inquiry is rising
+ Inquiry quality and application rates are improving
+ Cost per application is flat to down
+/- Results vary widely by market and program

617.401.7662 www.GrayAssociates.com 26
GRAYFor more information please contact Bob Atkins.
Email: [email protected]
Takeaways
You need GrayReports for your campuses and programs.
1. To determine if you are winning or losing the battle for share
- As a company
- By campus
- By program
2. To evaluate the performance of Marketing Agencies
- Are they rising and falling with the tide?
- Or, are they helping you take share in a tough market?
3. To make better decisions:
- How much you need to spend to sustain or take share
- Where to spend and win
617.401.7662 www.GrayAssociates.com 27
GRAYFor more information please contact Bob Atkins.
Email: [email protected]
Questions and Contacts
Please feel free to contact me:
Bob Atkins
CEO
Gray Associates, Inc.
617-401-7662
For the presentation or a recording of the
session, please visit:
GrayAssociates.com