10 18-16 new york marketing.pptx
TRANSCRIPT

TSX–NYSE MKT: RIC
POSITIONING FOR SUSTAINABLE GROWTH
New York Marketing
October 18, 2016
www.richmont-mines.com 2RIC: TSX NYSE-MKT
Safe Harbor Statement & Cautionary Note to U.S. Investors Concerning
Resource Estimates
This presentation contains forward-looking statements that include risks and uncertainties. When used in this presentation, the words
“estimate”, “projects”, “anticipate”, “expects”, “intend”, “believe”, “hope”, “may”, and similar expressions, as well as “will”, “shall”, and other
indications of future tense, are intended to identify forward-looking statements. The forward looking statements are based on current expectations
and apply only as of the date on which they were made, except as indicated by law or regulation. Richmont undertakes no obligation and disclaims
any responsibility to publicly update or revise any forward looking statements of information, whether as a result of new information, future events
or otherwise. The factors that could cause actual results to differ materially from those indicated in such forward-looking statements include
changes in the prevailing price of gold, the Canadian-U.S. exchange rate, grade of ore mined and unforeseen difficulties in mining operations that
could affect revenue and production costs. Other factors such as uncertainties regarding government regulations could also affect the results.
Other risks may be detailed from time to time in Richmont Mines Inc.’s Annual Information Form.
The resource estimates in this presentation were prepared in accordance with National Instrument 43-101 Standards of Disclosure of Mineral
Projects (“NI 43-101”) adopted by the Canadian Securities Administrators. The requirements of NI 43-101 differ significantly from the requirements
of the United States Securities and Exchange Commission (the “SEC”). In this presentation, we use the terms “Measured”, “Indicated” and
“Inferred” Resources. Although these terms are recognized and required to be used in Canada, the SEC does not recognize them. The
SEC permits U.S. mining corporations, in their filings with the SEC, to disclose only those mineral deposits that constitute “Reserves”. Under
United States standards, mineralization may not be classified as a Reserve unless the determination has been made that the mineralization could
be economically and legally extracted at the time the determination is made. United States investors should not assume that all or any
portion of a Measured or Indicated Resource will ever be converted into “Reserves”. Furthermore, “Inferred Resources” have a great amount of
uncertainty as to their existence and whether they can be mined economically or legally, and United States investors should not assume that
“Inferred Resources” exist or can be legally or economically mined, or that they will ever be upgraded to a more certain category.
U.S. Investors are urged to consider the disclosure in our annual report on Form 20-F, File No. 001-14598, which may be obtained from us or from
the SEC’s web site: http://sec.gov/edgar.shtml.
(All amounts are in Canadian dollars, unless otherwise indicated.)
FORWARD LOOKING STATEMENTS

www.richmont-mines.com 3RIC: TSX NYSE-MKT
RICHMONT MINES OVERVIEW
Quality Asset Base in Canada
Growing Production Profile
Decreasing Cost Structure
Growing Cash Flow Streams
Significant Exploration Potential
Strong Balance Sheet
Favourable Canadian Dollar Exposure
Low Shares Outstanding (63M)(1)
(1) Undiluted and including 3.0 million shares issued as part of the June 2016 equity financing.

www.richmont-mines.com 4RIC: TSX NYSE-MKT
CAPITAL STRUCTURE
Capital Structure
Issued & Outstanding Shares(1) 62.8M
Fully Diluted 66.1M
Cash(2) C$79M
Total Debt(3) C$11.1M
Ticker RIC:TSX–NYSE MKT
Market Capital (Oct. 7/16) C$705M
C$79M(US$60M)*
CASH(2)
C$11M(US$8M)*
DEBT(3)
RIC (as of October 7, 2016)
TSX
C$
NYSE MKT
US$
Closing price $11.23 $8.43
52-week range $3.73-$15.01 $2.79-$11.66
Market Cap (M’s) $705M $530M
90-day daily trading avg. 375,102 683,901
Strong cash position supports fully
funded strategic growth plan(1) Includes 3.0 million shares issued as part of the June 2016 C$31M equity financing.
(2) As of Sept. 30, 2016.
(3) As of June 30, 2016. Long-term debt is primarily comprised of capital lease obligations.
Analyst Coverage
BMO Capital Markets Brian Quast
Canaccord Genuity Rahul Paul
CIBC Jeff Killeen
Cormark Securities Richard Gray
Desjardins Capital Mike Parkin
Haywood Securities Kerry Smith
Mackie Research Ryan Hanley
Macquarie Capital Markets Michael Gray
National Bank Financial Adam Melnyk
Paradigm Capital Don Blyth
PI Financial Brian Szeto
Scotia Capital Craig Johnston
TD Securities Daniel Earle
* Using a C$:US$ exchange rate of 1.30

www.richmont-mines.com 5RIC: TSX NYSE-MKT
Operational Highlights
Successful mine and mill upgrade completed at Island Gold
Island Gold on-track to meet, or exceed, revised guidance
Company-wide on track to meet revised guidance
Island Gold mine life of 7 years based on reserves with 3 years mine life pre-developed
Preliminary Economic Assessment Update for Island Gold expected Oct/16
OPERATIONAL HIGHLIGHTS
(1) Refer to the Non-IFRS performance measures contained in the Q2 2016 MD&A.
(2) An exchange rate of 1.36 Canadian dollars to 1.0 US dollar was used for the original 2016 guidance issued on
Feb. 11, 2016. The revised guidance assumes an exchange rate of 1.33 for January to June and 1.30 for July to
December.
(3) Includes 1,165 gold ounces produced from the Monique Mine in January 2016
(1) Refer to the detailed mineral reserve and mineral resource tables that follow at the end of this presentation
(2) No changes to Mineral Reserves were made at the Corporation’s other properties.
Q3 2016Nine-Months
2016
Revised 2016
Guidance
Gold produced (oz) 18,856 74,545 98,000-106,000(3)
Cash cost per oz. (C$)(1) $1,063 $899 $885-$945
AISC per oz. (C$)(1) - - $1,230-$1,335
Cash cost per oz. (US$)(1)(2) $815 $680 $675-$720
AISC per oz. (US$)(1)(2) - - $935-$1,015
Proven and Probable Mineral Reserves(1)(2)
Island Gold Mine and Beaufor Mine
December 31, 2015 Gold ounces Gold g/t
Island Gold Proven & Probable
above ~400m 76,700 6.91
below ~400m 485,000 8.52
Island Gold Proven & Probable 561,700 8.26
Beaufor Proven & Probable 63,850 6.57
Total Proven & Probable 625,550 8.05

www.richmont-mines.com 6RIC: TSX NYSE-MKT
ISLAND GOLD MINE:
CANADIAN HIGH-GRADE UNDERGROUND MINE
Strong Production Profile; Declining cash costs
H1 positive grade reconciliation of 27%
Production growth opportunities
Reserves increase by 206%; 7-year mine life(1)
POTENTIAL PRODUCTION INCREASE OF
UP TO 125% SINCE 2013
Exploration potential laterally and at depth(1) Mine life based on 2015 Mineral Reserves.
(1) Refer to full 2015 Reserve and Resource information at the end of this presentation.
(1) Refer to the Non-IFRS performance measures contained in the Q2 2016 MD&A.
(2) An exchange rate of 1.36 Canadian dollars to 1.0 US dollar was used for the original 2016 guidance issued
on Feb. 11, 2016. The revised guidance assumes an exchange rate of 1.33 for January to June and 1.30 for
July to December.
(1) Includes 1,000m of development and related infrastructure outside of the PEA area.
(2) Estimated sustaining capital for the entire period 2017-2022 as per the PEA is $40.5M.
Q3
2016
9 Months
2016
Revised
2016
Guidance
PEA
2017-2022
Avg.
Gold Production (oz) 14,031 59,237 75,000-80,000 78,000
Cash costs/oz (C$)(1) $958 $770 $800-$840 $552
AISC per oz. (C$)(1) - - $1,040-$1,110 $639
Cash costs/oz (US$)(1)(2) $734 $582 $610-$640 $414
AISC per oz. (US$)(1)(2) - - $795-$845 $479
Capital and Exploration H1 2016
Revised
2016
Guidance
2016
PEA
Sustaining Capital (C$M) $10.2 $18.9 ~$20.0(2)
Project Capital (C$M) PEA $14.9 $37.4 36.8
Project Capital (C$M)
non-PEA- $8.7(1) -
Exploration (C$M) $7.4 $16.0 -
2015 Reserves
and ResourcesTonnes
Gold
OuncesGrade g/t
Reserves (oz)(1)/Grade (g/t) 2,115,500 561,700 8.26
M&I (oz)(1) /Grade (g/t) 348,500 71,700 6.40
Inferred (oz)(1)/Grade (g/t) 2,815,000 768,050 8.49
www.richmont-mines.com 7RIC: TSX NYSE-MKT
-
10,000
20,000
30,000
40,000
50,000
60,000
70,000
80,000
90,000
100,000
2014 2015 2016E(1) PEA BaseCase
(800tpd)(2)
UpsidePotential
(900tpd)(3)
Gold
Ounces
0.00
1.00
2.00
3.00
4.00
5.00
6.00
7.00
8.00
9.00
10.00
0
100
200
300
400
500
600
700
800
900
1000
Gra
ms p
er
tonne
To
nnes p
er
day
Underground Mine Productivity
Underground tpd Head grade (g/t)
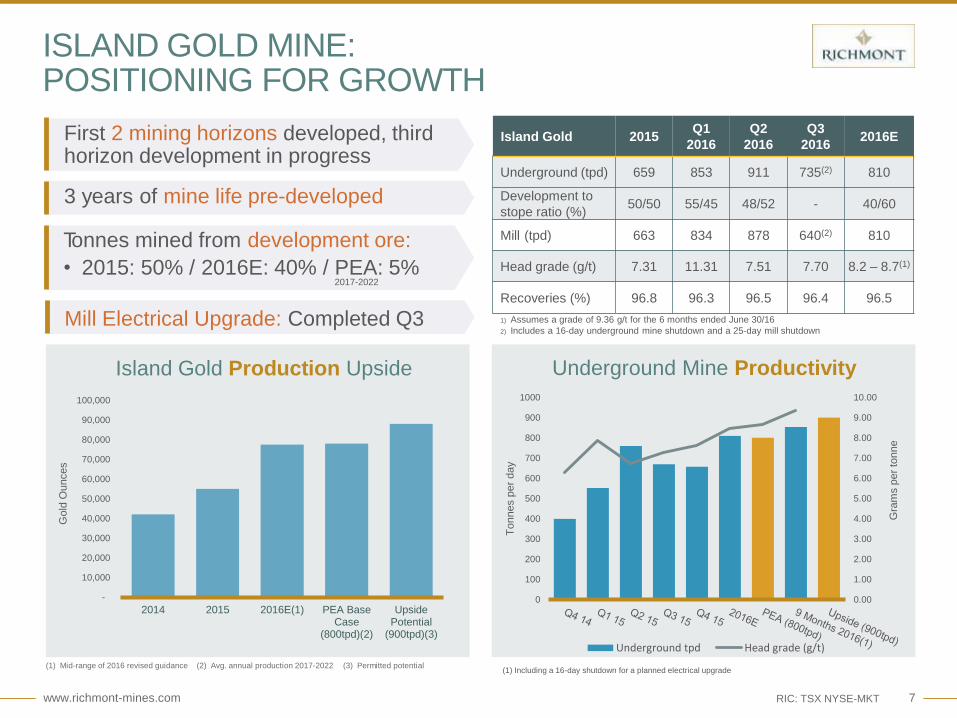
ISLAND GOLD MINE: POSITIONING FOR GROWTH
(1) Mid-range of 2016 revised guidance (2) Avg. annual production 2017-2022 (3) Permitted potential
Island Gold Production Upside
Island Gold 2015Q1
2016
Q2
2016
Q3
20162016E
Underground (tpd) 659 853 911 735(2) 810
Development to
stope ratio (%)50/50 55/45 48/52 - 40/60
Mill (tpd) 663 834 878 640(2) 810
Head grade (g/t) 7.31 11.31 7.51 7.70 8.2 – 8.7(1)
Recoveries (%) 96.8 96.3 96.5 96.4 96.5
1) Assumes a grade of 9.36 g/t for the 6 months ended June 30/16
2) Includes a 16-day underground mine shutdown and a 25-day mill shutdown
First 2 mining horizons developed, third horizon development in progress
3 years of mine life pre-developed
Tonnes mined from development ore:
• 2015: 50% / 2016E: 40% / PEA: 5%
Mill Electrical Upgrade: Completed Q3
2017-2022
(1) Including a 16-day shutdown for a planned electrical upgrade
www.richmont-mines.com 8RIC: TSX NYSE-MKT
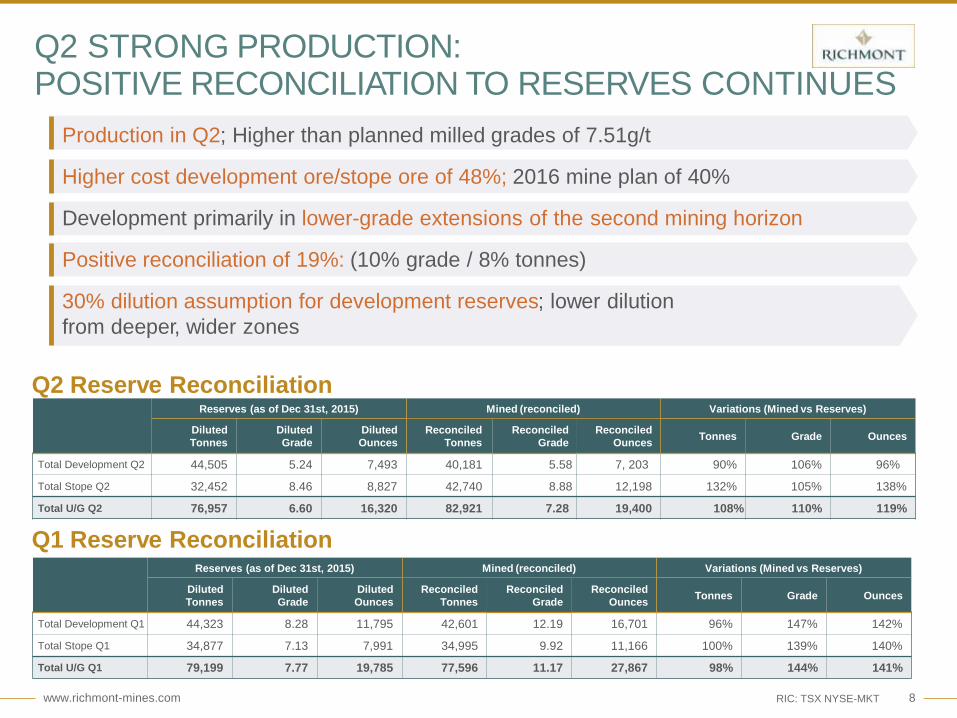
Q2 STRONG PRODUCTION:POSITIVE RECONCILIATION TO RESERVES CONTINUES
Reserves (as of Dec 31st, 2015) Mined (reconciled) Variations (Mined vs Reserves)
Diluted
Tonnes
Diluted
Grade
Diluted
Ounces
Reconciled
Tonnes
Reconciled
Grade
Reconciled
OuncesTonnes Grade Ounces
Total Development Q1 44,323 8.28 11,795 42,601 12.19 16,701 96% 147% 142%
Total Stope Q1 34,877 7.13 7,991 34,995 9.92 11,166 100% 139% 140%
Total U/G Q1 79,199 7.77 19,785 77,596 11.17 27,867 98% 144% 141%
Q1 Reserve Reconciliation
Reserves (as of Dec 31st, 2015) Mined (reconciled) Variations (Mined vs Reserves)
Diluted
Tonnes
Diluted
Grade
Diluted
Ounces
Reconciled
Tonnes
Reconciled
Grade
Reconciled
OuncesTonnes Grade Ounces
Total Development Q2 44,505 5.24 7,493 40,181 5.58 7, 203 90% 106% 96%
Total Stope Q2 32,452 8.46 8,827 42,740 8.88 12,198 132% 105% 138%
Total U/G Q2 76,957 6.60 16,320 82,921 7.28 19,400 108% 110% 119%
Q2 Reserve Reconciliation
Production in Q2; Higher than planned milled grades of 7.51g/t
Higher cost development ore/stope ore of 48%; 2016 mine plan of 40%
Development primarily in lower-grade extensions of the second mining horizon
Positive reconciliation of 19%: (10% grade / 8% tonnes)
30% dilution assumption for development reserves; lower dilution
from deeper, wider zones
www.richmont-mines.com 9RIC: TSX NYSE-MKT
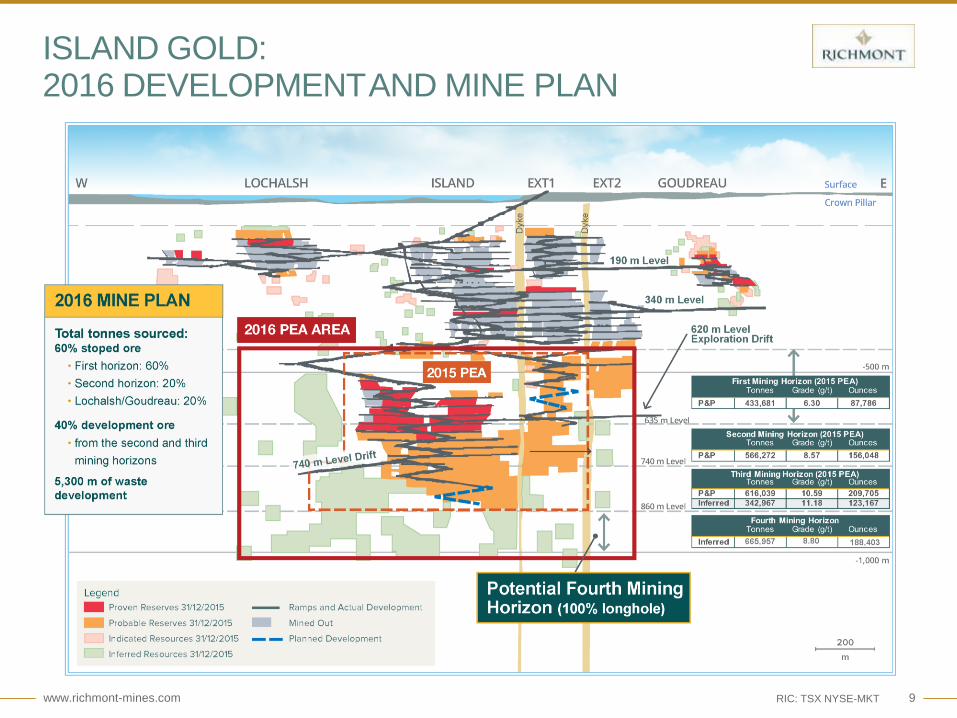
ISLAND GOLD:2016 DEVELOPMENTAND MINE PLAN

www.richmont-mines.com 10RIC: TSX NYSE-MKT
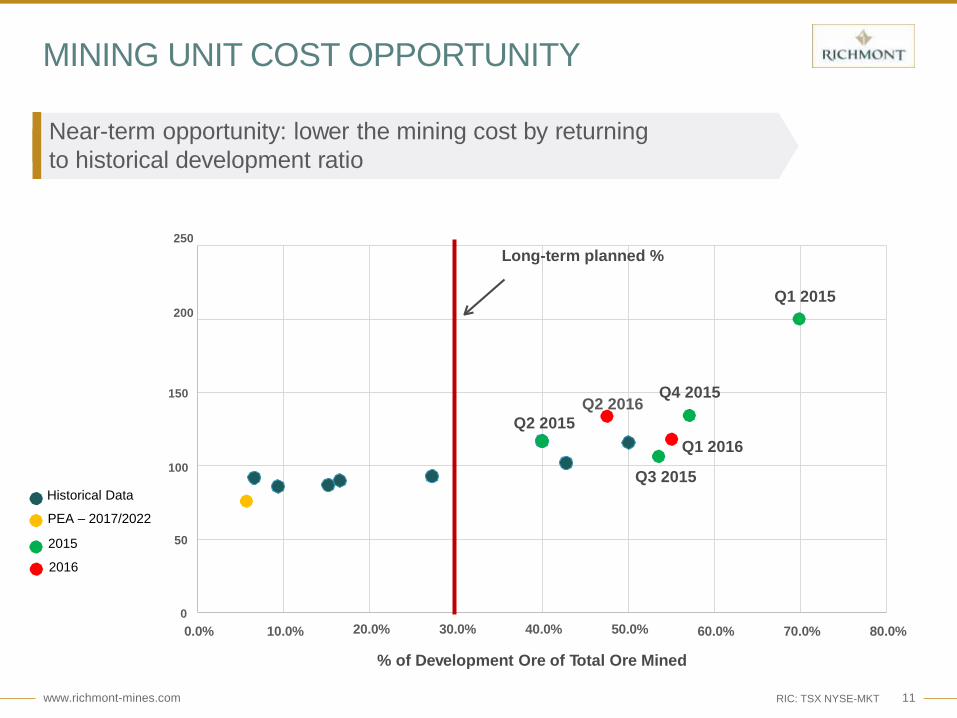
Higher unit mining costs: strategic decision to increase higher cost ore development ratio
Unit mining costs expected to decline to PEA levels in 2017-2022 (lower ore development ratio)
UNIT COST COMPARISON9 Months 2016 vs 2015 PEA
2015 PEA Cost/Tonne (C$149/t)
$32SG&A
$72MINING
$32MILLING
$13ROYALTIES
9 months milling and royalty unit costs in-line with PEA; SG&A lower than PEA estimates
2016 9 Months Cost/Tonne (C$212/t)
$144MINING
$10ROYALTIES$35
MILLING
$22SG&A
Inlcudes a 25-day mill shutdown in Q3 2016
www.richmont-mines.com 11RIC: TSX NYSE-MKT
MINING UNIT COST OPPORTUNITY
Near-term opportunity: lower the mining cost by returning
to historical development ratioU
nit
Min
ing
Co
st
20.0% 30.0% 40.0% 50.0%
% of Development Ore of Total Ore Mined
0
50
150
Q2 2015
100
250
Long-term planned %
Q1 2015200
0.0% 10.0% 60.0% 70.0% 80.0%
Historical Data
PEA – 2017/2022
2015
Q4 2015
Q3 2015
2016
Q1 2016
Q2 2016

www.richmont-mines.com 12RIC: TSX NYSE-MKT
Milling Opportunities
• Increased capacity design - allowing for future
growth at a minimum cost
• Gravity circuit vs. extra leaching capacity
• Permitting and timeline
Potential expansion case to 1,150 tpd
ISLAND GOLD: GROWTH OPPORTUNITIES
2015 PEA Summary 2017-2022 (C$)
Tonnes Milled (Mt) 1.7
Head Grade (g/t) 8.67
Mine life excl. transition period (years) 6
Daily mine production (tpd) 801
Gold recovery (%) 96.5
Production (Koz) 464.6
Average annual gold production (Koz) 78
Total operating cost (C$M) 256
Average cash operating cost (C$/t) 148
Average cash operating cost (C$/oz) 552
Transition Period Project Capital 2015-2016 (C$M) 62
Sustaining Capital (C$M) (2017-2022) 40.5
2015 PEA Highlights 2016 PEA Update
Base Case vs. Expanded Case
• Base Case (900tpd) vs. expanded case (1,150-1,500tpd)
• Expanded resource area east-west of 2015 PEA
• Mining from a depth of 450 to 1,000m
• Four mining horizons
• New Life Of Mine (LOM) and operating costs
• Project and sustaining capital estimates
• New mining infrastructure at expanded capacity
• Maximize mining capacity without new infrastructure
Phased approach: Phase 1 (800 tpd)
• Mining from a depth of 450 to 860m; 3 horizons
• Excludes resources above the 450m, and
isolated resource blocks and parallel zones
• Average annual production of approx. 78,000
gold oz. from 2017 to 2022 at C$552/oz cash
costs
www.richmont-mines.com 13
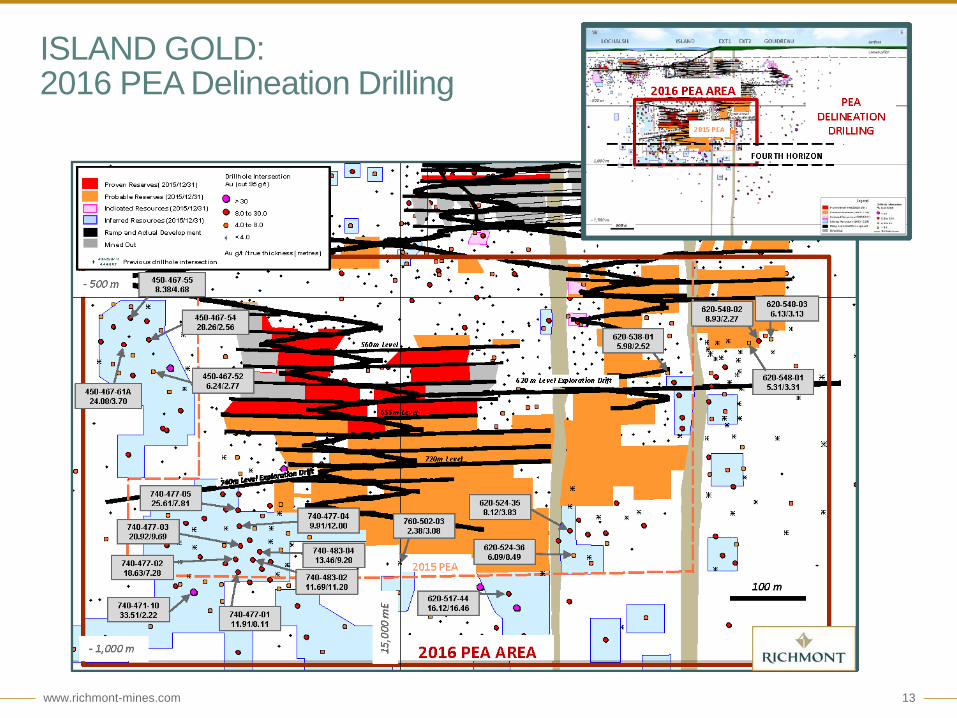
ISLAND GOLD:2016 PEA Delineation Drilling

www.richmont-mines.com 14
ISLAND GOLD:2016 Near-Mine Exploration Program

www.richmont-mines.com 15RIC: TSX NYSE-MKT
ISLAND GOLD:Phase 2 Exploration Program, H2 2016 (36,000m)ISLAND GOLD: Phase 2 Exploration Program, H2 2016 (58,000m)

www.richmont-mines.com 16RIC: TSX NYSE-MKT
ISLAND GOLD:
Regional Surface Exploration Phase 2 (20,000m)
www.richmont-mines.com 17RIC: TSX NYSE-MKT
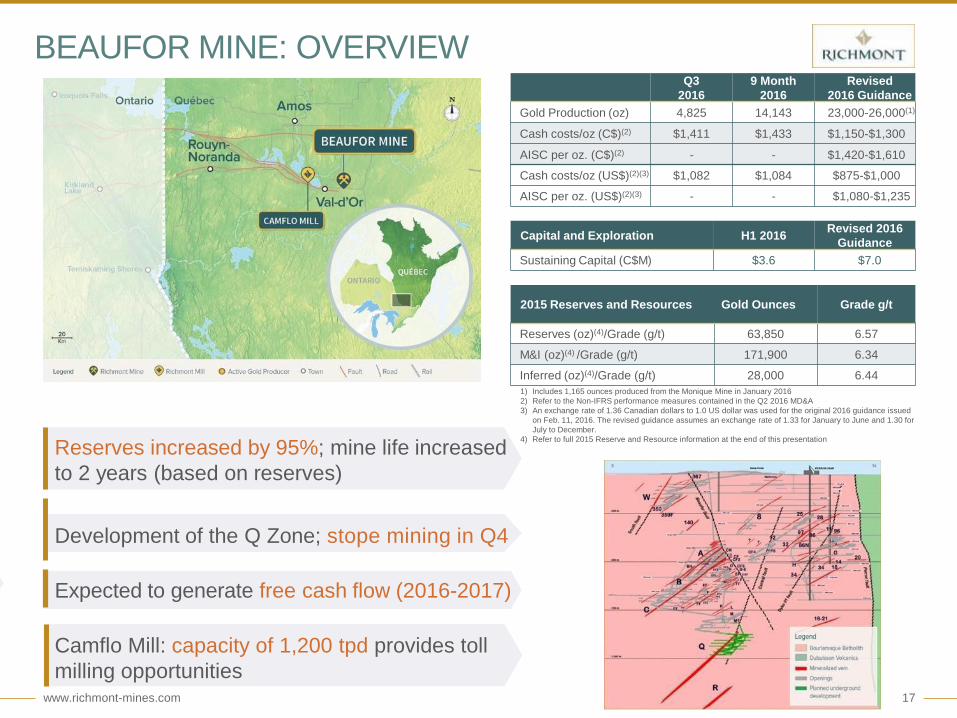
BEAUFOR MINE: OVERVIEWQ3
2016
9 Month
2016
Revised
2016 Guidance
Gold Production (oz) 4,825 14,143 23,000-26,000(1)
Cash costs/oz (C$)(2) $1,411 $1,433 $1,150-$1,300
AISC per oz. (C$)(2) - - $1,420-$1,610
Cash costs/oz (US$)(2)(3) $1,082 $1,084 $875-$1,000
AISC per oz. (US$)(2)(3) - - $1,080-$1,235
Capital and Exploration H1 2016Revised 2016
Guidance
Sustaining Capital (C$M) $3.6 $7.0
2015 Reserves and Resources Gold Ounces Grade g/t
Reserves (oz)(4)/Grade (g/t) 63,850 6.57
M&I (oz)(4) /Grade (g/t) 171,900 6.34
Inferred (oz)(4)/Grade (g/t) 28,000 6.44
1) Includes 1,165 ounces produced from the Monique Mine in January 2016
2) Refer to the Non-IFRS performance measures contained in the Q2 2016 MD&A
3) An exchange rate of 1.36 Canadian dollars to 1.0 US dollar was used for the original 2016 guidance issued
on Feb. 11, 2016. The revised guidance assumes an exchange rate of 1.33 for January to June and 1.30 for
July to December.
4) Refer to full 2015 Reserve and Resource information at the end of this presentation
Reserves increased by 95%; mine life increased
to 2 years (based on reserves)
Development of the Q Zone; stope mining in Q4
Expected to generate free cash flow (2016-2017)
Camflo Mill: capacity of 1,200 tpd provides toll
milling opportunities

www.richmont-mines.com 18RIC: TSX NYSE-MKT
WASAMAC:ADVANCED DEVELOPMENT PROJECT
(1) Refer to full 2014 Reserve and Resource information at the end of this presentation
Resources TonnesGrade
(g/t Au)
Gold
Ounces
Measured Resources 3,124,500 2.75 276,550
Indicated Resources 12,127,000 2.89 1,125,700
Inferred Resources 18,759,000 2.66 1,605,400
Located in the Abitibi gold mining district
15km west of Rouyn-Noranda, Quebec
100% owned, no royalties
Close proximity to existing infrastructure
Significant exploration potential
Base case parameters: Gold price per ounce of US$1,300 or
C$1,350 using a C$:US$ exchange rate of 1.04.
March 2012 PEA Summary (C$)
Mine life 14
Daily mine production (tpd) 6,000
Total Production (Koz) 1,750
Average annual gold production (Koz) 140
Average cash operating cost (C$/t) 46
Average cash operating cost (C$/oz) 716
Total Capital (C$M) 680
NPV5% (C$M) 71
IRR(5%) (%) 7
Reviewing PEA to potentially improve
base case economics
Improved C$ gold price ~$1,725/oz
Potential technical and operational
enhancementsNI 43-101 PEA released in March 2012
www.richmont-mines.com 19RIC: TSX NYSE-MKT
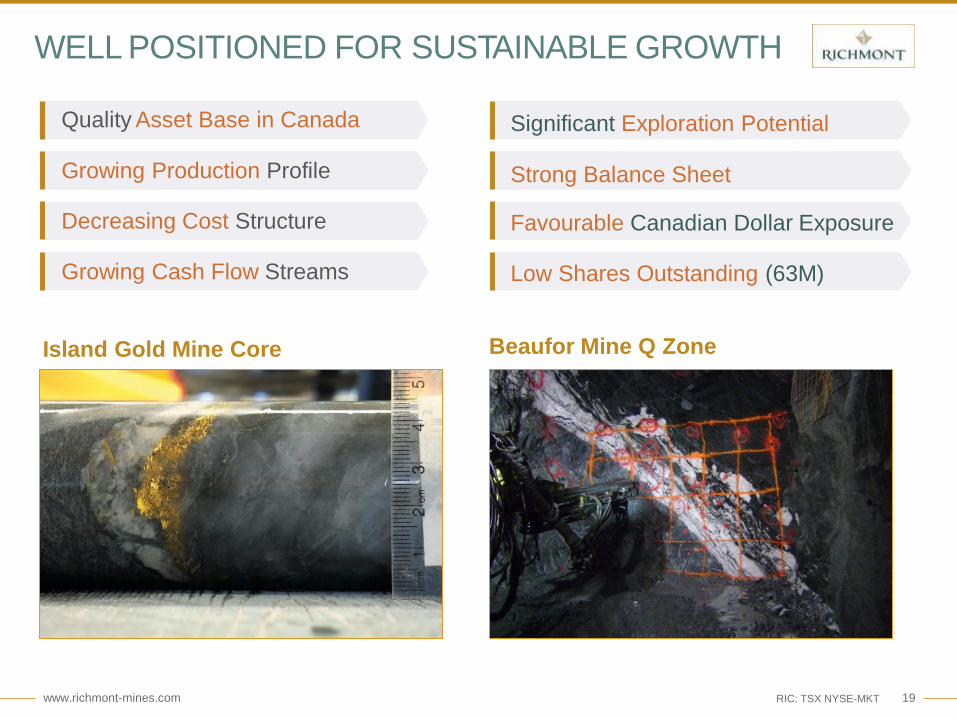
WELL POSITIONED FOR SUSTAINABLE GROWTH
Significant Exploration Potential
Strong Balance Sheet
Favourable Canadian Dollar Exposure
Low Shares Outstanding (63M)
Beaufor Mine Q Zone
Quality Asset Base in Canada
Growing Production Profile
Decreasing Cost Structure
Growing Cash Flow Streams
Island Gold Mine Core
APPENDIX

www.richmont-mines.com 21RIC: TSX NYSE-MKT
CHRISTIAN BOURCIER
P. ENG
Beaufor Mine and Camflo Mill
General Manager
RICHMONT MINES: MANAGEMENT TEAM
RENAUD ADAMS DANIEL ADAM NICOLE VEILLEUX
JEAN BASTIEN
P. ENG, MBA
Island Gold Mine
General Manager
MARC-ANDRÉ LAVERGNEMAXIME GRONDIN
CIRC
Director,
Human Resources
MÉLISSA TARDIF
ANNE DAYSTEVE BURLETON
LLB
Lawyer and
Corporate Secretary
P. ENG
President and
P. ENG
Vice-President,
GEO PHD
Vice-President
CPA, CA
Vice-President
CFA, MBA
Vice-President,
MBA
Vice-President,
Chief Executive Officer Operations Exploration Finance Business Development Investor Relations
www.richmont-mines.com 22RIC: TSX NYSE-MKT
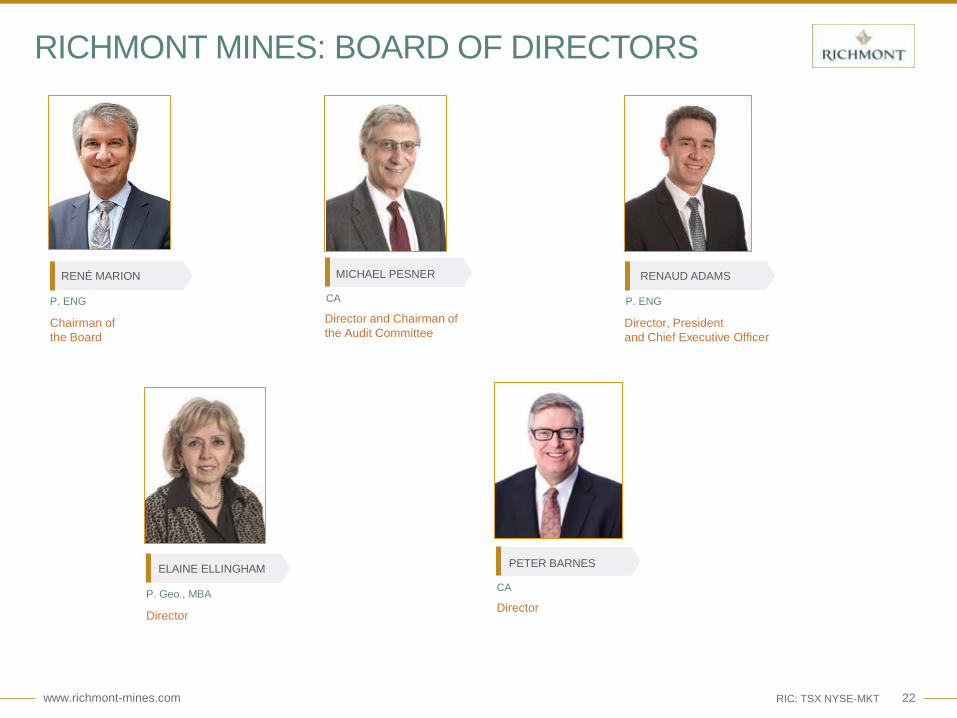
RICHMONT MINES: BOARD OF DIRECTORS
RENÉ MARION
P. ENG
Chairman of
the Board
MICHAEL PESNER
CA
Director and Chairman of
the Audit Committee
RENAUD ADAMS
P. ENG
Director, President
and Chief Executive Officer
PETER BARNES
CA
Director
ELAINE ELLINGHAM
P. Geo., MBA
Director

www.richmont-mines.com 23
2016 REVISED OPERATIONAL ESTIMATES
2016 Production and Cost Guidance
2016 Capital Investment Guidance
Revised 2016 Operational EstimatesIsland Gold
Revised 2016 Guidance
Beaufor Revised
2016 GuidanceOriginal 2016 Guidance
Revised 2016
Guidance
Gold Ounces Produced(1) 75,000 - 80,000 23,000 - 26,000 87,000 – 97,000 98,000 – 106,000
Cash Costs per Ounce (CAD$)(2) $800 - $840 $1,150 - $1,300 $930 - $1,000 $885 - $945
Sustaining Capital per Ounce (CAD$) $240 - $270 $270 - $310 $250 - $280 $250 - $280
Corporate G&A per Ounce (CAD$) - - $95 - $110 $95 - $110
All-in Sustaining Costs per Ounce (CAD$)(2) $1,040 - $1,110 $1,420 - $1,610 $1,275 - $1,390 $1,230 - $1,335
Cash Costs per Ounce (US$)(2)(3) $610 - $640 $875 - $1,000 $680 - $730 $675 - $720
Sustaining Capital per Ounce (US$)(3) $185 - $205 $205 - $235 $185 - $205 $185 - $205
Corporate G&A per Ounce (US$)(3) - - $70 - $80 $75 - $90
All-in Sustaining Costs per Ounce (US$)(2)(3) $795 - $845 $1,080 - $1,235 $935 - $1,015 $935 - $1,015
Revised 2016 Capital and Exploration ($M)Island Gold
Revised 2016 Guidance
Beaufor Revised
2016 GuidanceOriginal 2016 Guidance
Revised 2016
Guidance
Sustaining Capital (CAD$) $18.9 $7.0 $24.1 $25.9
Project Capital (CAD$) $46.1 - $43.4 $46.1
Exploration (CAD$) $16.0 $1.1 $15.5 $17.1
Sustaining Capital (US$)(3) $14.4 $5.3 $17.7 $19.7
Project Capital (US$)(3) $35.2 - $31.8 $35.2
Exploration (US$)(3) $12.2 $0.8 $11.4 $13.1
(1) Revised guidance estimates include 1,165 ounces produced from the Monique Mine in Q1 2016, which were not included in original guidance.
(2) Cash cost and AISC are non-GAAP measures. Refer to the Non-GAAP performance measures section in the second quarter MD&A.
(3) An exchange rate of 1.36 Canadian dollars to 1.0 US dollar was used for the original 2016 guidance issued on Feb. 11, 2016. The revised guidance assumes an exchange rate of 1.33 for January to June and
1.30 for July to December.
www.richmont-mines.com 24RIC: TSX NYSE-MKT
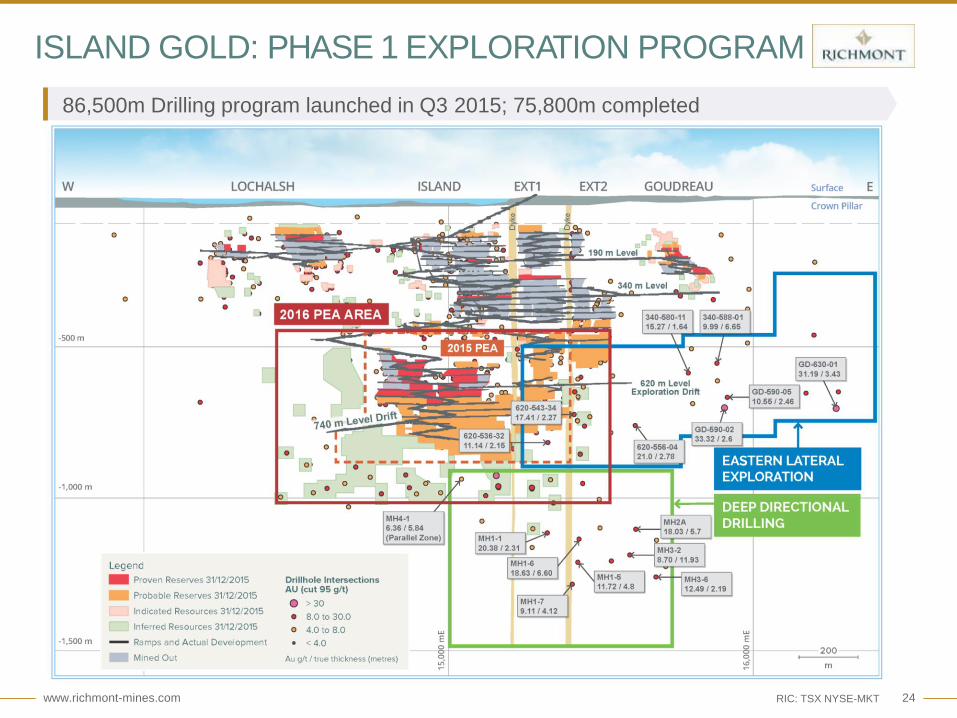
86,500m Drilling program launched in Q3 2015; 75,800m completed
ISLAND GOLD: PHASE 1 EXPLORATION PROGRAM
www.richmont-mines.com 25RIC: TSX NYSE-MKT
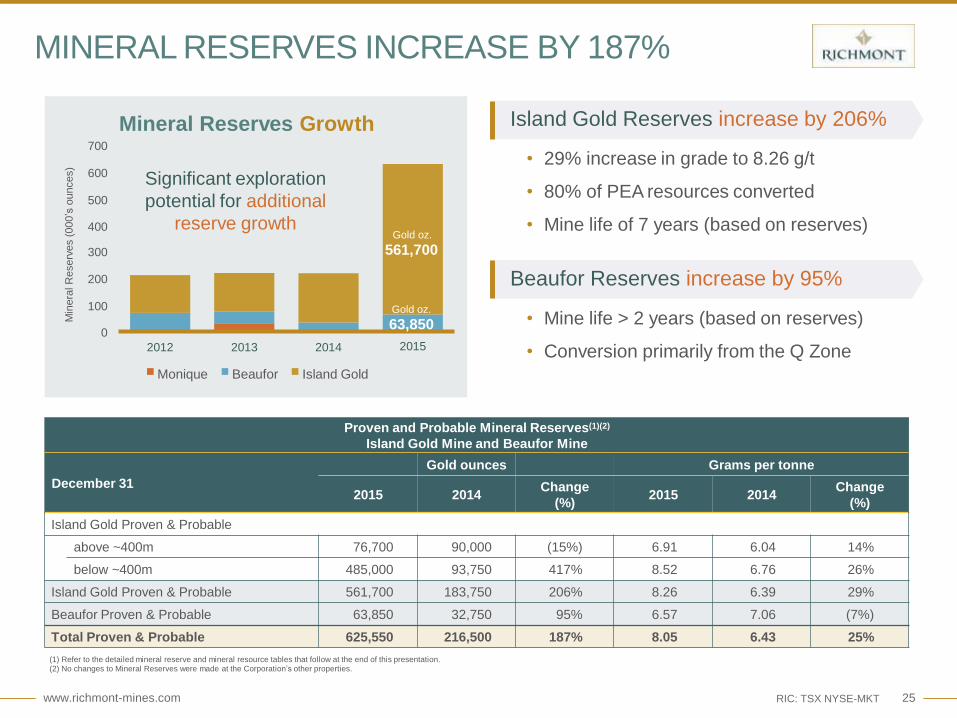
MINERAL RESERVES INCREASE BY 187%
Gold oz.
63,850
2015
Min
era
lR
eserv
es
(000
’s o
unces)
Gold oz.
300 561,700
200
100
0
2012 2013 2014
Monique Beaufor Island Gold
700
600
500
400
Mineral Reserves Growth
(1) Refer to the detailed mineral reserve and mineral resource tables that follow at the end of this presentation.(2) No changes to Mineral Reserves were made at the Corporation’s other properties.
Island Gold Reserves increase by 206%
• 29% increase in grade to 8.26 g/t
• 80% of PEA resources converted
• Mine life of 7 years (based on reserves)
Beaufor Reserves increase by 95%
• Mine life > 2 years (based on reserves)
• Conversion primarily from the Q Zone
Significant exploration
potential for additional
reserve growth
Proven and Probable Mineral Reserves(1)(2)
Island Gold Mine and Beaufor Mine
December 31
Gold ounces Grams per tonne
2015 2014Change
(%)2015 2014
Change
(%)
Island Gold Proven & Probable
above ~400m 76,700 90,000 (15%) 6.91 6.04 14%
below ~400m 485,000 93,750 417% 8.52 6.76 26%
Island Gold Proven & Probable 561,700 183,750 206% 8.26 6.39 29%
Beaufor Proven & Probable 63,850 32,750 95% 6.57 7.06 (7%)
Total Proven & Probable 625,550 216,500 187% 8.05 6.43 25%
www.richmont-mines.com 26RIC: TSX NYSE-MKT
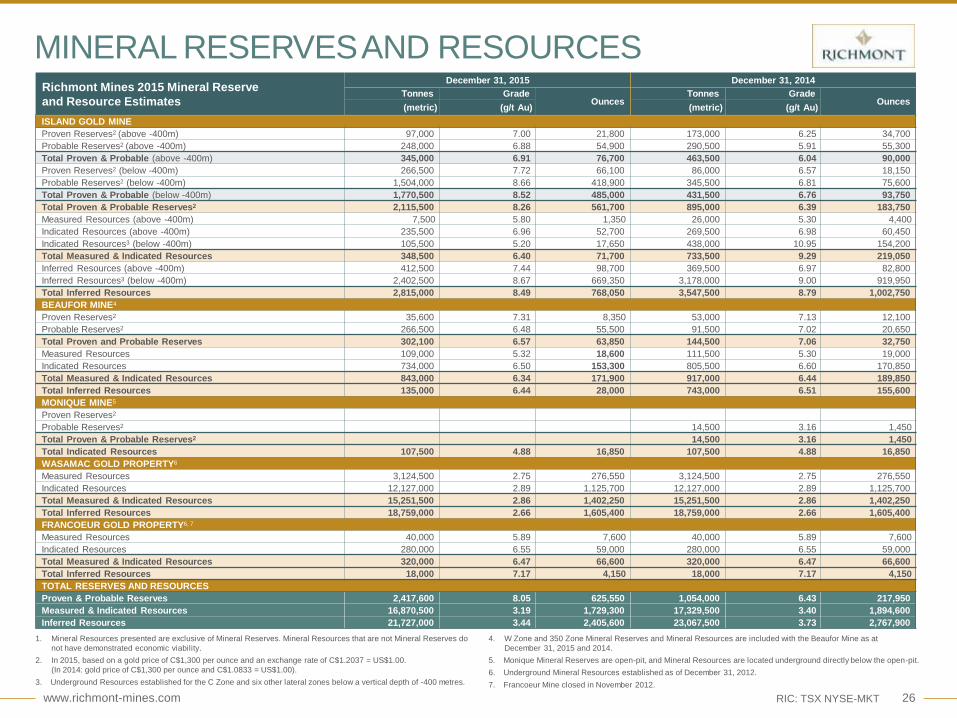
MINERAL RESERVESAND RESOURCES
1. Mineral Resources presented are exclusive of Mineral Reserves. Mineral Resources that are not Mineral Reserves do
not have demonstrated economic viability.
2. In 2015, based on a gold price of C$1,300 per ounce and an exchange rate of C$1.2037 = US$1.00.
(In 2014: gold price of C$1,300 per ounce and C$1.0833 = US$1.00).
3. Underground Resources established for the C Zone and six other lateral zones below a vertical depth of -400 metres.
4. W Zone and 350 Zone Mineral Reserves and Mineral Resources are included with the Beaufor Mine as at
December 31, 2015 and 2014.
5. Monique Mineral Reserves are open-pit, and Mineral Resources are located underground directly below the open-pit.
6. Underground Mineral Resources established as of December 31, 2012.
7. Francoeur Mine closed in November 2012.
Richmont Mines 2015 Mineral Reserve
and Resource Estimates
December 31, 2015 December 31, 2014
Tonnes GradeOunces
Tonnes GradeOunces
(metric) (g/t Au) (metric) (g/t Au)
ISLAND GOLD MINE
Proven Reserves2 (above -400m) 97,000 7.00 21,800 173,000 6.25 34,700
Probable Reserves2 (above -400m) 248,000 6.88 54,900 290,500 5.91 55,300
Total Proven & Probable (above -400m) 345,000 6.91 76,700 463,500 6.04 90,000
Proven Reserves2 (below -400m) 266,500 7.72 66,100 86,000 6.57 18,150
Probable Reserves2 (below -400m) 1,504,000 8.66 418,900 345,500 6.81 75,600
Total Proven & Probable (below -400m) 1,770,500 8.52 485,000 431,500 6.76 93,750
Total Proven & Probable Reserves2 2,115,500 8.26 561,700 895,000 6.39 183,750
Measured Resources (above -400m) 7,500 5.80 1,350 26,000 5.30 4,400
Indicated Resources (above -400m) 235,500 6.96 52,700 269,500 6.98 60,450
Indicated Resources3 (below -400m) 105,500 5.20 17,650 438,000 10.95 154,200
Total Measured & Indicated Resources 348,500 6.40 71,700 733,500 9.29 219,050
Inferred Resources (above -400m) 412,500 7.44 98,700 369,500 6.97 82,800
Inferred Resources3 (below -400m) 2,402,500 8.67 669,350 3,178,000 9.00 919,950
Total Inferred Resources 2,815,000 8.49 768,050 3,547,500 8.79 1,002,750
BEAUFOR MINE4
Proven Reserves2 35,600 7.31 8,350 53,000 7.13 12,100
Probable Reserves2 266,500 6.48 55,500 91,500 7.02 20,650
Total Proven and Probable Reserves 302,100 6.57 63,850 144,500 7.06 32,750
Measured Resources 109,000 5.32 18,600 111,500 5.30 19,000
Indicated Resources 734,000 6.50 153,300 805,500 6.60 170,850
Total Measured & Indicated Resources 843,000 6.34 171,900 917,000 6.44 189,850
Total Inferred Resources 135,000 6.44 28,000 743,000 6.51 155,600
MONIQUE MINE5
Proven Reserves2
Probable Reserves2 14,500 3.16 1,450
Total Proven & Probable Reserves2 14,500 3.16 1,450
Total Indicated Resources 107,500 4.88 16,850 107,500 4.88 16,850
WASAMAC GOLD PROPERTY6
Measured Resources 3,124,500 2.75 276,550 3,124,500 2.75 276,550
Indicated Resources 12,127,000 2.89 1,125,700 12,127,000 2.89 1,125,700
Total Measured & Indicated Resources 15,251,500 2.86 1,402,250 15,251,500 2.86 1,402,250
Total Inferred Resources 18,759,000 2.66 1,605,400 18,759,000 2.66 1,605,400
FRANCOEUR GOLD PROPERTY6, 7
Measured Resources 40,000 5.89 7,600 40,000 5.89 7,600
Indicated Resources 280,000 6.55 59,000 280,000 6.55 59,000
Total Measured & Indicated Resources 320,000 6.47 66,600 320,000 6.47 66,600
Total Inferred Resources 18,000 7.17 4,150 18,000 7.17 4,150
TOTAL RESERVES AND RESOURCES
Proven & Probable Reserves 2,417,600 8.05 625,550 1,054,000 6.43 217,950
Measured & Indicated Resources 16,870,500 3.19 1,729,300 17,329,500 3.40 1,894,600
Inferred Resources 21,727,000 3.44 2,405,600 23,067,500 3.73 2,767,900
www.richmont-mines.com 27RIC: TSX NYSE-MKT
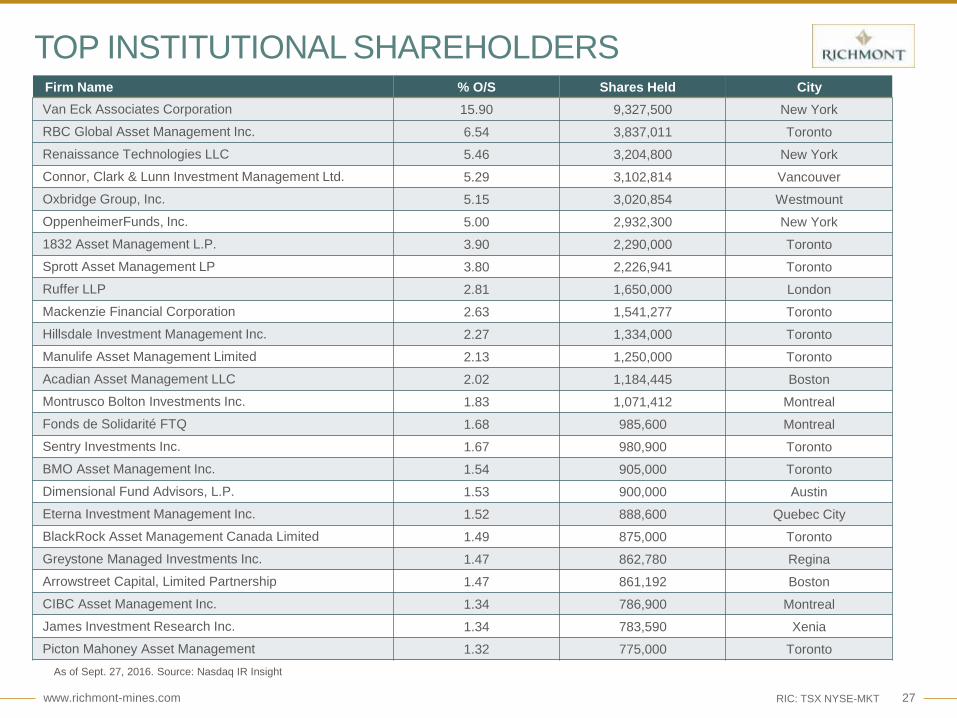
TOP INSTITUTIONAL SHAREHOLDERSFirm Name % O/S Shares Held City
Van Eck Associates Corporation 15.90 9,327,500 New York
RBC Global Asset Management Inc. 6.54 3,837,011 Toronto
Renaissance Technologies LLC 5.46 3,204,800 New York
Connor, Clark & Lunn Investment Management Ltd. 5.29 3,102,814 Vancouver
Oxbridge Group, Inc. 5.15 3,020,854 Westmount
OppenheimerFunds, Inc. 5.00 2,932,300 New York
1832 Asset Management L.P. 3.90 2,290,000 Toronto
Sprott Asset Management LP 3.80 2,226,941 Toronto
Ruffer LLP 2.81 1,650,000 London
Mackenzie Financial Corporation 2.63 1,541,277 Toronto
Hillsdale Investment Management Inc. 2.27 1,334,000 Toronto
Manulife Asset Management Limited 2.13 1,250,000 Toronto
Acadian Asset Management LLC 2.02 1,184,445 Boston
Montrusco Bolton Investments Inc. 1.83 1,071,412 Montreal
Fonds de Solidarité FTQ 1.68 985,600 Montreal
Sentry Investments Inc. 1.67 980,900 Toronto
BMO Asset Management Inc. 1.54 905,000 Toronto
Dimensional Fund Advisors, L.P. 1.53 900,000 Austin
Eterna Investment Management Inc. 1.52 888,600 Quebec City
BlackRock Asset Management Canada Limited 1.49 875,000 Toronto
Greystone Managed Investments Inc. 1.47 862,780 Regina
Arrowstreet Capital, Limited Partnership 1.47 861,192 Boston
CIBC Asset Management Inc. 1.34 786,900 Montreal
James Investment Research Inc. 1.34 783,590 Xenia
Picton Mahoney Asset Management 1.32 775,000 Toronto
As of Sept. 27, 2016. Source: Nasdaq IR Insight

www.richmont-mines.com 28RIC: TSX NYSE-MKT
ISLAND GOLD MINEC Zone – Metal factor (grade x width) as of Dec. 2015
www.richmont-mines.com 29RIC: TSX NYSE-MKT
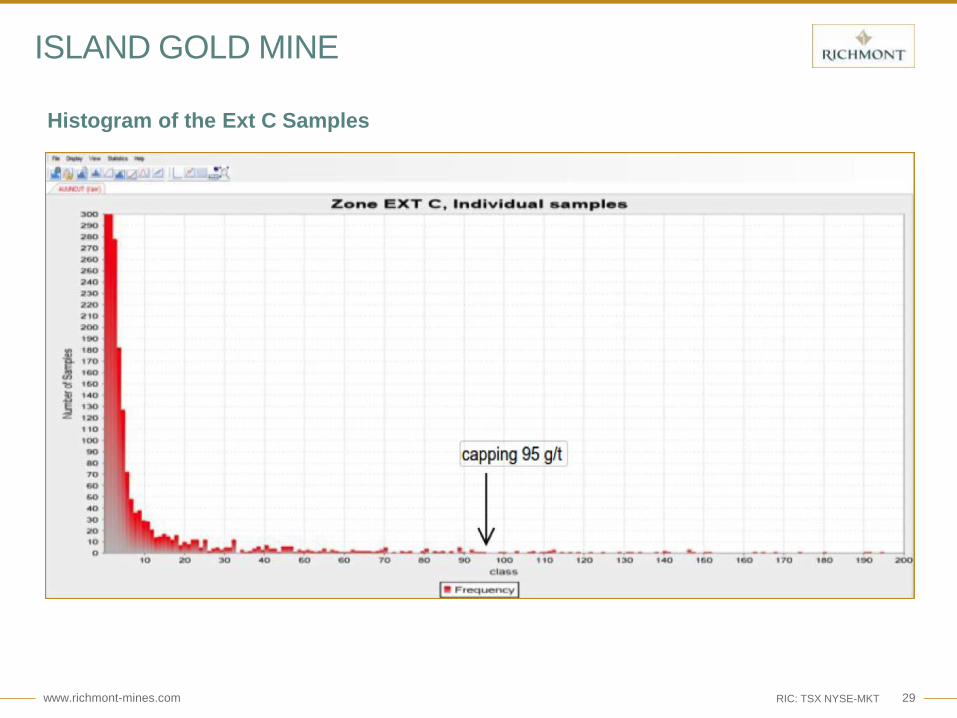
ISLAND GOLD MINE
Histogram of the Ext C Samples

www.richmont-mines.com 30RIC: TSX NYSE-MKT
ISLAND GOLD MINE
Log Normal Probability Plot (Ext C Drill Hole Samples)

www.richmont-mines.com 31RIC: TSX NYSE-MKT
ISLAND GOLD MINEDeep Directional Drilling(Phase 2)

www.richmont-mines.com 32RIC: TSX NYSE-MKT
ISLAND GOLD MINE2016 Eastern Lateral ExplorationPhase 2
www.richmont-mines.com 33RIC: TSX NYSE-MKT
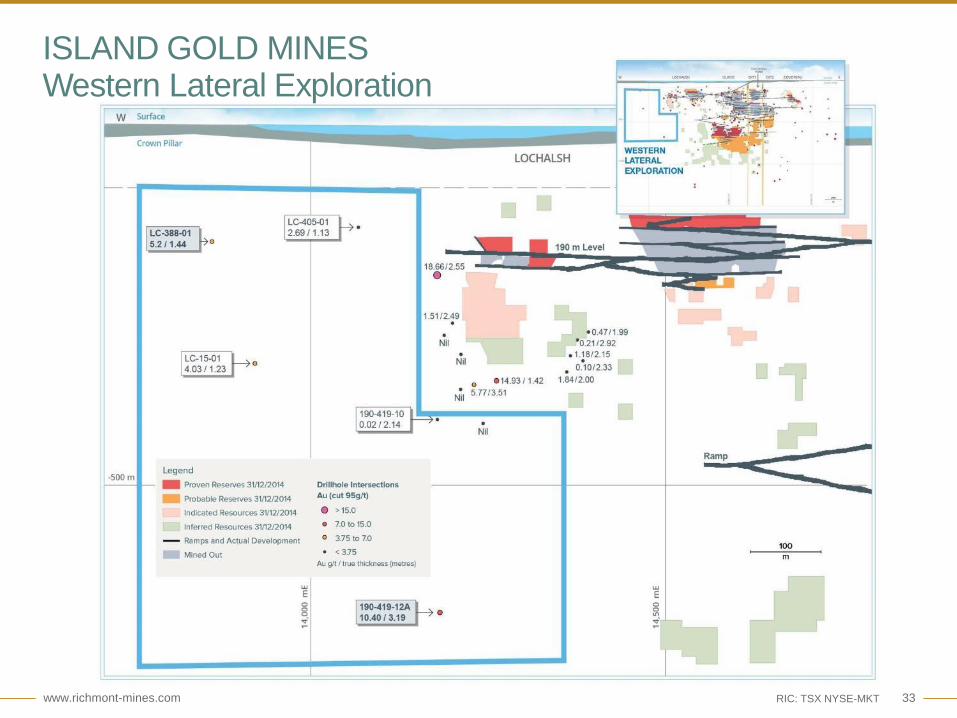
ISLAND GOLD MINESWestern Lateral Exploration

www.richmont-mines.com 34RIC: TSX NYSE-MKT
RICHMONT MINESASSETSVALD’ORAREA– EXPLORATION PROPERTIES
www.richmont-mines.com 35RIC: TSX NYSE-MKT
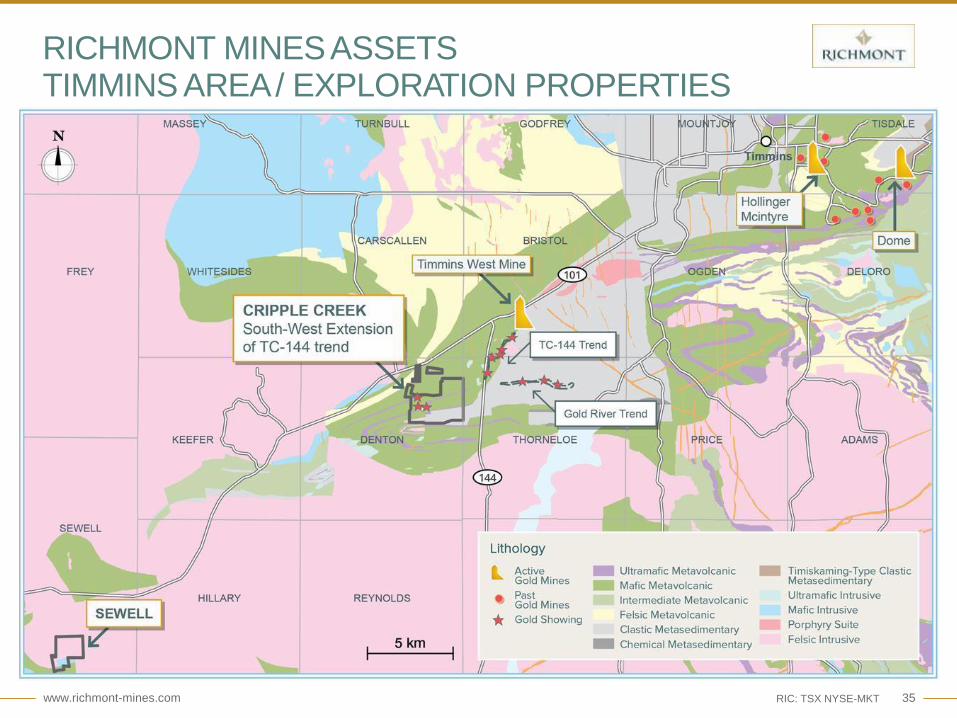
RICHMONT MINESASSETSTIMMINS AREA/ EXPLORATION PROPERTIES

www.richmont-mines.com 36RIC: TSX NYSE-MKT
OUR VISION and STRATEGY
Our vision is to become a leading intermediate gold producer focused on
the Americas generating superior per share valuation. We are committed to a
“Sustainable Business Model” and a strategy of long-term growth, and will
fully utilize the Corporation’s strong balance sheet, assets, cash flow, capital
structure and the extensive experience of the Corporations’ Board of
Directors and Management Team to build the next leading Canadian based
intermediate gold company.
Our strategy, in the short term, will focus on becoming a leading junior
gold producer by maintaining at all times a superior per share position on
operational & financial metrics while maintaining a sustainable and risk
adverse approach under a “Sustainable Business Model”.
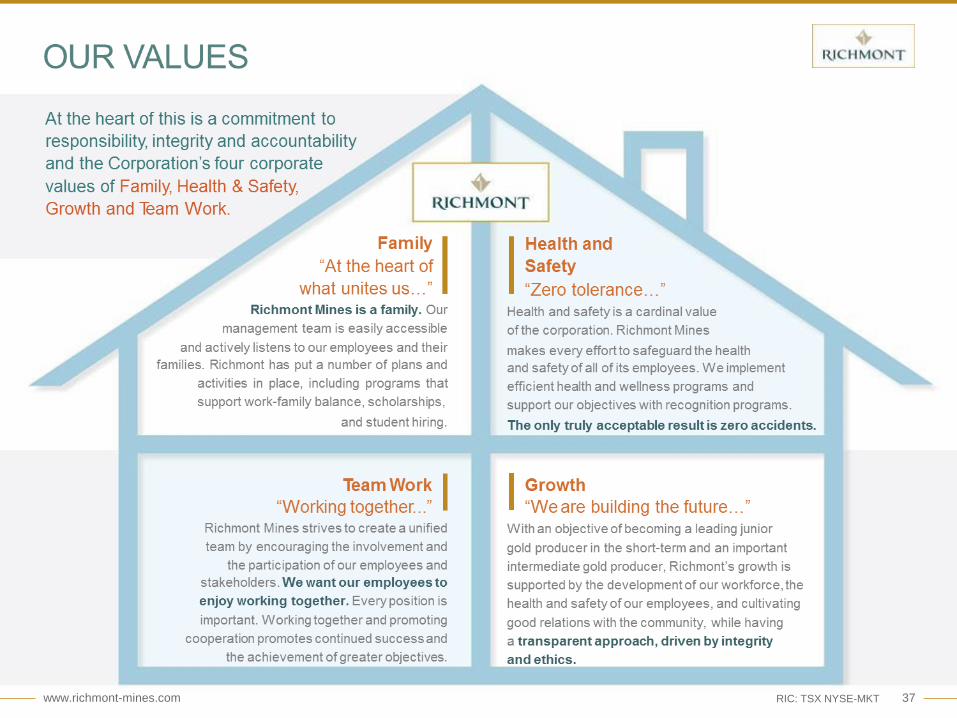
We are guided by our core corporate values to achieve long term value
for all of our stakeholders. By cultivating a culture of responsible
performance, we are focused on operating in a sustainable manner while
holding ourselves accountable to all of our stakeholders.
www.richmont-mines.com 37RIC: TSX NYSE-MKT
www.richmont-mines.com 38RIC: TSX NYSE-MKT
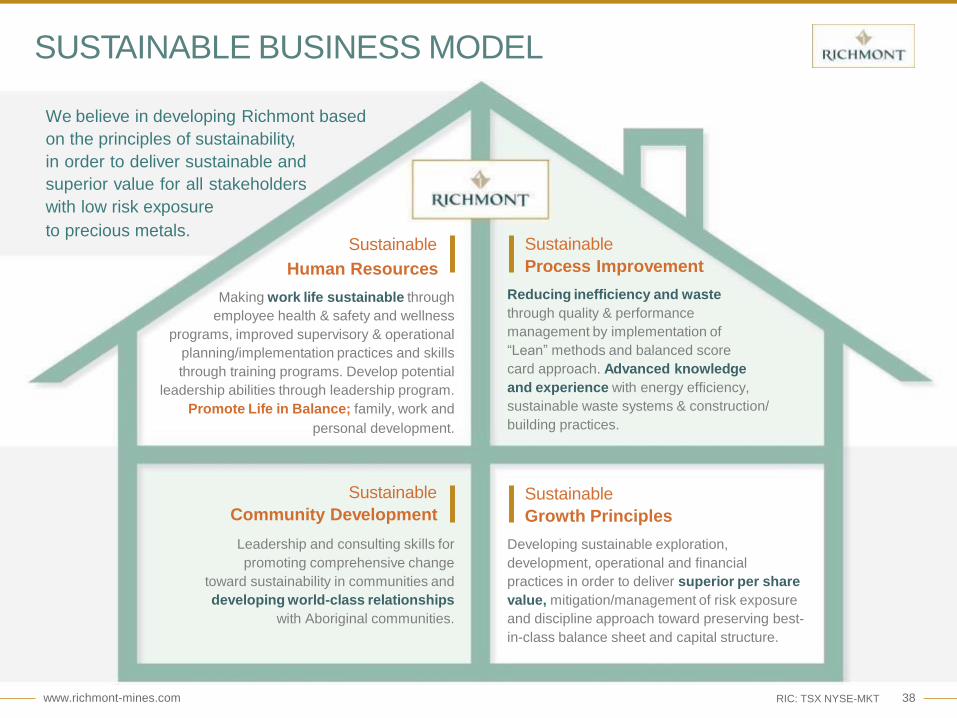
SUSTAINABLE BUSINESS MODEL
We believe in developing Richmont based
on the principles of sustainability,
in order to deliver sustainable and
superior value for all stakeholders
with low risk exposure
to precious metals.
Human Resources
Making work life sustainable through
employee health & safety and wellness
programs, improved supervisory & operational
planning/implementation practices and skills
through training programs. Develop potential
leadership abilities through leadership program.
Promote Life in Balance; family, work and
personal development.
Sustainable
Sustainable
Community Development
Leadership and consulting skills for
promoting comprehensive change
toward sustainability in communities and
developing world-class relationships
with Aboriginal communities.
Sustainable
Process Improvement
Reducing inefficiency and waste
through quality & performance
management by implementation of
“Lean” methods and balanced score
card approach. Advanced knowledge
and experience with energy efficiency,
sustainable waste systems & construction/
building practices.
Sustainable
Growth Principles
Developing sustainable exploration,
development, operational and financial
practices in order to deliver superior per share
value, mitigation/management of risk exposure
and discipline approach toward preserving best-
in-class balance sheet and capital structure.