february 2015 ipsos mori political monitor
TRANSCRIPT

POLITICAL MONITOR
February 2015
Contacts:
020 7347 3000

Voting Intentions

3 Voting Intention: all giving an opinion vs. those
“certain to vote”
Source: Ipsos MORI Political Monitor
Conservative lead = -3
All giving a voting intention: 80%
How would you vote if there were a General Election tomorrow?
33%
36%
7%
8%
9%
7%
Base: 1,010 British adults 18+, 8th -10th February 2015, all certain to vote = 659
Labour
Conservative
Lib Dem
UKIP
Other
All certain to vote: 62%
Conservative lead = -2
34%
36%
6%
9%
7% 8%
Greens

4
0
10
20
30
40
50
Ma
y-0
4
Aug
-04
Nov-0
4
Feb-0
5
Ma
y-0
5
Aug
-05
Nov-0
5
Feb-0
6
Ma
y-0
6
Aug
-06
Nov-0
6
Feb-0
7
Ma
y-0
7
Aug
-07
Nov-0
7
Feb-0
8
Ma
y-0
8
Aug
-08
Nov-0
8
Feb-0
9
Ma
y-0
9
Aug
-09
Nov-0
9
Feb-1
0
Ma
y-1
0
Aug
-10
Nov-1
0
Feb-1
1
Ma
y-1
1
Aug
-11
Nov-1
1
Feb-1
2
Ma
y-1
2
Aug
-12
Nov-1
2
Feb-1
3
Ma
y-1
3
Aug
-13
Nov-1
3
Feb-1
4
Ma
y-1
4
Aug
-14
Nov-1
4
Feb-1
5
36%
6%
34%
9%
2005 General Election
Cameron elected
(Dec 05)
Brown as PM (Jun 07)
2010 General Election
Base: c.1,000 British adults certain to vote each month through February 2008; c. 500 British adults thereafter Source: Ipsos MORI Political Monitor
Voting Intentions May ‘04 – February ‘15
(all certain to vote)
How would you vote if there were a General Election tomorrow?
7%
5
0%
10%
20%
30%
40%
50%
60%
70%
80%
90%
100%
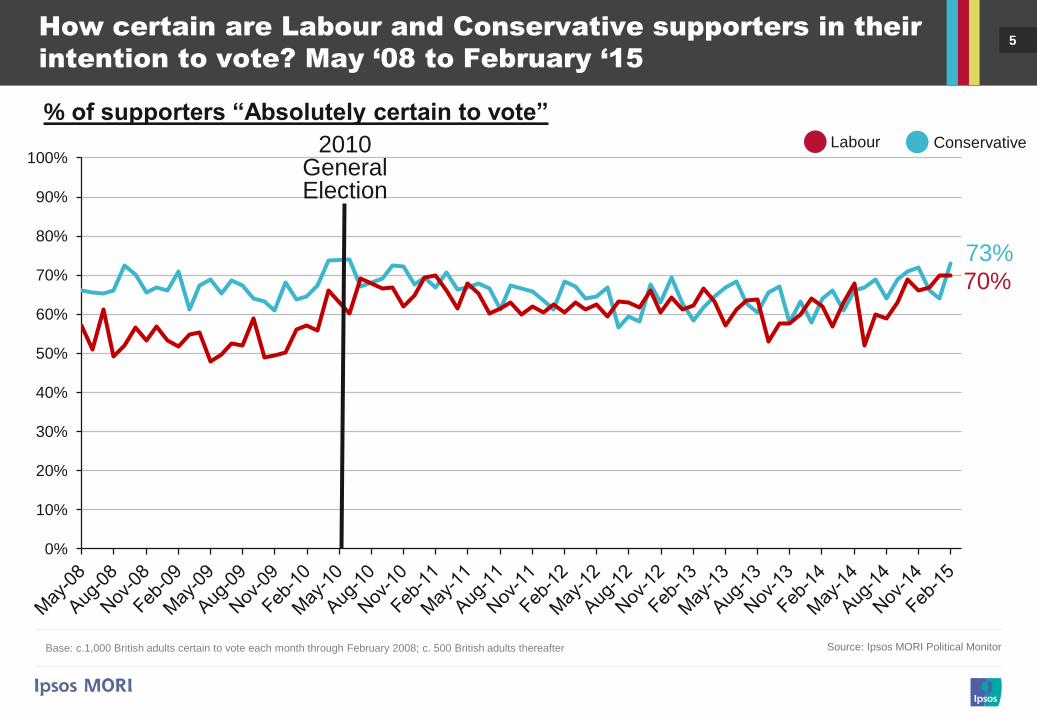
How certain are Labour and Conservative supporters in their
intention to vote? May ‘08 to February ‘15
% of supporters “Absolutely certain to vote”
Source: Ipsos MORI Political Monitor
2010 General Election
Labour Conservative
73%
70%
Base: c.1,000 British adults certain to vote each month through February 2008; c. 500 British adults thereafter
Satisfaction with the Coalition
and Party Leaders

7
53
64
61
53
58
39
23
26
30
34
Net Satisfaction
Swing from January
2015
-14 -1.5
-41 -1
-35 0
-23 -5
-24 -0.5
Base: 1,010 British adults 18+, 8th – 10th February 2015. Swing is calculated as the average of change in % “satisfied” and %
“dissatisfied”
Satisfaction with leaders and the Government
How satisfied or dissatisfied are you with the way … is running the country /doing his job as Prime Minister
/Deputy Prime Minister/Leader of the Labour Party/UKIP?
David Cameron
The Government
Nick Clegg
Ed Miliband
% Satisfied
% Dissatisfied
Nigel Farage
Source: Ipsos MORI Political Monitor

8
0
10
20
30
40
50
60
70
Ma
y-0
8
Au
g-0
8
No
v-0
8
Fe
b-0
9
Ma
y-0
9
Au
g-0
9
Nov-0
9
Fe
b-1
0
Ma
y-1
0
Au
g-1
0
No
v-1
0
Fe
b-1
1
Ma
y-1
1
Au
g-1
1
No
v-1
1
Fe
b-1
2
Ma
y-1
2
Au
g-1
2
No
v-1
2
Fe
b-1
3
May-1
3
Au
g-1
3
No
v-1
3
Fe
b-1
4
Ma
y-1
4
Au
g-1
4
No
v-1
4
Feb-1
5
23%
% s
ati
sfi
ed
Cameron
Clegg
General Election
39%
Miliband 26% Brown
Base: c.1,010 British adults each month Source: Ipsos MORI Political Monitor
How satisfied or dissatisfied are you with the way … is running the country / doing his job as … ?
Satisfaction with Party leaders May ‘08 – February ‘15
Farage
30%

9
Net
sati
sfa
cti
on
How satisfied or dissatisfied are you with the way … is doing his / her job as Prime Minister?
Net satisfaction with Prime Ministers
THATCHER
BLAIR MAJOR
BROWN
CAMERON
Base: c.1,000 British adults each month Source: Ipsos MORI Political Monitor
Number of months from becoming Prime Minister
Note: Data collected prior to February 2008 was collected via face-to-face methodology; data collected from February 2008 was via telephone

10
39%
53%
8%
Source: Ipsos MORI Political Monitor
David Cameron (satisfaction)
Are you satisfied or dissatisfied with the way David Cameron is doing his job as leader of the Conservative
Party/ as Prime Minister?
Note: Data collected prior to February 2008 was collected via face-to-face methodology; data collected from February 2008 was via telephone
Satisfied
Dissatisfied
February 2015
Satisfied Don’t know
Dissatisfied
Net = -14
Base: 1,010 British adults 18+, 8th – 10th February 2015
0
10
20
30
40
50
60
70
February 2007 – February 2015
11
0
10
20
30
40
50
60
70
80
90
100
Base: 267 Conservative supporters 18+, 8th -10th February 2015 Source: Ipsos MORI Political Monitor
Satisfied
Dissatisfied
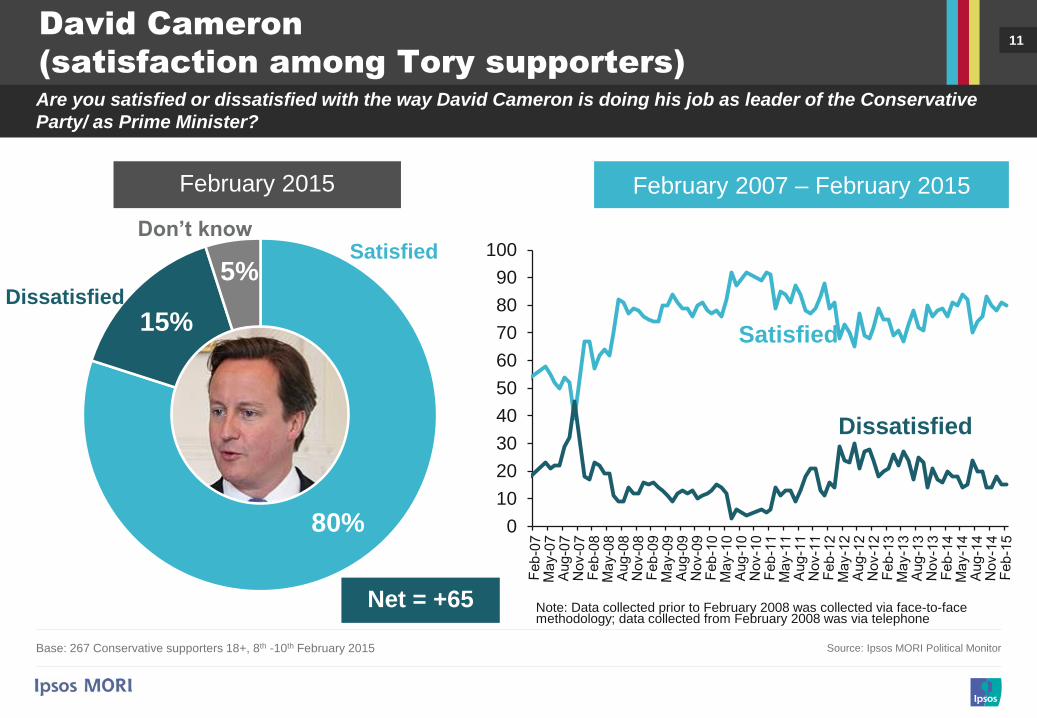
David Cameron
(satisfaction among Tory supporters)
Are you satisfied or dissatisfied with the way David Cameron is doing his job as leader of the Conservative
Party/ as Prime Minister?
80%
15%
5% Satisfied
Don’t know
Dissatisfied
Net = +65 Note: Data collected prior to February 2008 was collected via face-to-face methodology; data collected from February 2008 was via telephone
February 2007 – February 2015 February 2015

12
Base: c.1,000 British adults each month Source: Ipsos MORI Political Monitor
Number of months from becoming Opposition Leader
HAGUE (1997-2001) DUNCAN SMITH (2001-2003)
Net satisfaction with Opposition Leaders
(1994 – 2015)
How satisfied or dissatisfied are you with the way … is doing his job as leader of the … Party?
CAMERON (2005-2010)
BLAIR (1994-1997)
MILIBAND (2010-2015)
HOWARD
(2003-2005)
Note: Data collected prior to February 2008 was collected via face-to-face methodology; data collected from February 2008 was via telephone
Net
sati
sfa
cti
on

13
26%
61%
13%
0
10
20
30
40
50
60
70
Ed Miliband (satisfaction)
Are you satisfied or dissatisfied with the way Ed Miliband is doing his job as leader of the Labour Party?
Source: Ipsos MORI Political Monitor
Dissatisfied
Satisfied
February 2011 – February 2015 February 2015
Satisfied Don’t know
Dissatisfied
Net = -35
Base: 1,010 British adults 18+, 8th – 10th February 2015
14
44%
44%
12%
0
10
20
30
40
50
60
70
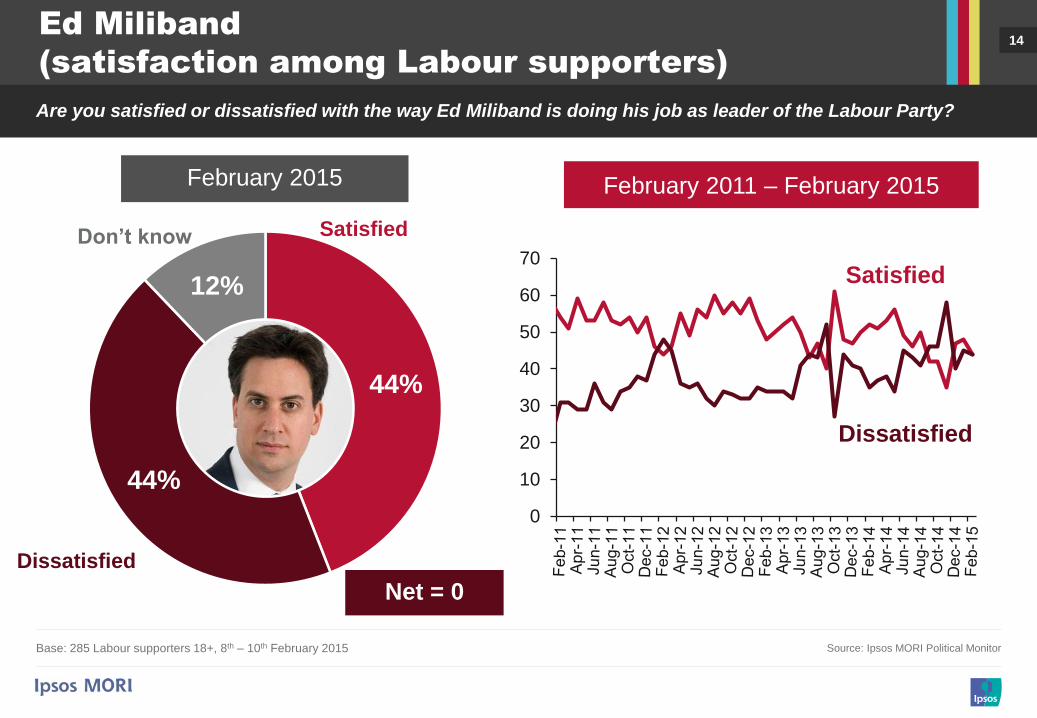
Base: 285 Labour supporters 18+, 8th – 10th February 2015
Ed Miliband
(satisfaction among Labour supporters)
Are you satisfied or dissatisfied with the way Ed Miliband is doing his job as leader of the Labour Party?
February 2015
Net = 0
Satisfied Don’t know
Dissatisfied
Source: Ipsos MORI Political Monitor
Dissatisfied
Satisfied
February 2011 – February 2015

15 Readiness of Labour and Ed Miliband for
government
On balance, do you agree or disagree with the following statements:
Source: Ipsos MORI Political Monitor Base: 1,010 British adults 18+, 8th -10th February 2015
7%
4%
8%
12%
7%
11%
15%
9%
13%
23%
16%
22%
9%
9%
11%
9%
12%
12%
22%
26%
20%
21%
26%
19%
43%
47%
43%
31%
35%
33%
4%
5%
4%
4%
4%
3%
Strongly agree Tend to agree Neither/nor
Tend to disagree Strongly disagree Don't know
Labour is ready
to form the next
government
Ed Miliband is
ready to be
Prime Minister
23%
35%
13%
22%
61%
52%
73%
65%
Feb ‘15
Nov ‘14
Jun ‘14
Feb ‘15
Nov ‘14
Jun ‘14
33% 52%
21% 63%

16
23%
64%
12%
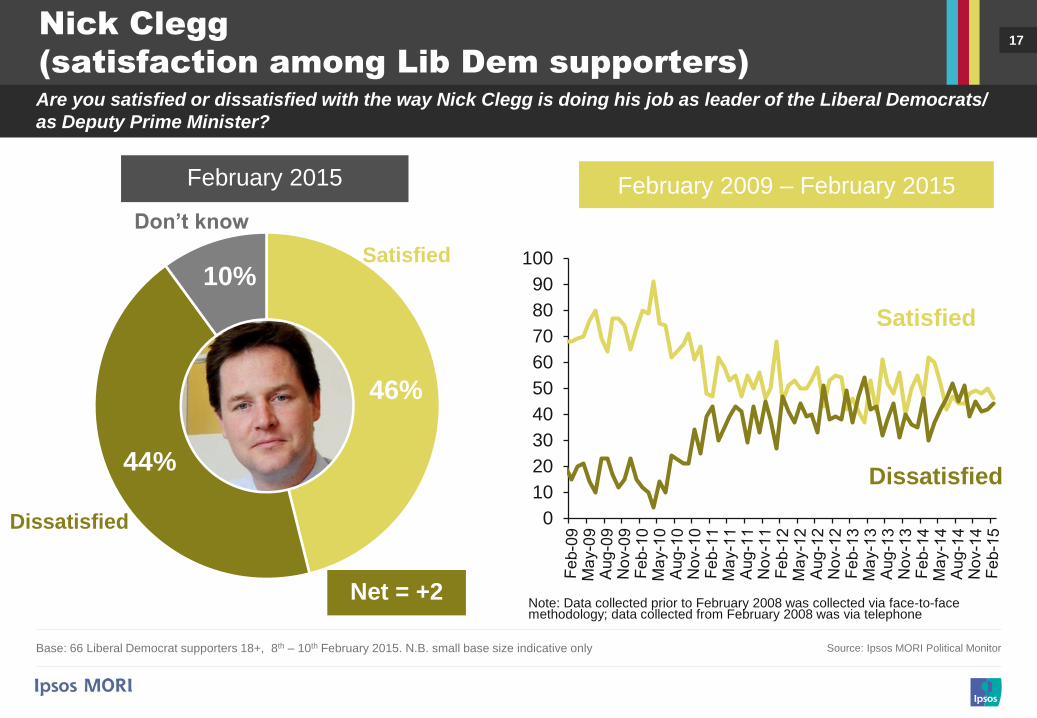
Nick Clegg (satisfaction)
Are you satisfied or dissatisfied with the way Nick Clegg is doing his job as leader of the Liberal Democrats/
as Deputy Prime Minister?
Source: Ipsos MORI Political Monitor
0
10
20
30
40
50
60
70
Note: Data collected prior to February 2008 was collected via face-to-face methodology; data collected from February 2008 was via telephone
Dissatisfied
Satisfied
February 2009 – February 2015 February 2015
Satisfied Don’t know
Dissatisfied
Net = -41
Base: 1,010 British adults 18+, 8th – 10th February 2015
17
0
10
20
30
40
50
60
70
80
90
100
Base: 66 Liberal Democrat supporters 18+, 8th – 10th February 2015. N.B. small base size indicative only
Dissatisfied
Satisfied
February 2015
46%
44%
10% Satisfied
Don’t know
Dissatisfied
Net = +2
Nick Clegg
(satisfaction among Lib Dem supporters)
Are you satisfied or dissatisfied with the way Nick Clegg is doing his job as leader of the Liberal Democrats/
as Deputy Prime Minister?
February 2009 – February 2015
Note: Data collected prior to February 2008 was collected via face-to-face methodology; data collected from February 2008 was via telephone
Source: Ipsos MORI Political Monitor

18
30%
53%
16%
Nigel Farage (satisfaction)
Are you satisfied or dissatisfied with the way Nigel Farage is doing his job as leader of UKIP, the UK
Independence Party?
Source: Ipsos MORI Political Monitor
All
Satisfied Don’t know
Dissatisfied
Net = -23
0
10
20
30
40
50
60
70
Dissatisfied
Satisfied
March 2013 – February 2015
Base: 1,010British adults 18+, 8th – 10th February 2015

19
94%
3% 4%
Are you satisfied or dissatisfied with the way Nigel Farage is doing his job as leader of UKIP, the UK
Independence Party?
Nigel Farage
(satisfaction among UKIP supporters)
Base: 67 UKIP supporters, 8th -10th February 2015. N.B. small base size indicative only
UKIP supporters
Satisfied
Don’t know Dissatisfied
0
10
20
30
40
50
60
70
80
90
100
Dissatisfied
Satisfied
March 2013 – February 2015
Net = +91
Source: Ipsos MORI Political Monitor

The economy
21
0
10
20
30
40
50
60
70
80
Feb-0
5M
ay-0
5A
ug
-05
Nov-0
5F
eb-0
6M
ay-0
6A
ug
-06
Nov-0
6F
eb-0
7M
ay-0
7A
ug
-07
Nov-0
7F
eb-0
8M
ay-0
8A
ug
-08
Nov-0
8F
eb-0
9M
ay-0
9A
ug
-09
Nov-0
9F
eb-1
0M
ay-1
0A
ug
-10
Nov-1
0F
eb-1
1M
ay-1
1A
ug
-11
Nov-1
1F
eb-1
2M
ay-1
2A
ug
-12
Nov-1
2F
eb-1
3M
ay-1
3A
ug
-13
Nov-1
3F
eb-1
4M
ay-1
4A
ug
-14
Nov-1
4F
eb-1
5
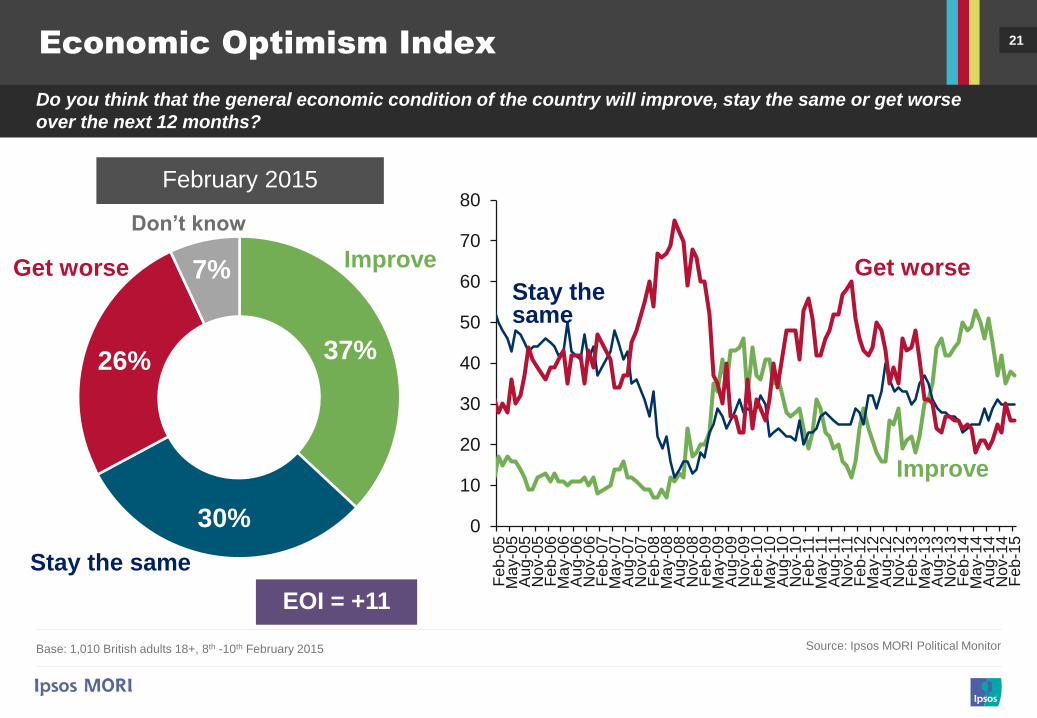
Economic Optimism Index
Do you think that the general economic condition of the country will improve, stay the same or get worse
over the next 12 months?
Source: Ipsos MORI Political Monitor
Improve
Stay the same
Get worse Improve
Don’t know
Get worse
Stay the same
February 2015
EOI = +11
37%
30%
26%
7%
Base: 1,010 British adults 18+, 8th -10th February 2015

22
-80
-60
-40
-20
0
20
40
Ma
y-9
7A
ug
-97
No
v-9
7F
eb
-98
Ma
y-9
8A
ug-9
8N
ov-9
8F
eb
-99
Ma
y-9
9A
ug
-99
No
v-9
9F
eb
-00
Ma
y-0
0A
ug
-00
No
v-0
0F
eb-0
1M
ay-0
1A
ug
-01
No
v-0
1F
eb
-02
Ma
y-0
2A
ug
-02
No
v-0
2F
eb
-03
Ma
y-0
3A
ug
-03
No
v-0
3F
eb
-04
Ma
y-0
4A
ug
-04
No
v-0
4F
eb
-05
May-0
5A
ug
-05
No
v-0
5F
eb
-06
Ma
y-0
6A
ug
-06
No
v-0
6F
eb
-07
Ma
y-0
7A
ug
-07
No
v-0
7F
eb
-08
Ma
y-0
8A
ug
-08
No
v-0
8F
eb
-09
Ma
y-0
9A
ug-0
9N
ov-0
9F
eb
-10
Ma
y-1
0A
ug
-10
No
v-1
0F
eb
-11
Ma
y-1
1A
ug
-11
No
v-1
1F
eb
-12
Ma
y-1
2A
ug
-12
No
v-1
2F
eb
-13
Ma
y-1
3A
ug
-13
No
v-1
3F
eb
-14
Ma
y-1
4A
ug
-14
No
v-1
4F
eb
-15
Do you think that the general economic condition of the country will improve, stay the same or get worse
over the next 12 months?
Base: c.1,000 British adults each month
+28
-46
-56
-48
+23
The Ipsos MORI Economic Optimism Index
Ind
ex
(g
et
be
tte
r m
inu
s g
et
wo
rse)
-64
Source: Ipsos MORI Political Monitor
+11
+35
Voting decisions
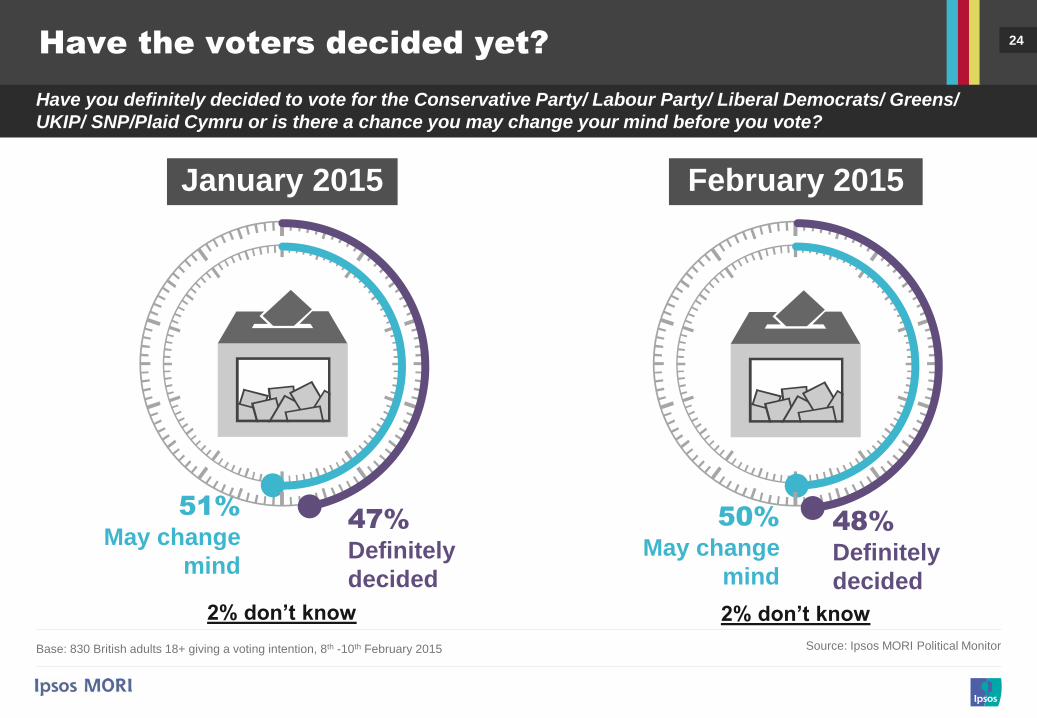
24 Have the voters decided yet?
Have you definitely decided to vote for the Conservative Party/ Labour Party/ Liberal Democrats/ Greens/
UKIP/ SNP/Plaid Cymru or is there a chance you may change your mind before you vote?
Source: Ipsos MORI Political Monitor Base: 830 British adults 18+ giving a voting intention, 8th -10th February 2015
January 2015 February 2015
47%
Definitely
decided
51% May change
mind
48%
Definitely
decided
50% May change
mind
2% don’t know 2% don’t know

25 Have the voters decided yet? Trend
Have you definitely decided to vote for the Conservative Party/ Labour Party/ Liberal Democrats/ Greens/
UKIP/ SNP/Plaid Cymru or is there a chance you may change your mind before you vote?
Source: Ipsos MORI Political Monitor Base: 830 British adults 18+ giving a voting intention, 8th -10th February 2015
Definitely decided May change mind Don’t know
February 2015
January 2015
August 2014 43%
47%
48%
56%
51%
50%
2%
2%
2%